| Param | Original file | Final file |
|---|---|---|
| Filename | modeM0/AS1A10_103T01_9000004132_28800cztM0_level2.evt | modeM0/AS1A10_103T01_9000004132_28800cztM0_level2_quad_clean.evt |
| Size (bytes) | 613,353,600 | 114,246,720 |
| Size | 584.9 MB | 109.0 MB |
| Events in quadrant A | 3,952,371 | 739,073 |
| Events in quadrant B | 3,942,213 | 758,058 |
| Events in quadrant C | 4,065,155 | 714,693 |
| Events in quadrant D | 6,072,526 | 690,910 |
| Mode SS | |||
|---|---|---|---|
| Quadrant | BADHDUFLAG | Total packets | Discarded packets |
| A | 0 | 164 | 0 |
| B | 0 | 164 | 0 |
| C | 0 | 164 | 0 |
| D | 0 | 164 | 0 |
| Mode M0 | |||
|---|---|---|---|
| Quadrant | BADHDUFLAG | Total packets | Discarded packets |
| A | 0 | 16797 | 2 |
| B | 0 | 16763 | 2 |
| C | 0 | 17005 | 2 |
| D | 0 | 23648 | 2 |
| Mode M9 | |||
|---|---|---|---|
| Quadrant | BADHDUFLAG | Total packets | Discarded packets |
| A | 0 | 18 | 0 |
| B | 0 | 18 | 0 |
| C | 0 | 18 | 0 |
| D | 0 | 18 | 0 |
| Quadrant | Total seconds | Saturated seconds | Saturation percentage |
|---|---|---|---|
| A | 8017 | 76 | 0.947986% |
| B | 8018 | 76 | 0.947867% |
| C | 8017 | 246 | 3.068479% |
| D | 8017 | 324 | 4.041412% |
Noise dominated data is calculated using 1-second bins in cleaned event files. If a bin has >2000 counts, and if more than 50% of those come from <1% of pixels, then it is considered to be noise-dominated and hence unusable.
| Quadrant | # 1 sec bins | Bins with >0 counts | Bins with >2000 counts | High rate bins dominated by noise | Noise dominated (total time) | Noise dominated (detector-on time) | Marked lightcurve |
|---|---|---|---|---|---|---|---|
| A | 9782 | 8017 | 1 | 1 | 0.01% | 0.01% | 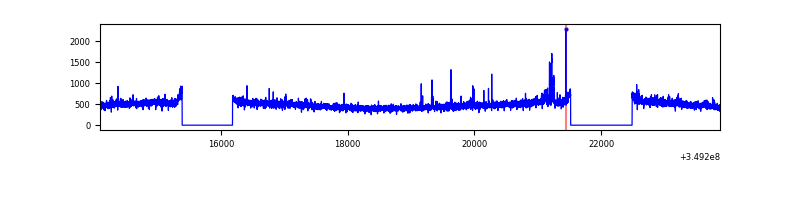 |
| B | 9783 | 8018 | 0 | 0 | 0.00% | 0.00% | 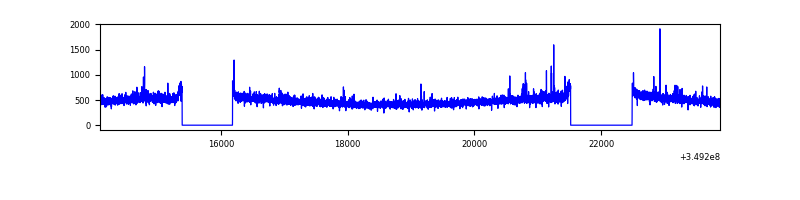 |
| C | 9782 | 8017 | 0 | 0 | 0.00% | 0.00% | 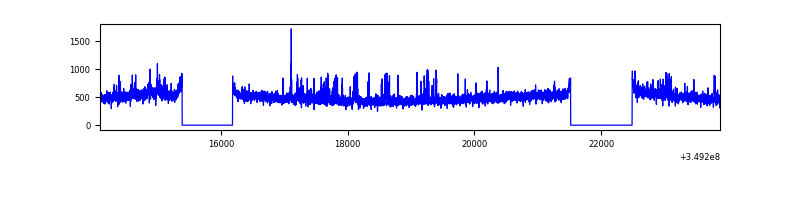 |
| D | 9781 | 8016 | 230 | 230 | 2.35% | 2.87% |  |
Top three noisy pixels from each quadrant. If the there are fewer than three noisy pixels in the level2.evt file, extra rows are filled as -1
| Pixel properties | Quadrant properties | ||||||
|---|---|---|---|---|---|---|---|
| Quadrant | DetID | PixID | Counts | Sigma | Mean | Median | Sigma |
| A | 15 | 174 | 50886 | 249.53 | 993 | 971 | 200.0 |
| A | 14 | 235 | 32633 | 158.28 | 993 | 971 | 200.0 |
| A | 14 | 239 | 25755 | 123.9 | 993 | 971 | 200.0 |
| B | 5 | 255 | 24396 | 122.88 | 991 | 965 | 190.7 |
| B | 12 | 111 | 23260 | 116.92 | 991 | 965 | 190.7 |
| B | 11 | 111 | 21278 | 106.53 | 991 | 965 | 190.7 |
| C | 14 | 238 | 217731 | 971.9 | 949 | 957 | 223.0 |
| C | 14 | 254 | 95791 | 425.18 | 949 | 957 | 223.0 |
| C | 3 | 233 | 26770 | 115.73 | 949 | 957 | 223.0 |
| D | 1 | 52 | 1683647 | 7392.49 | 948 | 921 | 227.6 |
| D | 8 | 195 | 560650 | 2458.98 | 948 | 921 | 227.6 |
| D | 12 | 233 | 84164 | 365.7 | 948 | 921 | 227.6 |
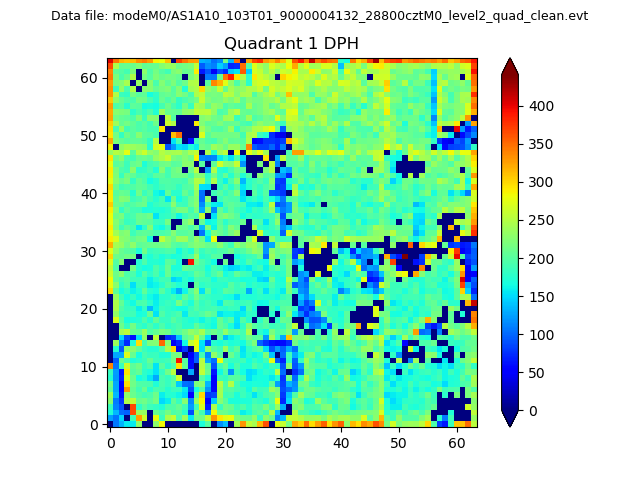
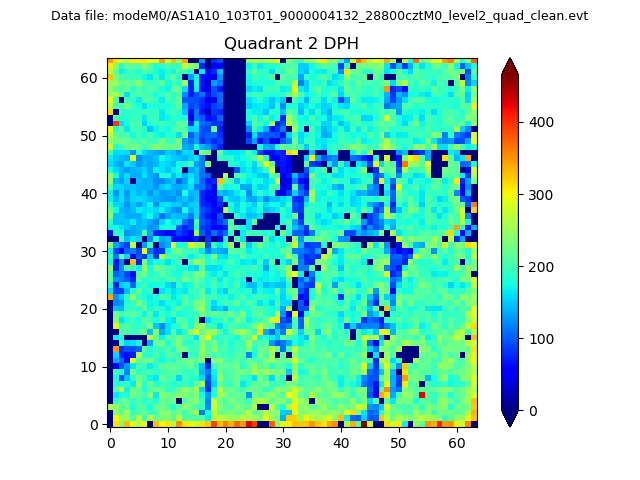
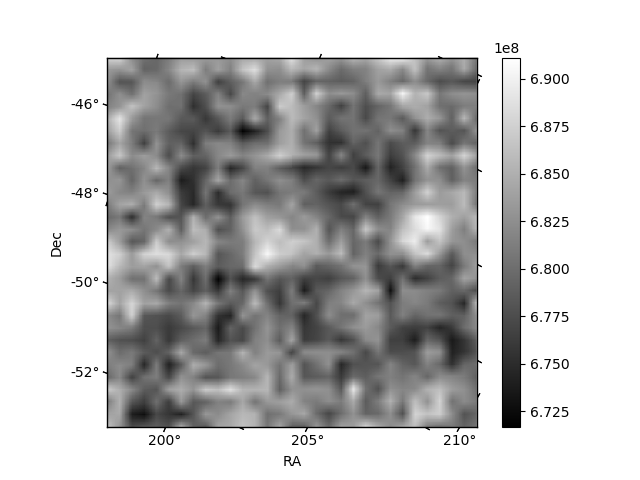
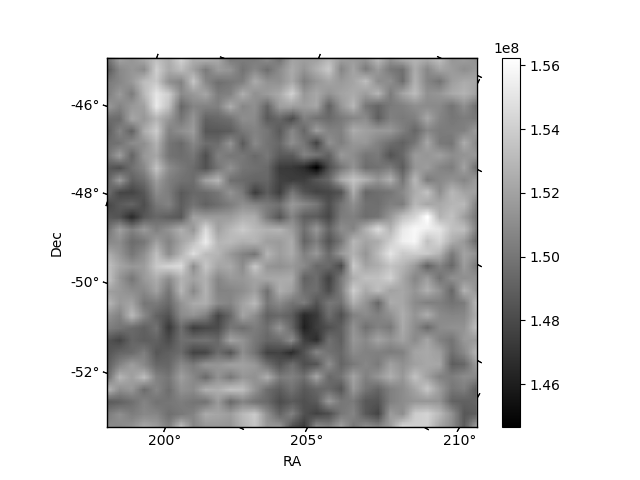
Histogram calculated using DETX and DETY for each event in the final _common_clean file
| Quadrant A | 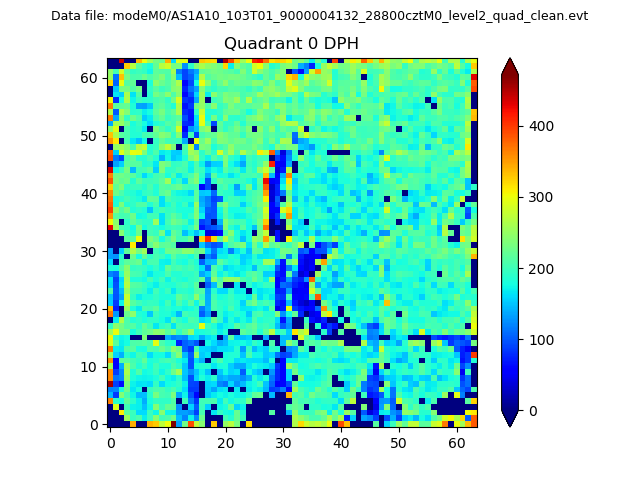 |
 |
Quadrant B |
|---|---|---|---|
| Quadrant D | 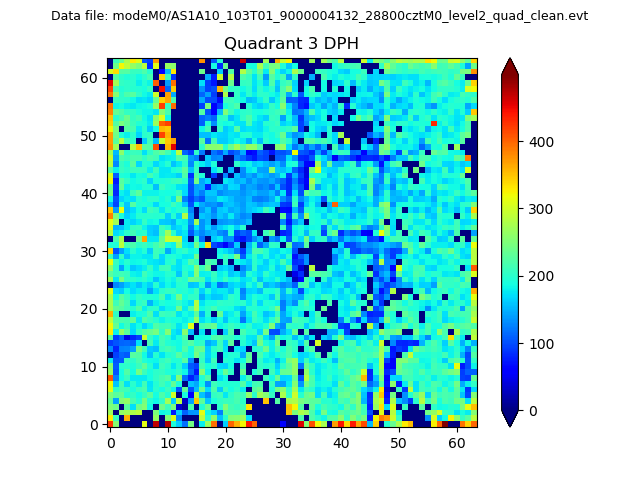 |
 |
Quadrant C |
| Plot type | Count rate plots | Images |
|---|---|---|
| Comparison with Poisson distribution Blue bars denote a histogram of data divided into 1 sec bins. Red curve is a Poisson curve with rate = median count rate of data. |
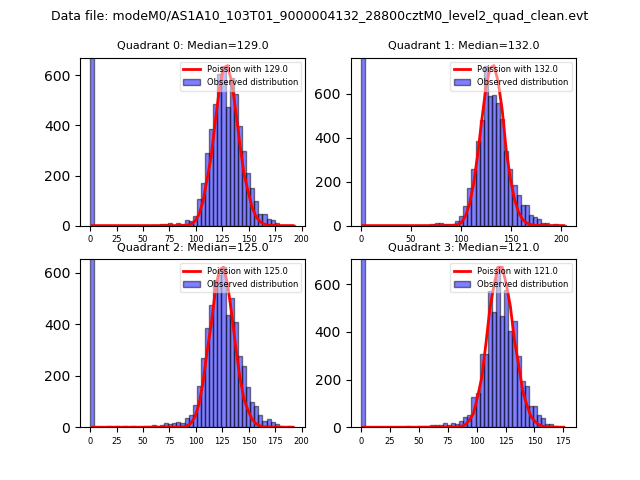 |
 |
| Quadrant-wise count rates Data is divided into 100 sec bins |
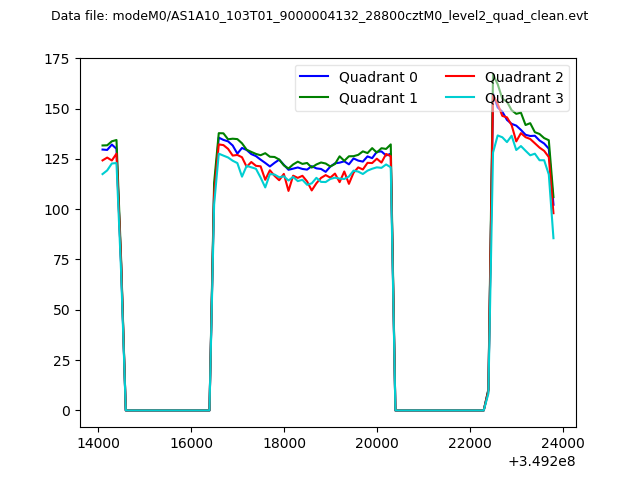 |
|
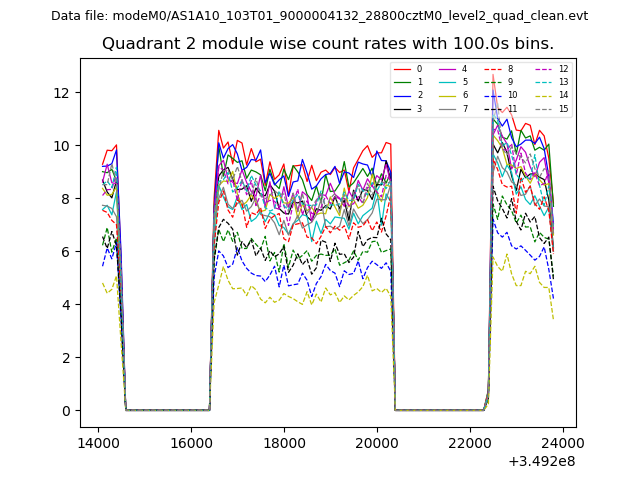
| Module-wise count rates for Quadrant A Data is divided into 100 sec bins |
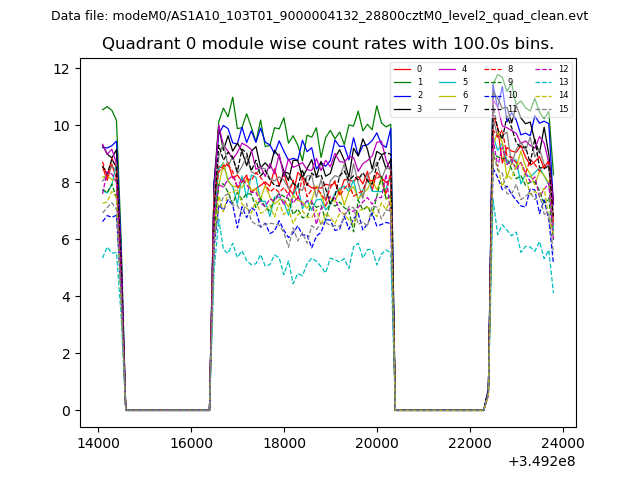 |
 |
| Module-wise count rates for Quadrant B Data is divided into 100 sec bins |
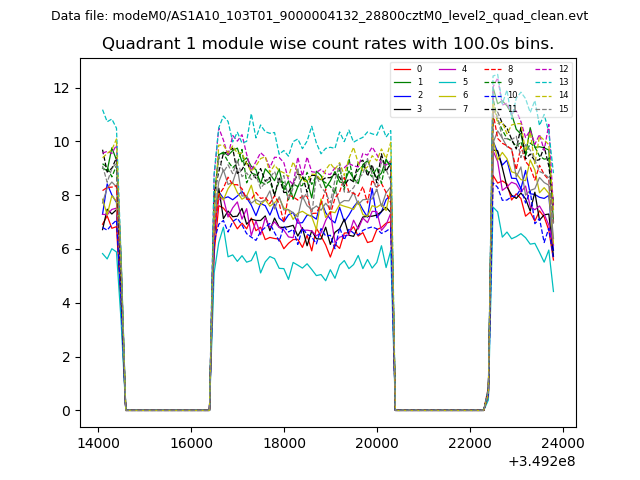 |
 |
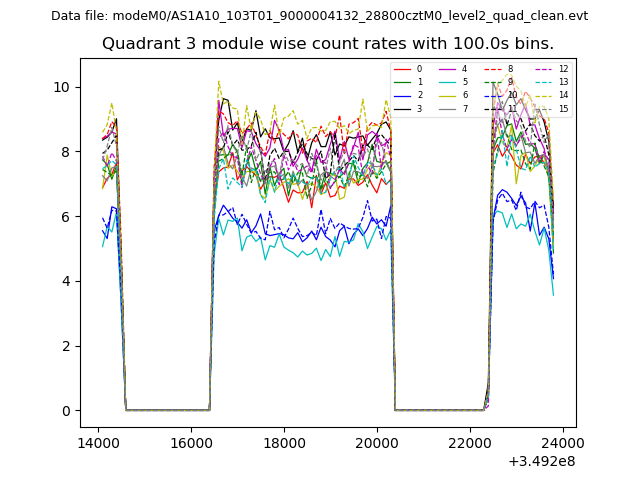
| Module-wise count rates for Quadrant C Data is divided into 100 sec bins |
 |
 |
| Module-wise count rates for Quadrant D Data is divided into 100 sec bins |
 |
 |
| Parameter | Plot |
|---|---|
| CZT HV Monitor | 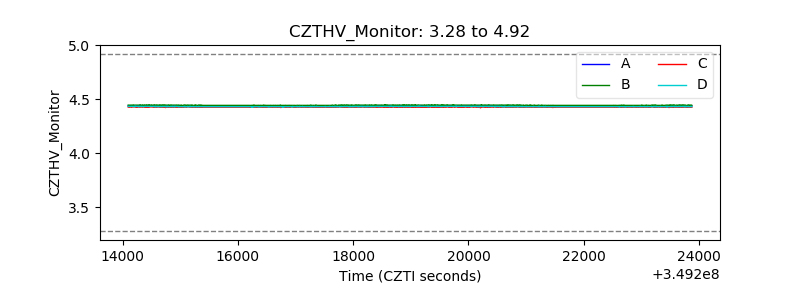 |
| D_VDD |  |
| Temperature 1 | 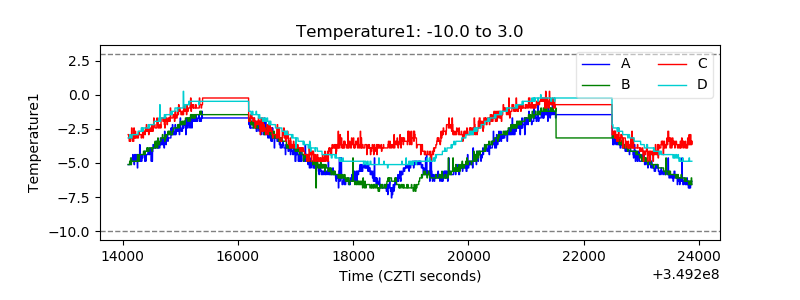 |
| Veto HV Monitor | 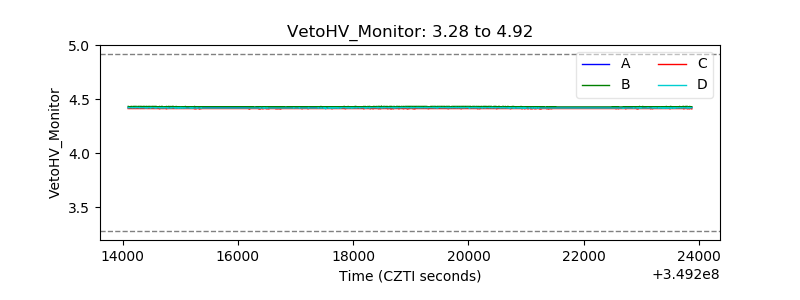 |
| Veto LLD | 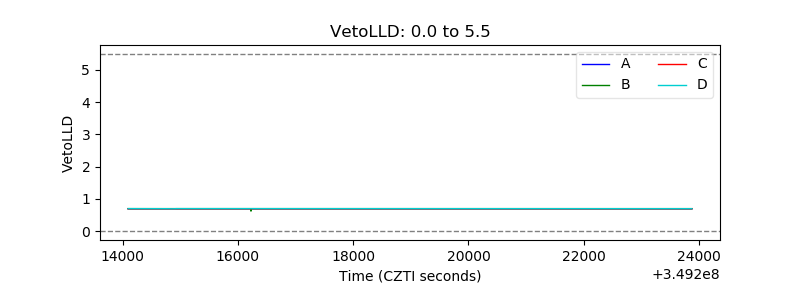 |
| Alpha Counter | 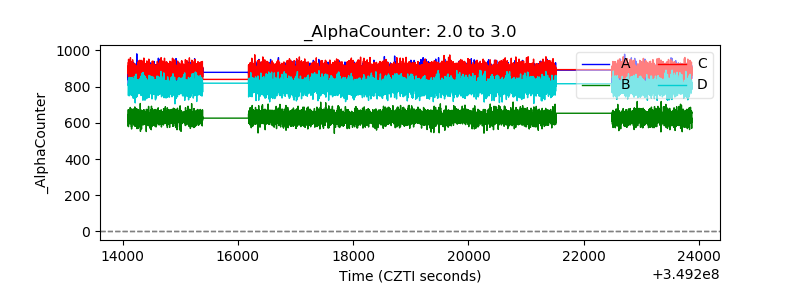 |
| _CPM_Rate | 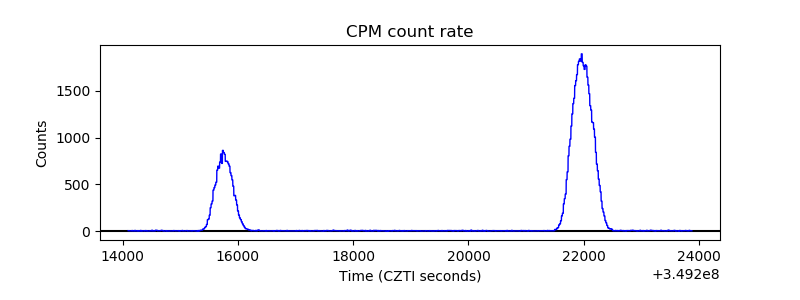 |
| CZT Counter | 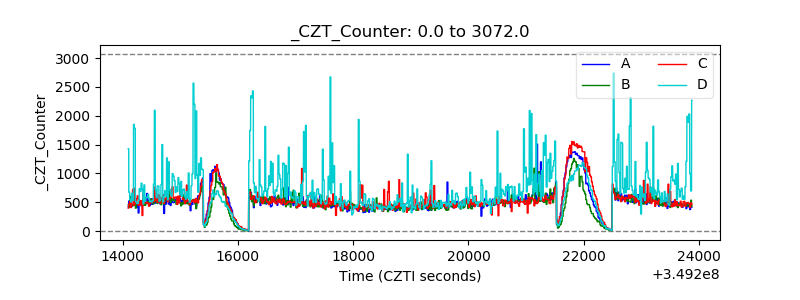 |
| +2.5 Volts monitor |  |
| +5 Volts monitor |  |
| _ROLL_ROT | 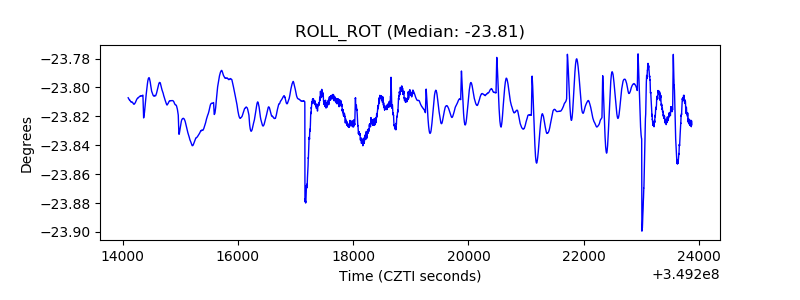 |
| _Roll_DEC | 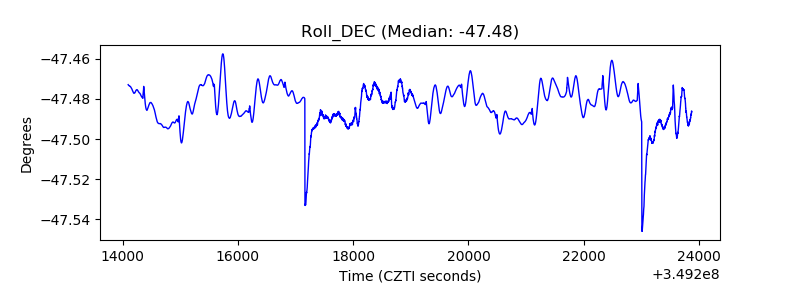 |
| _Roll_RA | 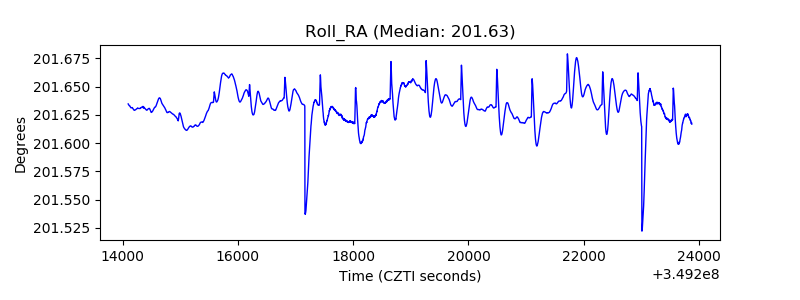 |
| Veto Counter | 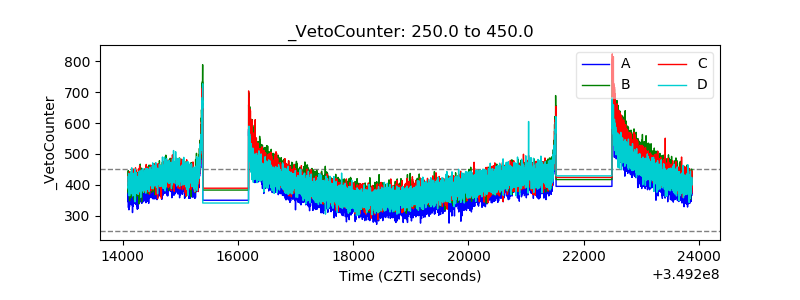 |