| Param | Original file | Final file |
|---|---|---|
| Filename | modeM0/AS1A10_103T01_9000004132_28802cztM0_level2.evt | modeM0/AS1A10_103T01_9000004132_28802cztM0_level2_quad_clean.evt |
| Size (bytes) | 564,474,240 | 104,973,120 |
| Size | 538.3 MB | 100.1 MB |
| Events in quadrant A | 3,173,708 | 695,793 |
| Events in quadrant B | 3,258,860 | 721,852 |
| Events in quadrant C | 3,396,488 | 684,101 |
| Events in quadrant D | 6,825,295 | 623,696 |
| Mode SS | |||
|---|---|---|---|
| Quadrant | BADHDUFLAG | Total packets | Discarded packets |
| A | 0 | 130 | 0 |
| B | 0 | 130 | 0 |
| C | 0 | 130 | 0 |
| D | 0 | 130 | 0 |
| Mode M0 | |||
|---|---|---|---|
| Quadrant | BADHDUFLAG | Total packets | Discarded packets |
| A | 0 | 13644 | 2 |
| B | 0 | 13873 | 2 |
| C | 0 | 14108 | 2 |
| D | 0 | 24797 | 2 |
| Mode M9 | |||
|---|---|---|---|
| Quadrant | BADHDUFLAG | Total packets | Discarded packets |
| A | 0 | 18 | 0 |
| B | 0 | 19 | 0 |
| C | 0 | 19 | 0 |
| D | 0 | 19 | 0 |
| Quadrant | Total seconds | Saturated seconds | Saturation percentage |
|---|---|---|---|
| A | 6511 | 30 | 0.460759% |
| B | 6511 | 47 | 0.721855% |
| C | 6511 | 122 | 1.873752% |
| D | 6511 | 792 | 12.164030% |
Noise dominated data is calculated using 1-second bins in cleaned event files. If a bin has >2000 counts, and if more than 50% of those come from <1% of pixels, then it is considered to be noise-dominated and hence unusable.
| Quadrant | # 1 sec bins | Bins with >0 counts | Bins with >2000 counts | High rate bins dominated by noise | Noise dominated (total time) | Noise dominated (detector-on time) | Marked lightcurve |
|---|---|---|---|---|---|---|---|
| A | 7621 | 6511 | 0 | 0 | 0.00% | 0.00% | 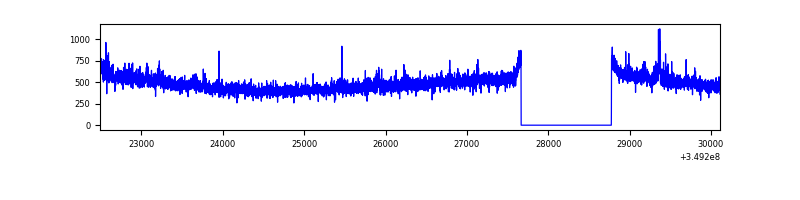 |
| B | 7621 | 6511 | 1 | 1 | 0.01% | 0.02% | 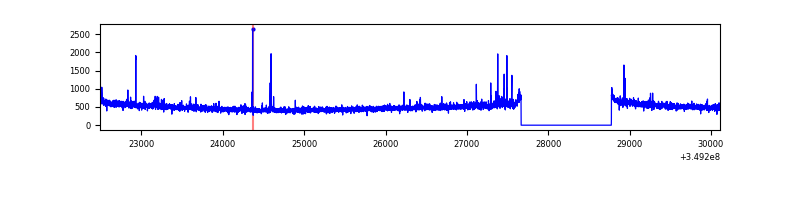 |
| C | 7621 | 6511 | 0 | 0 | 0.00% | 0.00% |  |
| D | 7621 | 6511 | 725 | 725 | 9.51% | 11.14% | 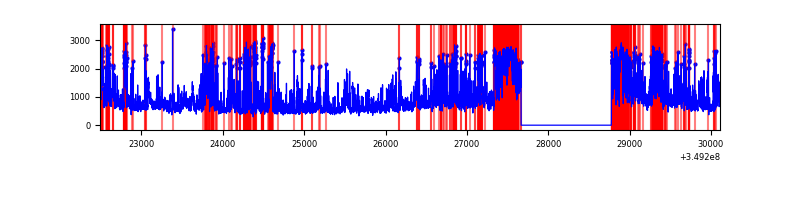 |
Top three noisy pixels from each quadrant. If the there are fewer than three noisy pixels in the level2.evt file, extra rows are filled as -1
| Pixel properties | Quadrant properties | ||||||
|---|---|---|---|---|---|---|---|
| Quadrant | DetID | PixID | Counts | Sigma | Mean | Median | Sigma |
| A | 14 | 239 | 18719 | 110.96 | 807 | 792 | 161.6 |
| A | 15 | 174 | 18187 | 107.66 | 807 | 792 | 161.6 |
| A | 13 | 254 | 12374 | 71.69 | 807 | 792 | 161.6 |
| B | 5 | 255 | 26564 | 167.78 | 812 | 792 | 153.6 |
| B | 12 | 111 | 18791 | 117.18 | 812 | 792 | 153.6 |
| B | 11 | 111 | 16972 | 105.33 | 812 | 792 | 153.6 |
| C | 14 | 238 | 157993 | 860.2 | 783 | 790 | 182.8 |
| C | 3 | 233 | 91516 | 496.44 | 783 | 790 | 182.8 |
| C | 14 | 254 | 48620 | 261.72 | 783 | 790 | 182.8 |
| D | 1 | 52 | 1853262 | 10423.8 | 742 | 722 | 177.7 |
| D | 8 | 195 | 1087200 | 6113.35 | 742 | 722 | 177.7 |
| D | 12 | 233 | 993709 | 5587.3 | 742 | 722 | 177.7 |
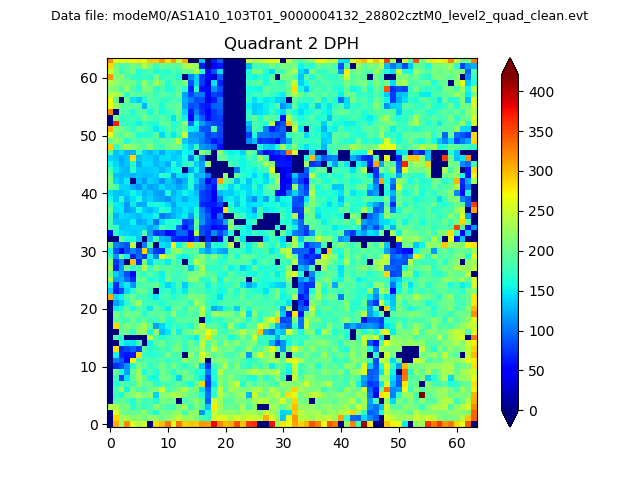
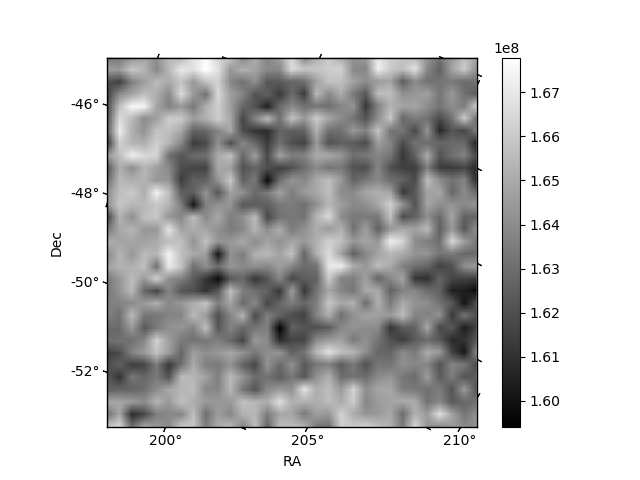
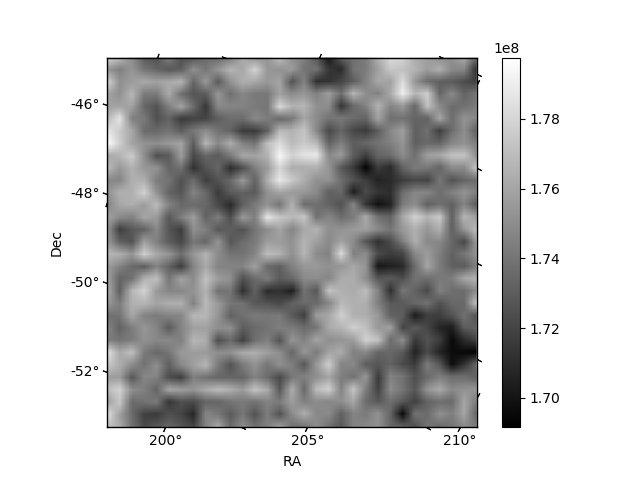
Histogram calculated using DETX and DETY for each event in the final _common_clean file
| Quadrant A | 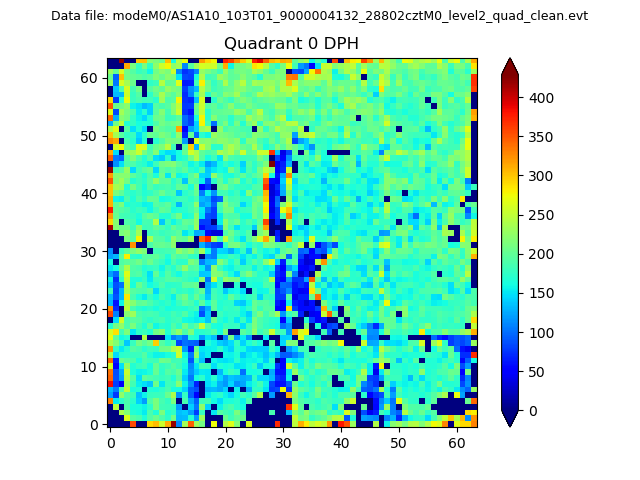 |
 |
Quadrant B |
|---|---|---|---|
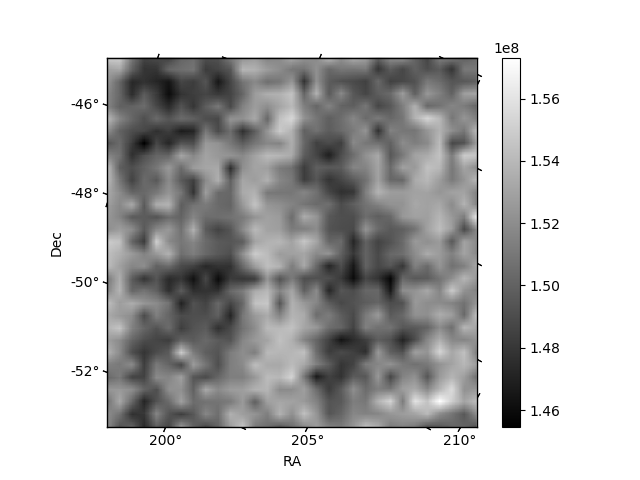
| Quadrant D |  |
 |
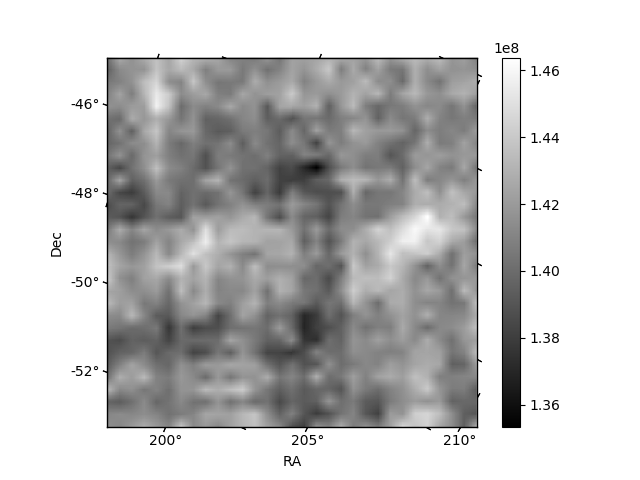
Quadrant C |
| Plot type | Count rate plots | Images |
|---|---|---|
| Comparison with Poisson distribution Blue bars denote a histogram of data divided into 1 sec bins. Red curve is a Poisson curve with rate = median count rate of data. |
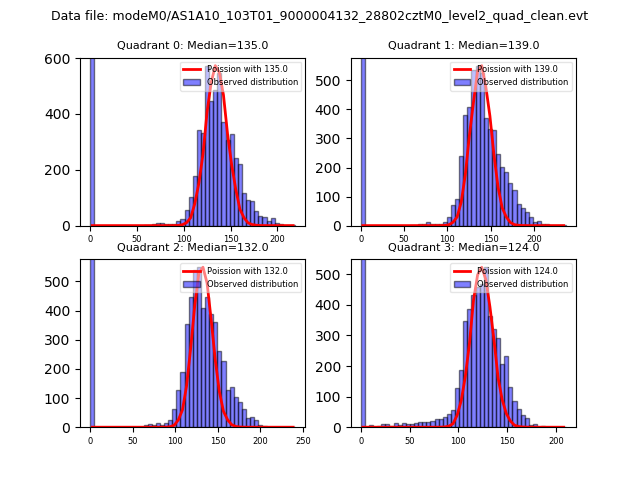 |
 |
| Quadrant-wise count rates Data is divided into 100 sec bins |
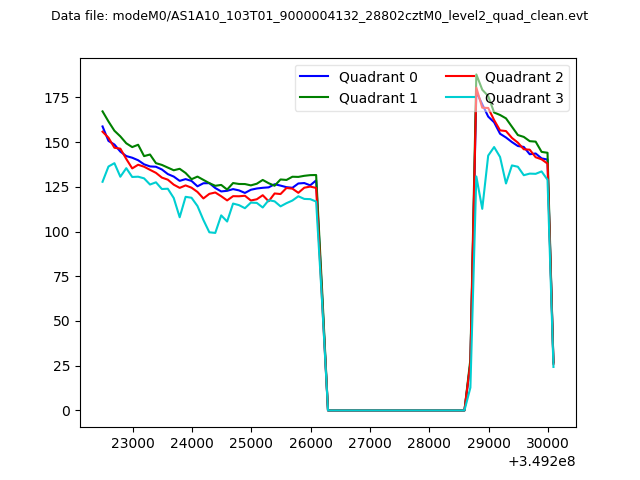 |
|
| Module-wise count rates for Quadrant A Data is divided into 100 sec bins |
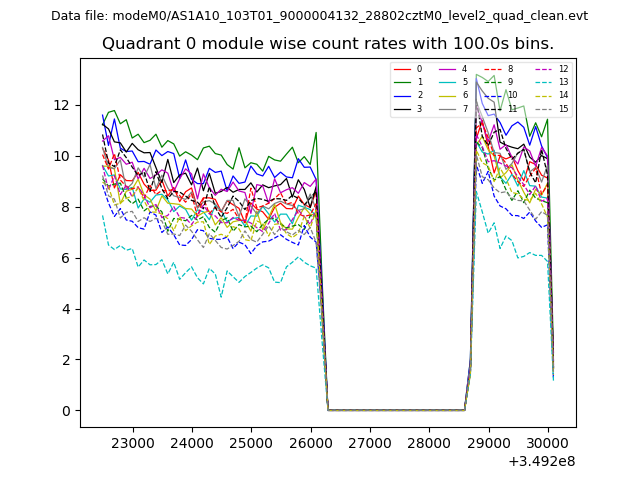 |
 |
| Module-wise count rates for Quadrant B Data is divided into 100 sec bins |
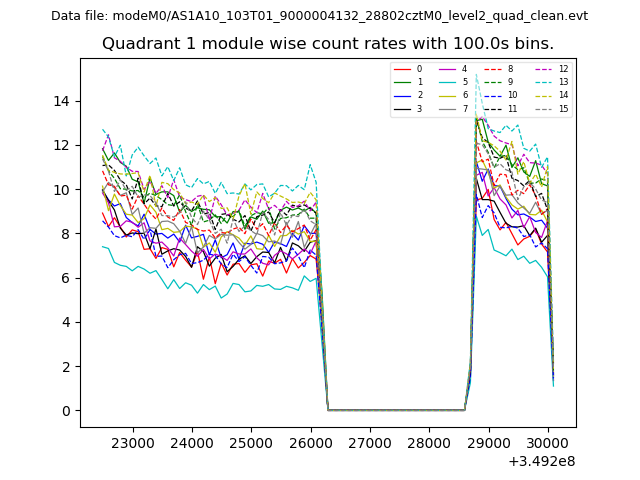 |
 |
| Module-wise count rates for Quadrant C Data is divided into 100 sec bins |
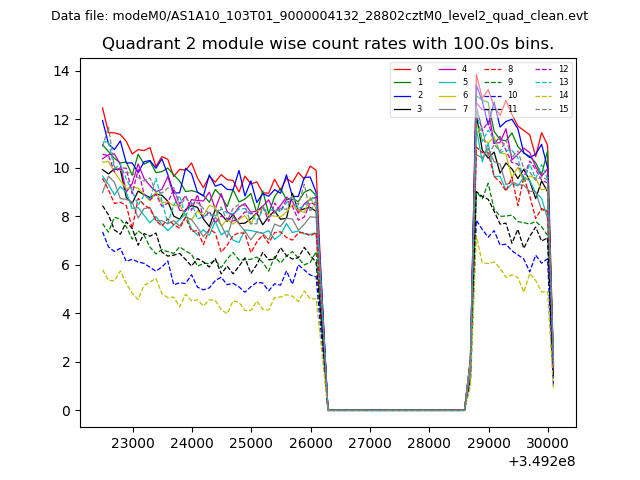 |
 |
| Module-wise count rates for Quadrant D Data is divided into 100 sec bins |
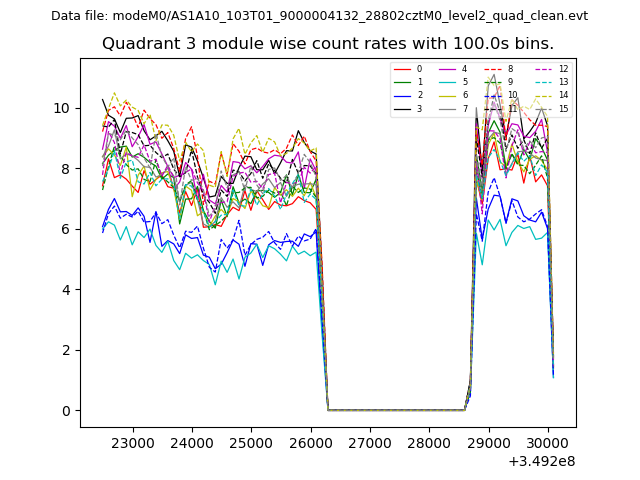 |
 |
| Parameter | Plot |
|---|---|
| CZT HV Monitor | 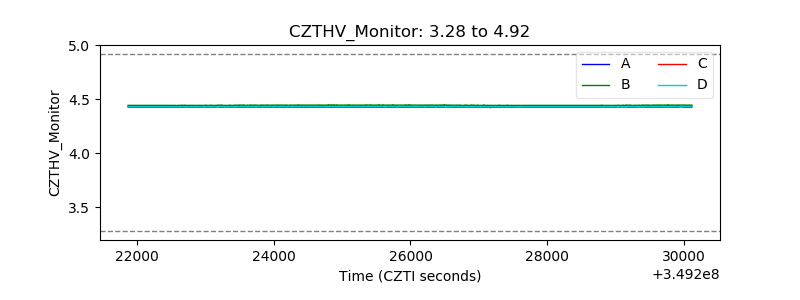 |
| D_VDD | 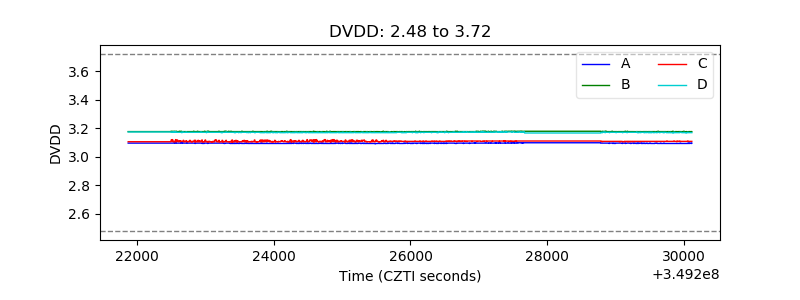 |
| Temperature 1 | 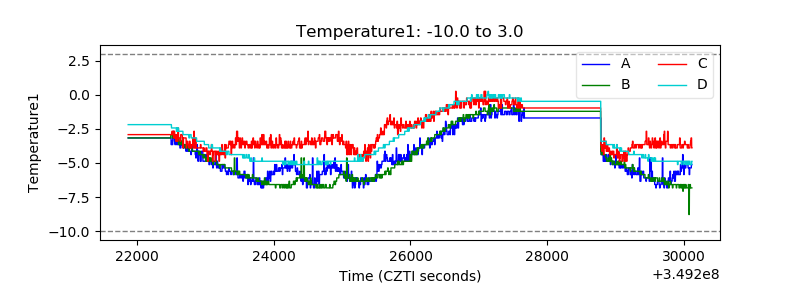 |
| Veto HV Monitor | 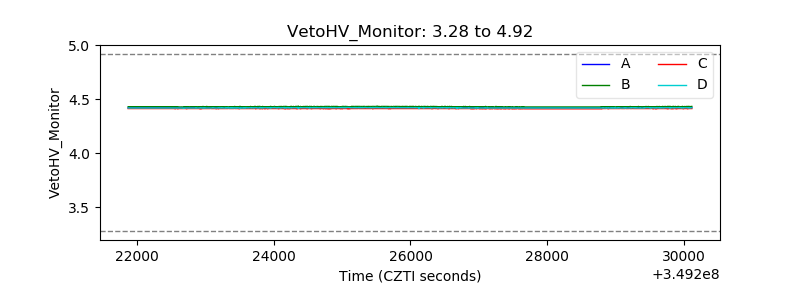 |
| Veto LLD | 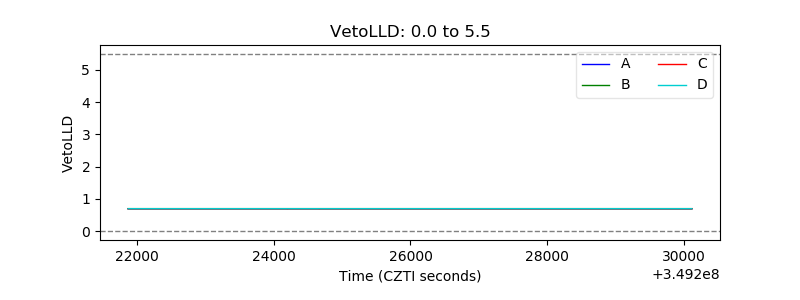 |
| Alpha Counter | 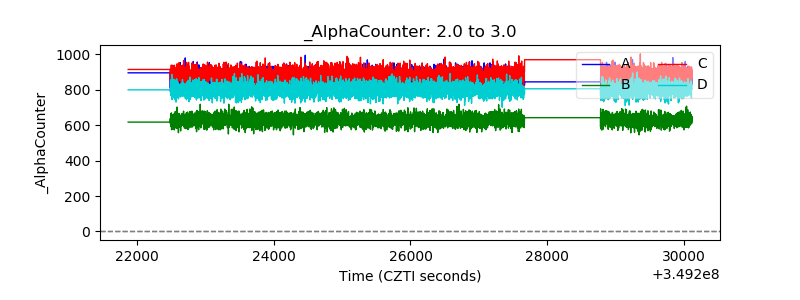 |
| _CPM_Rate | 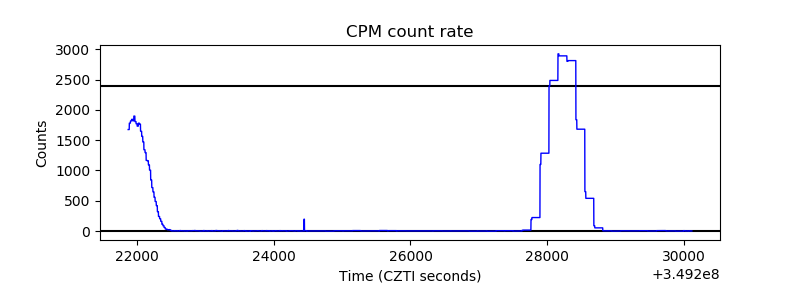 |
| CZT Counter | 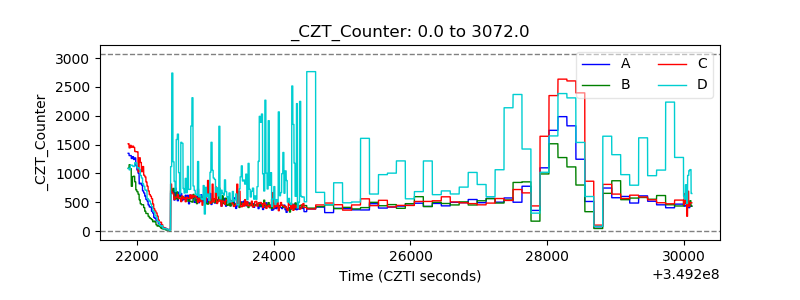 |
| +2.5 Volts monitor |  |
| +5 Volts monitor |  |
| _ROLL_ROT | 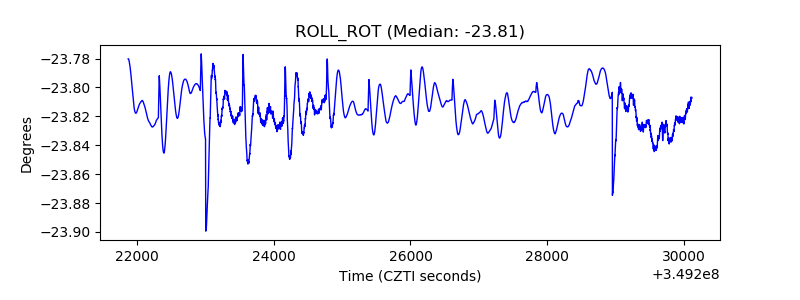 |
| _Roll_DEC | 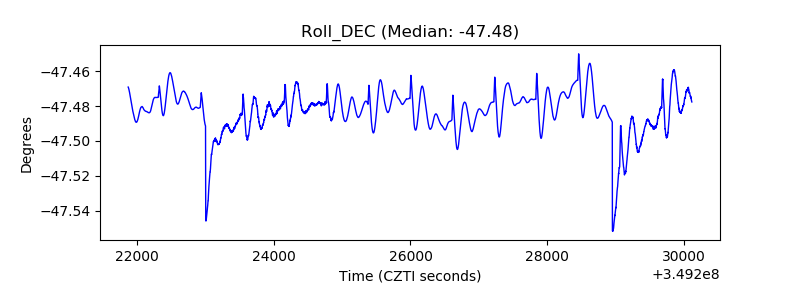 |
| _Roll_RA | 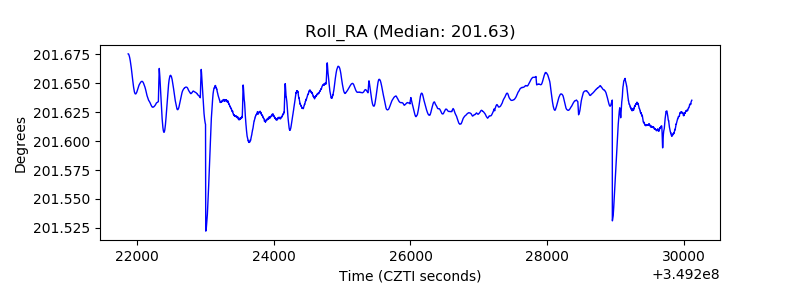 |
| Veto Counter | 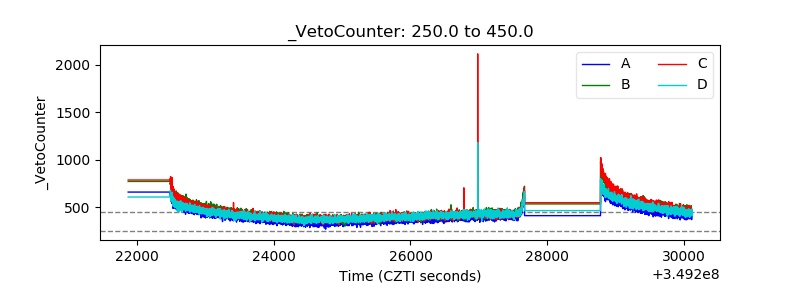 |