| Param | Original file | Final file |
|---|---|---|
| Filename | modeM0/AS1A10_121T01_9000004134cztM0_level2.fits | modeM0/AS1A10_121T01_9000004134cztM0_level2_quad_clean.evt |
| Size (bytes) | 1,965,147,840 | 1,906,542,720 |
| Size | 1.8 GB | 1.8 GB |
| Events in quadrant A | 12,367,548 | 12,200,770 |
| Events in quadrant B | 11,872,716 | 12,262,108 |
| Events in quadrant C | 11,894,724 | 11,216,695 |
| Events in quadrant D | 9,350,732 | 8,063,185 |
| Mode M9 | |||
|---|---|---|---|
| Quadrant | BADHDUFLAG | Total packets | Discarded packets |
| A | 0 | 310 | 0 |
| B | 0 | 310 | 0 |
| C | 0 | 310 | 0 |
| D | 0 | 310 | 0 |
| Mode M0 | |||
|---|---|---|---|
| Quadrant | BADHDUFLAG | Total packets | Discarded packets |
| A | 0 | 437691 | 0 |
| B | 0 | 456839 | 0 |
| C | 0 | 578843 | 0 |
| D | 0 | 987248 | 0 |
| Mode SS | |||
|---|---|---|---|
| Quadrant | BADHDUFLAG | Total packets | Discarded packets |
| A | 0 | 4170 | 0 |
| B | 0 | 4170 | 0 |
| C | 0 | 4170 | 0 |
| D | 0 | 4170 | 0 |
| Quadrant | Total seconds | Saturated seconds | Saturation percentage |
|---|---|---|---|
| A | 204272 | 3626 | 1.775084% |
| B | 204272 | 5960 | 2.917678% |
| C | 204272 | 16468 | 8.061800% |
| D | 204272 | 57946 | 28.367079% |
Noise dominated data is calculated using 1-second bins in cleaned event files. If a bin has >2000 counts, and if more than 50% of those come from <1% of pixels, then it is considered to be noise-dominated and hence unusable.
| Quadrant | # 1 sec bins | Bins with >0 counts | Bins with >2000 counts | High rate bins dominated by noise | Noise dominated (total time) | Noise dominated (detector-on time) | Marked lightcurve |
|---|---|---|---|---|---|---|---|
| A | 235657 | 204223 | 0 | 0 | 0.00% | 0.00% |  |
| B | 235658 | 204190 | 0 | 0 | 0.00% | 0.00% |  |
| C | 235657 | 203891 | 0 | 0 | 0.00% | 0.00% | 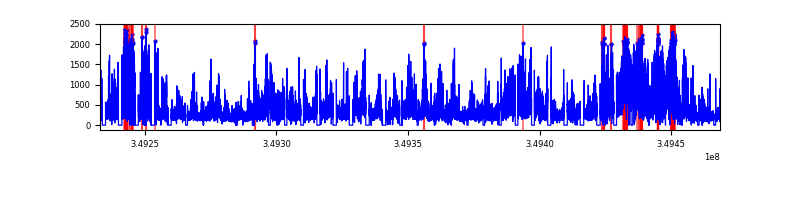 |
| D | 235655 | 203794 | 0 | 0 | 0.00% | 0.00% | 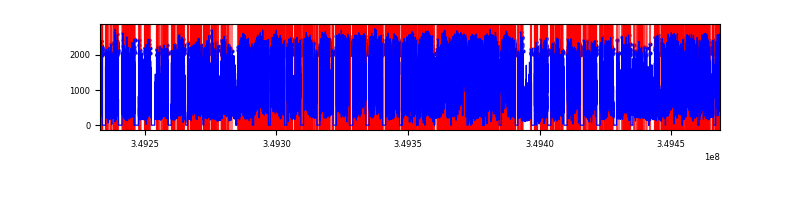 |
Top three noisy pixels from each quadrant. If the there are fewer than three noisy pixels in the level2.evt file, extra rows are filled as -1
| Pixel properties | Quadrant properties | ||||||
|---|---|---|---|---|---|---|---|
| Quadrant | DetID | PixID | Counts | Sigma | Mean | Median | Sigma |
| A | 0 | 29 | 10407 | 9.49 | 3228 | 3045 | 775.6 |
| A | 7 | 110 | 9832 | 8.75 | 3228 | 3045 | 775.6 |
| A | 9 | 19 | 9506 | 8.33 | 3228 | 3045 | 775.6 |
| B | 2 | 9 | 9489 | 10.73 | 3150 | 3014 | 603.5 |
| B | 2 | 8 | 8020 | 8.29 | 3150 | 3014 | 603.5 |
| B | 3 | 80 | 7877 | 8.06 | 3150 | 3014 | 603.5 |
| C | 12 | 241 | 8455 | 6.98 | 3147 | 2958 | 787.9 |
| C | 3 | 187 | 8020 | 6.42 | 3147 | 2958 | 787.9 |
| C | 3 | 126 | 8020 | 6.42 | 3147 | 2958 | 787.9 |
| D | 15 | 46 | 7044 | 6.52 | 2677 | 2437 | 706.2 |
| D | 3 | 14 | 6829 | 6.22 | 2677 | 2437 | 706.2 |
| D | 6 | 67 | 6614 | 5.91 | 2677 | 2437 | 706.2 |
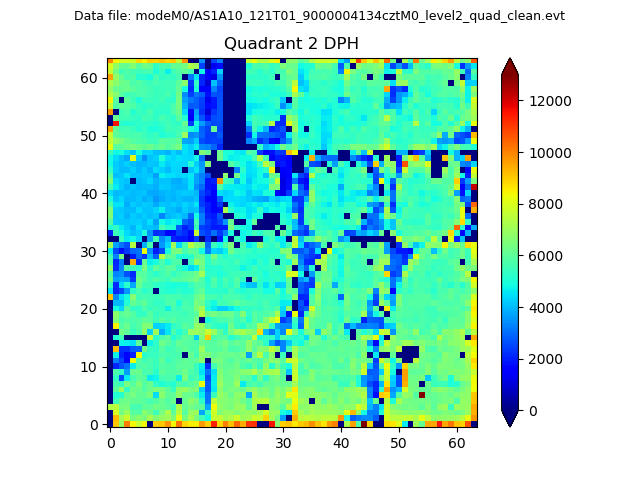
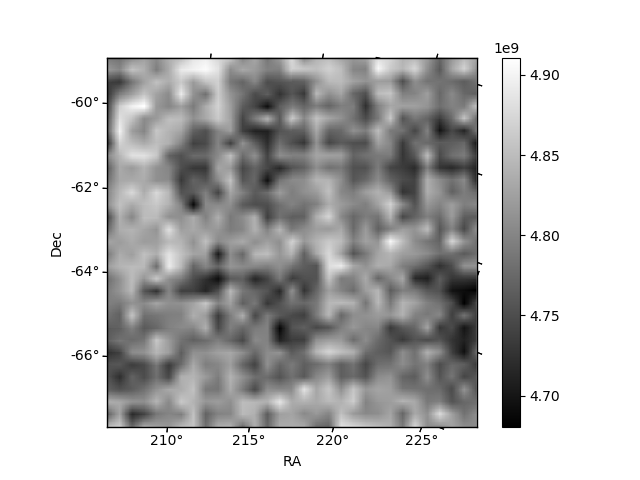
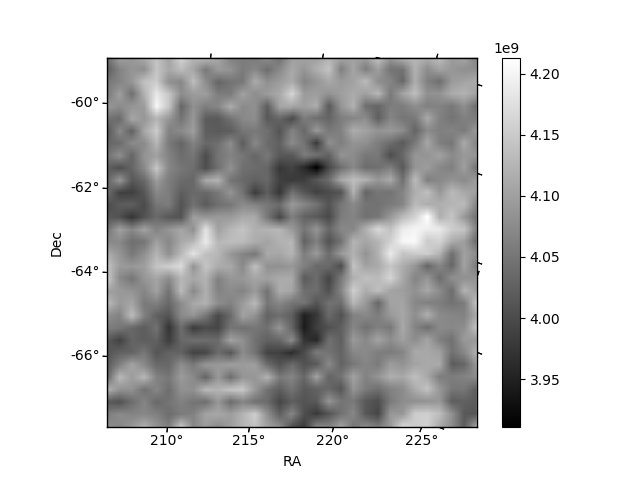
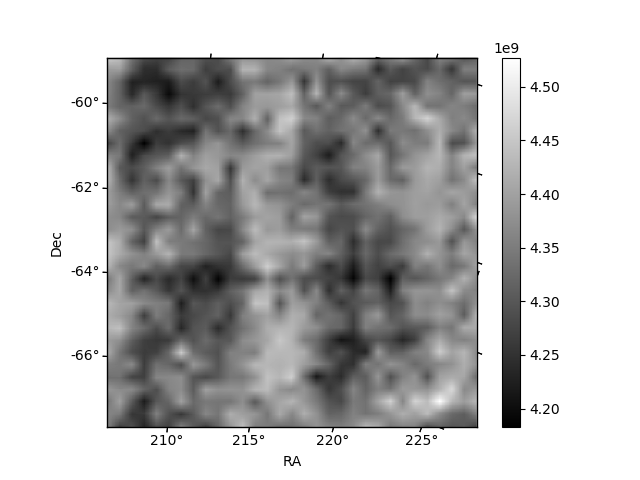
Histogram calculated using DETX and DETY for each event in the final _common_clean file
| Quadrant A | 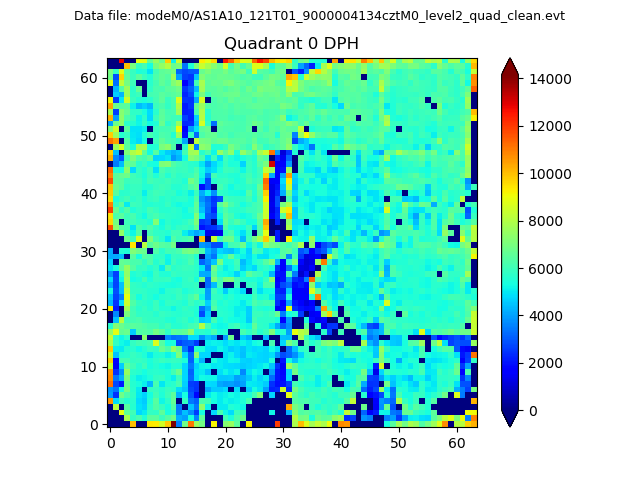 |
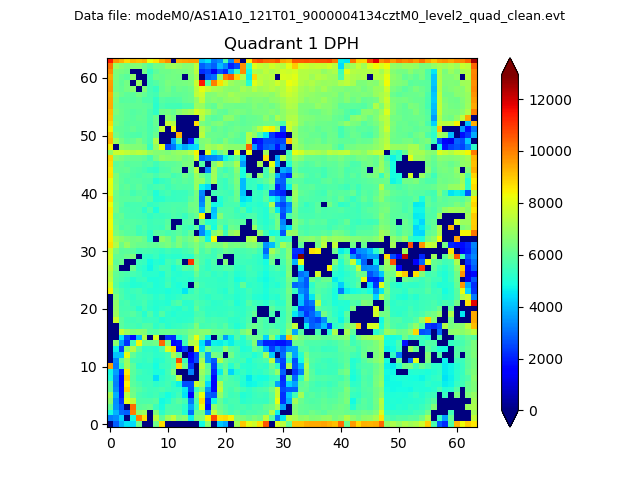 |
Quadrant B |
|---|---|---|---|
| Quadrant D | 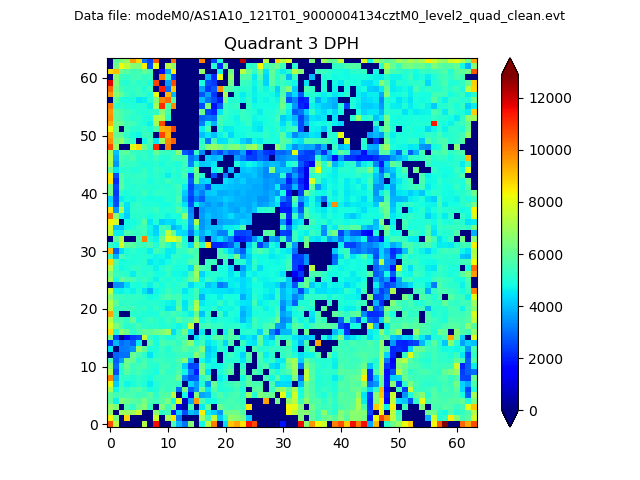 |
 |
Quadrant C |
| Plot type | Count rate plots | Images |
|---|---|---|
| Comparison with Poisson distribution Blue bars denote a histogram of data divided into 1 sec bins. Red curve is a Poisson curve with rate = median count rate of data. |
 |
 |
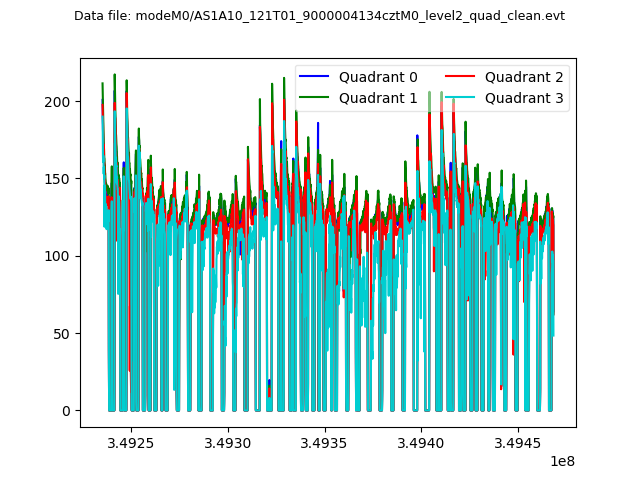
| Quadrant-wise count rates Data is divided into 100 sec bins |
 |
|
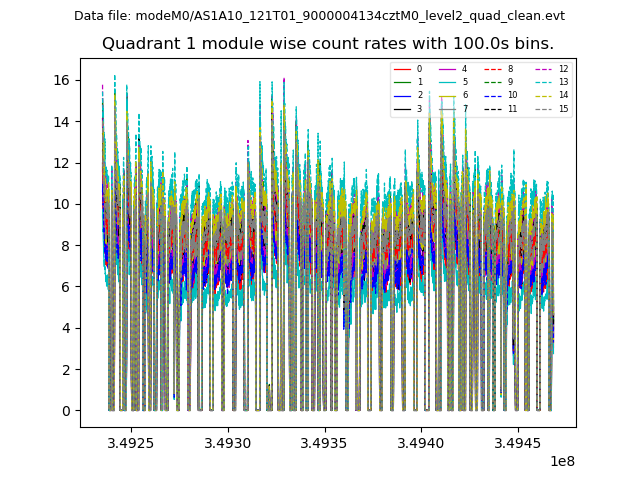
| Module-wise count rates for Quadrant A Data is divided into 100 sec bins |
 |
 |
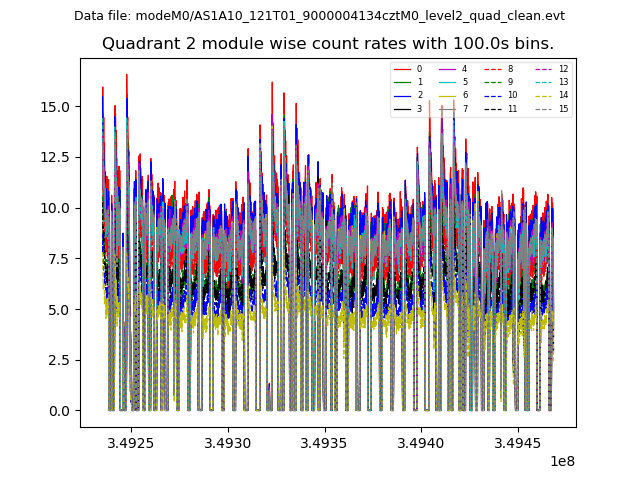
| Module-wise count rates for Quadrant B Data is divided into 100 sec bins |
 |
 |
| Module-wise count rates for Quadrant C Data is divided into 100 sec bins |
 |
 |
| Module-wise count rates for Quadrant D Data is divided into 100 sec bins |
 |
 |
| Parameter | Plot |
|---|---|
| CZT HV Monitor | 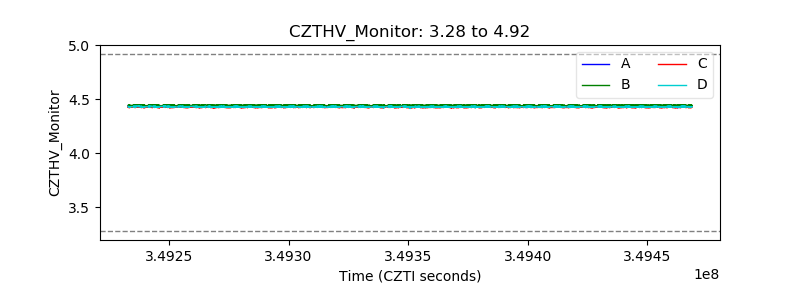 |
| D_VDD | 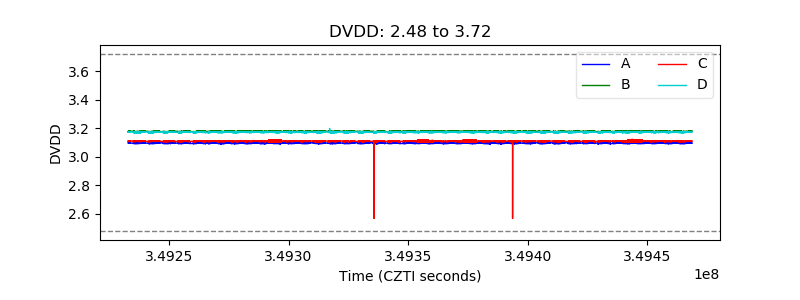 |
| Temperature 1 |  |
| Veto HV Monitor | 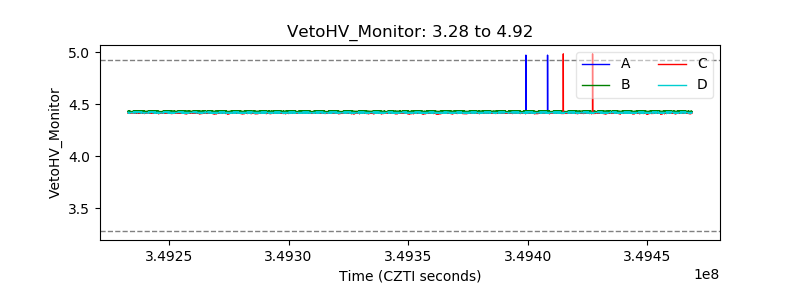 |
| Veto LLD | 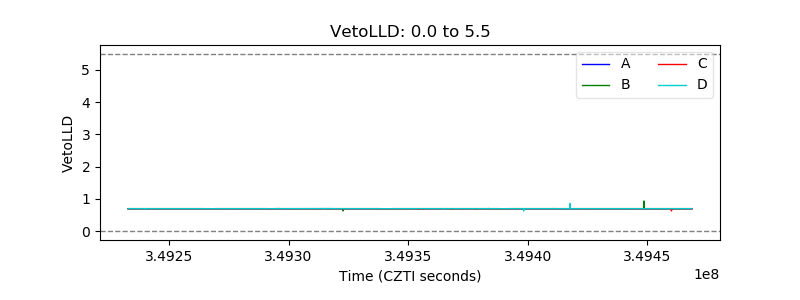 |
| Alpha Counter | 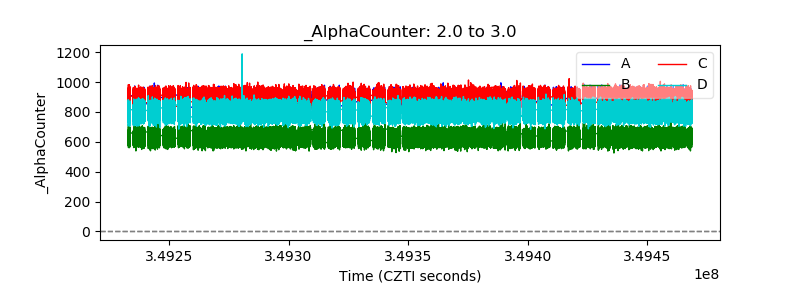 |
| _CPM_Rate | 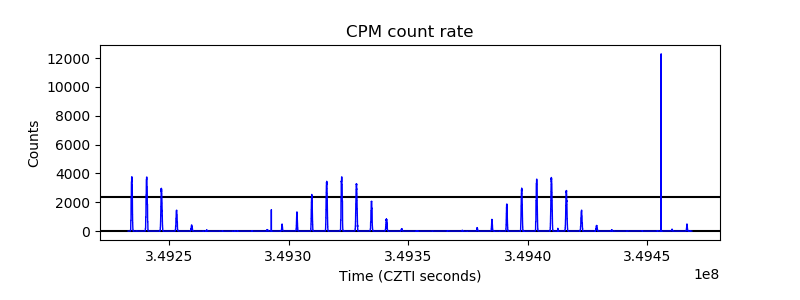 |
| CZT Counter | 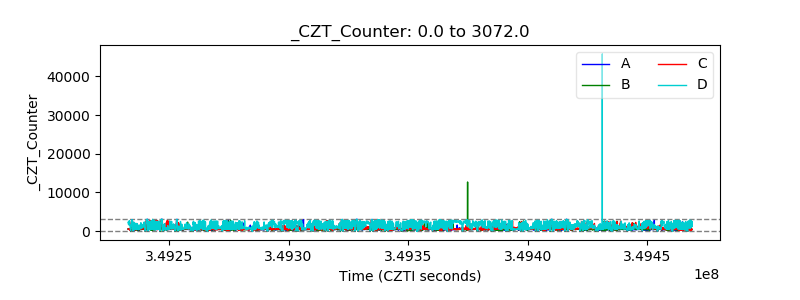 |
| +2.5 Volts monitor |  |
| +5 Volts monitor | 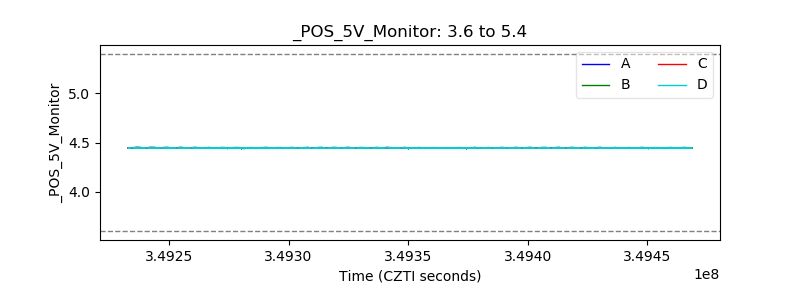 |
| _ROLL_ROT | 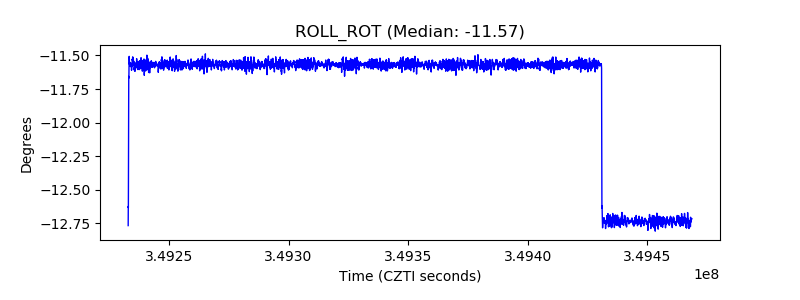 |
| _Roll_DEC | 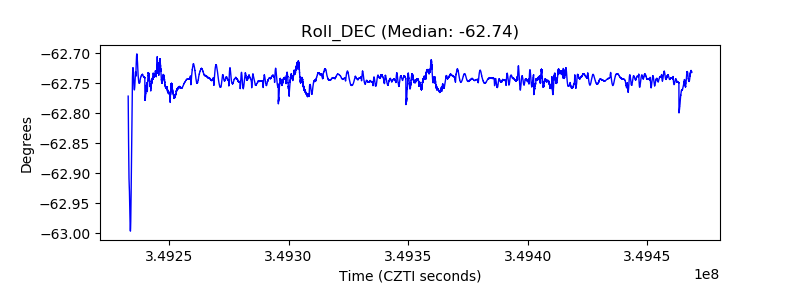 |
| _Roll_RA | 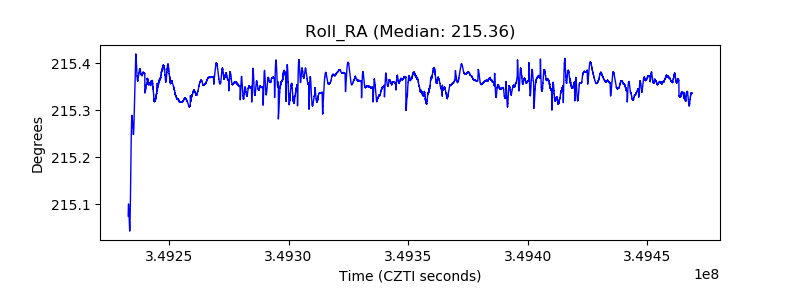 |
| Veto Counter | 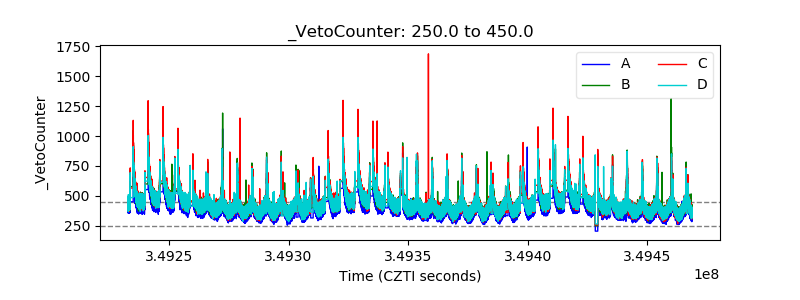 |