| Param | Original file | Final file |
|---|---|---|
| Filename | modeM0/AS1A10_121T01_9000004134_28803cztM0_level2.evt | modeM0/AS1A10_121T01_9000004134_28803cztM0_level2_quad_clean.evt |
| Size (bytes) | 238,276,800 | 39,749,760 |
| Size | 227.2 MB | 37.9 MB |
| Events in quadrant A | 1,315,499 | 257,824 |
| Events in quadrant B | 1,383,536 | 272,651 |
| Events in quadrant C | 1,453,307 | 258,187 |
| Events in quadrant D | 2,896,939 | 239,722 |
| Mode M9 | |||
|---|---|---|---|
| Quadrant | BADHDUFLAG | Total packets | Discarded packets |
| A | 0 | 12 | 0 |
| B | 0 | 12 | 0 |
| C | 0 | 12 | 0 |
| D | 0 | 12 | 0 |
| Mode M0 | |||
|---|---|---|---|
| Quadrant | BADHDUFLAG | Total packets | Discarded packets |
| A | 0 | 5389 | 1 |
| B | 0 | 5622 | 1 |
| C | 0 | 5923 | 1 |
| D | 0 | 10269 | 5 |
| Mode SS | |||
|---|---|---|---|
| Quadrant | BADHDUFLAG | Total packets | Discarded packets |
| A | 0 | 52 | 0 |
| B | 0 | 52 | 0 |
| C | 0 | 52 | 0 |
| D | 0 | 52 | 0 |
| Quadrant | Total seconds | Saturated seconds | Saturation percentage |
|---|---|---|---|
| A | 2428 | 20 | 0.823723% |
| B | 2428 | 34 | 1.400329% |
| C | 2428 | 72 | 2.965404% |
| D | 2427 | 460 | 18.953440% |
Noise dominated data is calculated using 1-second bins in cleaned event files. If a bin has >2000 counts, and if more than 50% of those come from <1% of pixels, then it is considered to be noise-dominated and hence unusable.
| Quadrant | # 1 sec bins | Bins with >0 counts | Bins with >2000 counts | High rate bins dominated by noise | Noise dominated (total time) | Noise dominated (detector-on time) | Marked lightcurve |
|---|---|---|---|---|---|---|---|
| A | 3663 | 2428 | 0 | 0 | 0.00% | 0.00% | 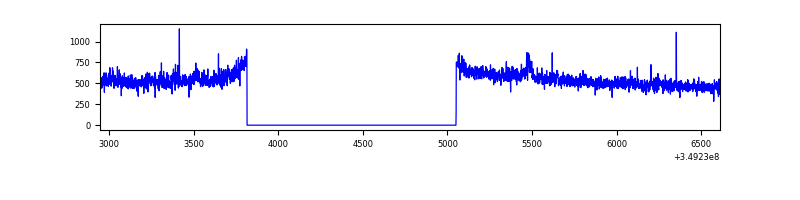 |
| B | 3663 | 2428 | 0 | 0 | 0.00% | 0.00% | 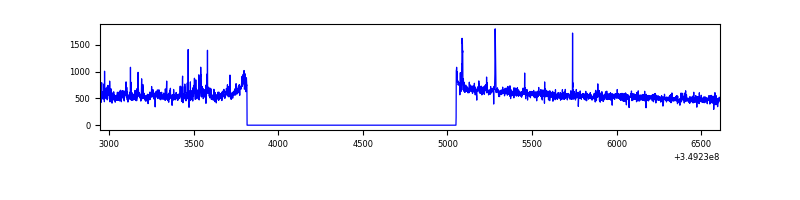 |
| C | 3663 | 2428 | 5 | 5 | 0.14% | 0.21% | 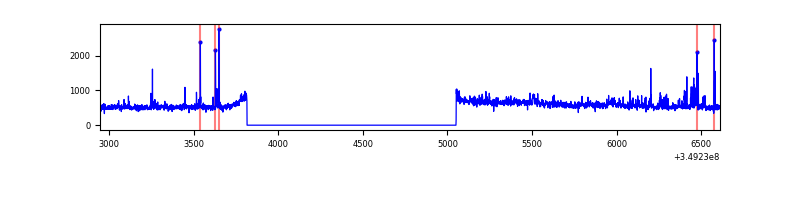 |
| D | 3662 | 2427 | 438 | 438 | 11.96% | 18.05% | 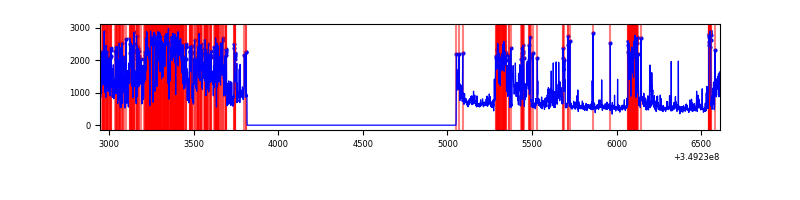 |
Top three noisy pixels from each quadrant. If the there are fewer than three noisy pixels in the level2.evt file, extra rows are filled as -1
| Pixel properties | Quadrant properties | ||||||
|---|---|---|---|---|---|---|---|
| Quadrant | DetID | PixID | Counts | Sigma | Mean | Median | Sigma |
| A | 5 | 98 | 15041 | 217.54 | 330 | 323 | 67.7 |
| A | 14 | 239 | 11168 | 160.29 | 330 | 323 | 67.7 |
| A | 14 | 235 | 11155 | 160.1 | 330 | 323 | 67.7 |
| B | 5 | 255 | 38489 | 609.0 | 334 | 327 | 62.7 |
| B | 0 | 229 | 14478 | 225.83 | 334 | 327 | 62.7 |
| B | 5 | 172 | 7187 | 109.47 | 334 | 327 | 62.7 |
| C | 4 | 254 | 76462 | 989.53 | 325 | 328 | 76.9 |
| C | 14 | 238 | 57859 | 747.74 | 325 | 328 | 76.9 |
| C | 3 | 233 | 40153 | 517.61 | 325 | 328 | 76.9 |
| D | 1 | 52 | 1069763 | 14800.53 | 299 | 291 | 72.3 |
| D | 8 | 195 | 223197 | 3084.82 | 299 | 291 | 72.3 |
| D | 12 | 233 | 219628 | 3035.43 | 299 | 291 | 72.3 |
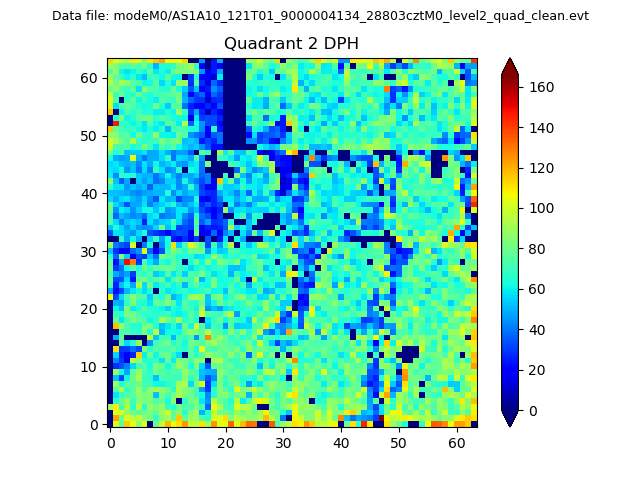
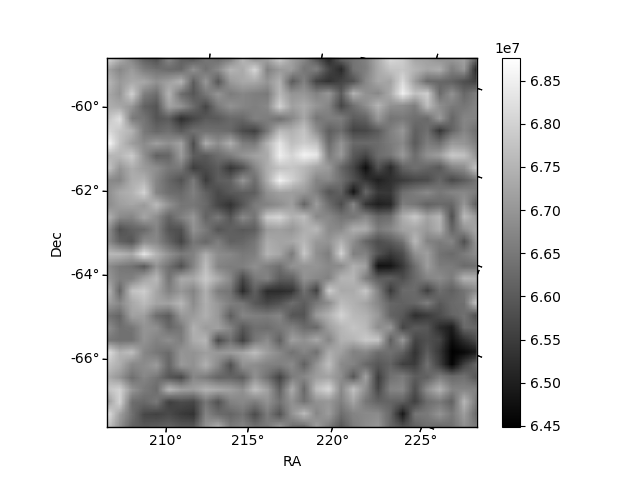
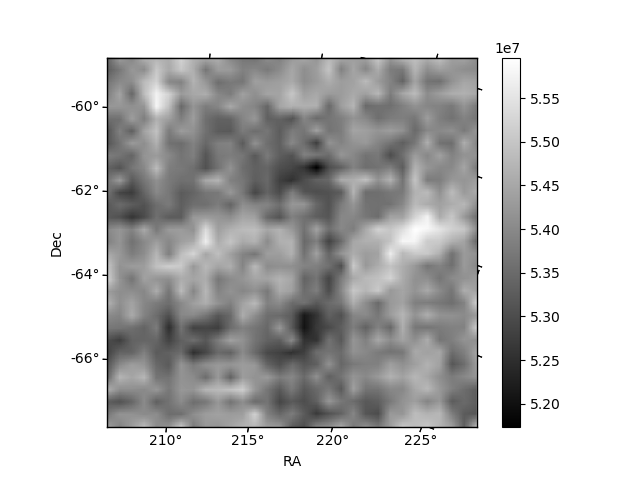
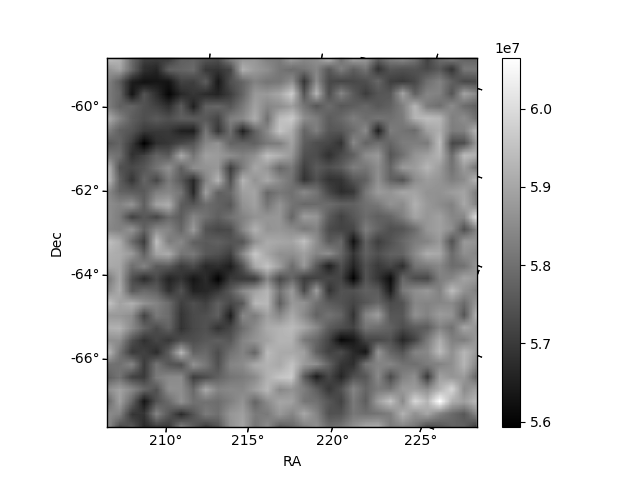
Histogram calculated using DETX and DETY for each event in the final _common_clean file
| Quadrant A | 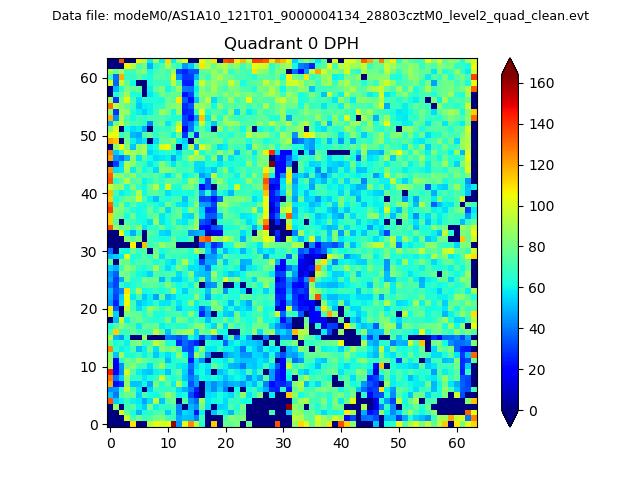 |
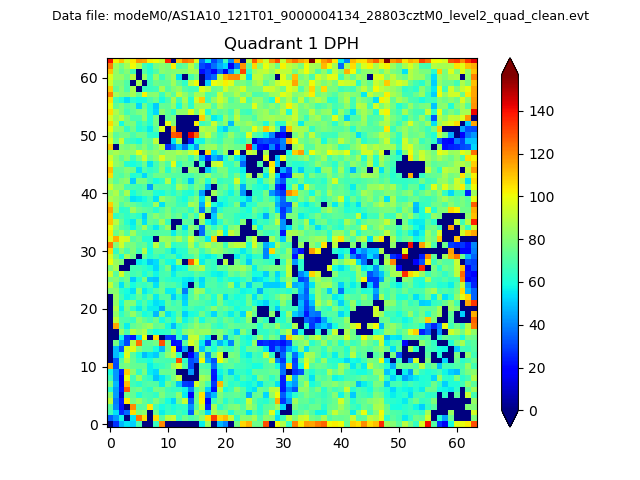 |
Quadrant B |
|---|---|---|---|
| Quadrant D | 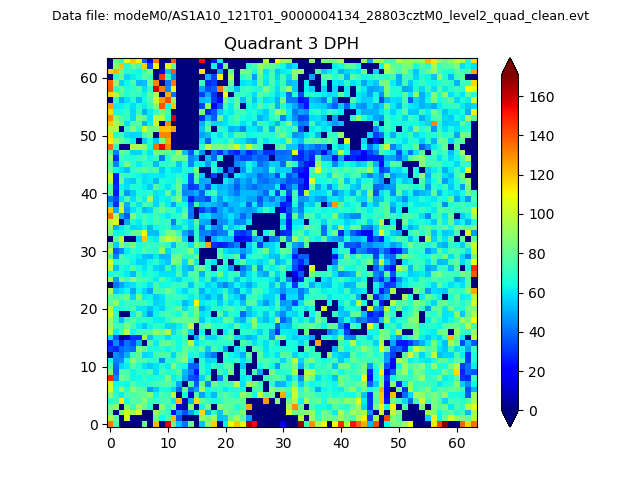 |
 |
Quadrant C |
| Plot type | Count rate plots | Images |
|---|---|---|
| Comparison with Poisson distribution Blue bars denote a histogram of data divided into 1 sec bins. Red curve is a Poisson curve with rate = median count rate of data. |
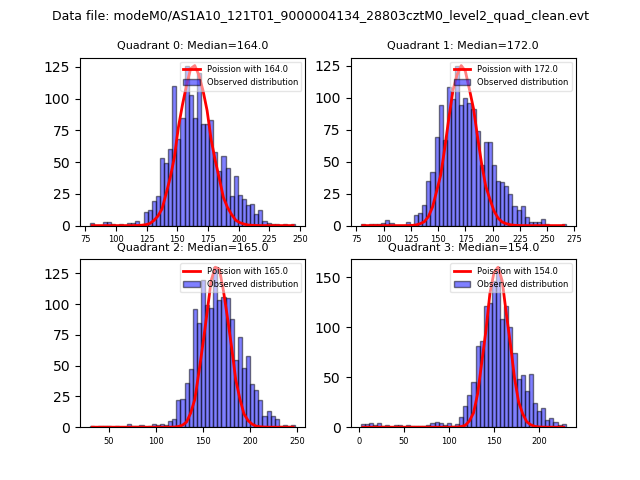 |
 |
| Quadrant-wise count rates Data is divided into 100 sec bins |
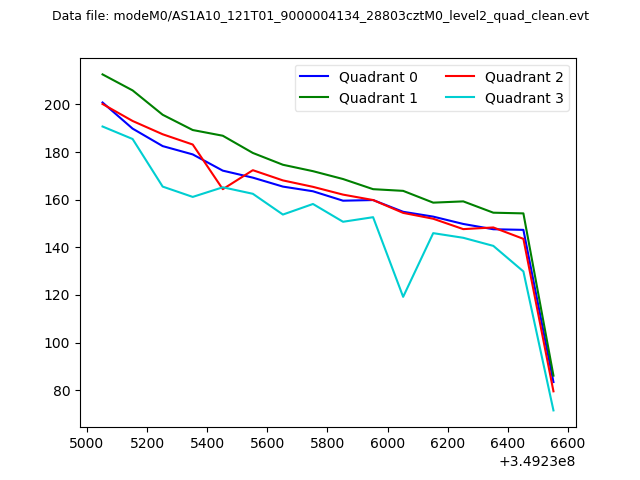 |
|
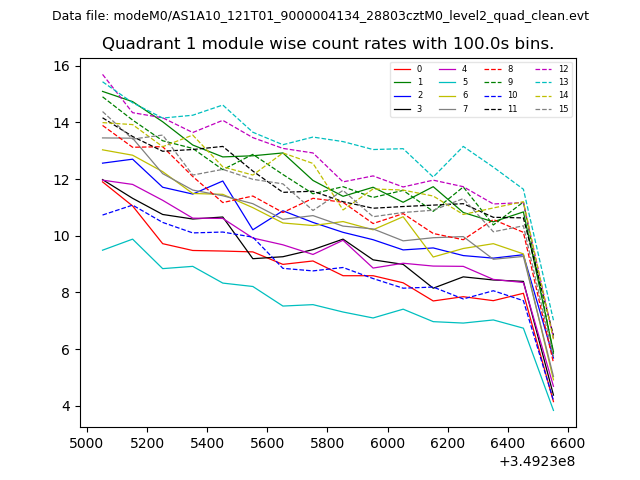
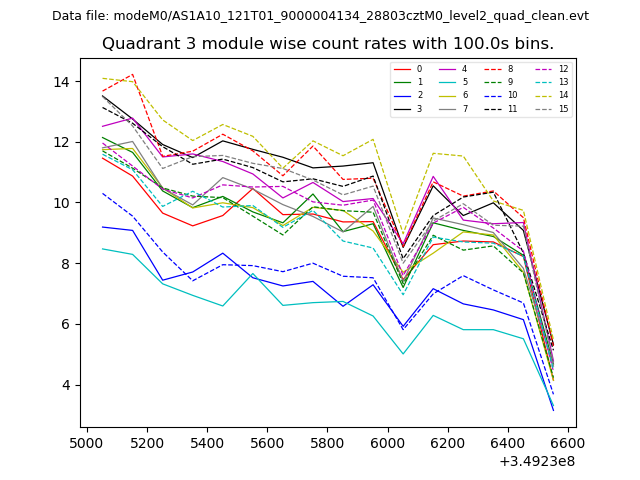
| Module-wise count rates for Quadrant A Data is divided into 100 sec bins |
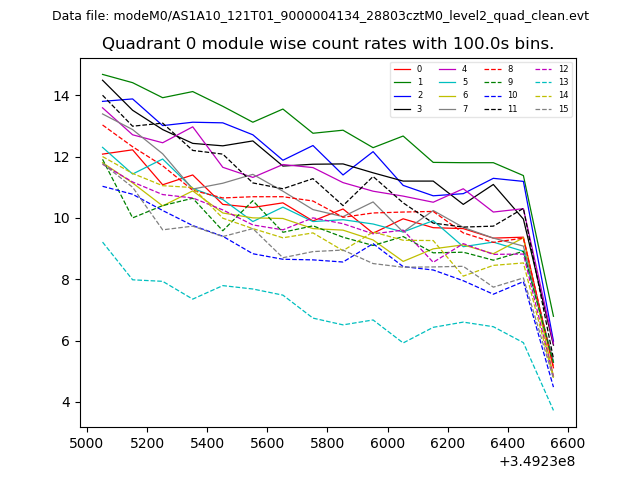 |
 |
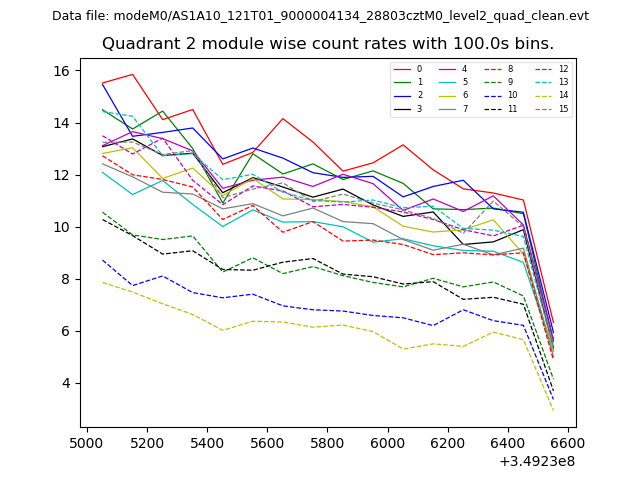
| Module-wise count rates for Quadrant B Data is divided into 100 sec bins |
 |
 |
| Module-wise count rates for Quadrant C Data is divided into 100 sec bins |
 |
 |
| Module-wise count rates for Quadrant D Data is divided into 100 sec bins |
 |
 |
| Parameter | Plot |
|---|---|
| CZT HV Monitor | 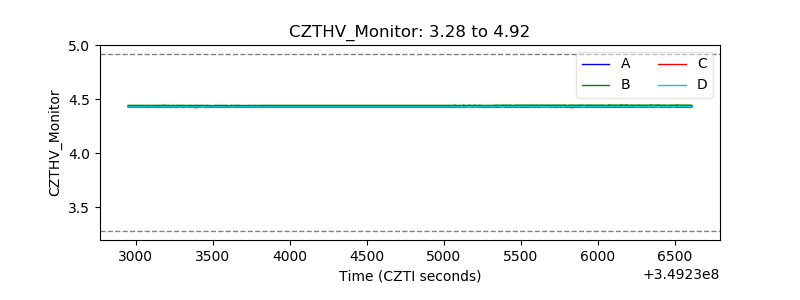 |
| D_VDD | 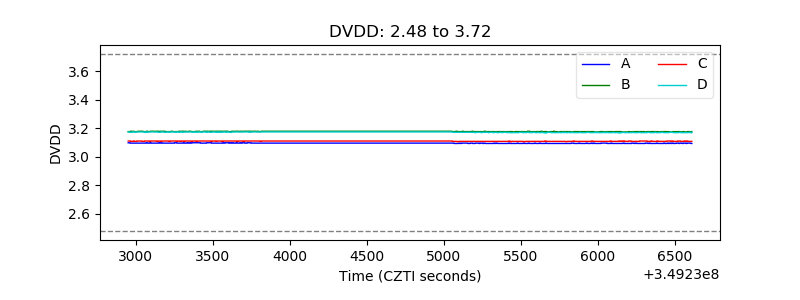 |
| Temperature 1 | 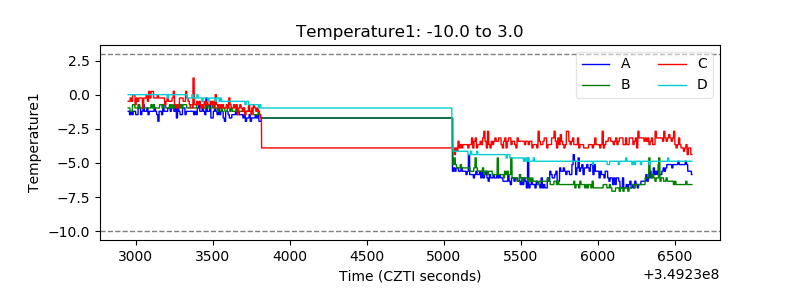 |
| Veto HV Monitor | 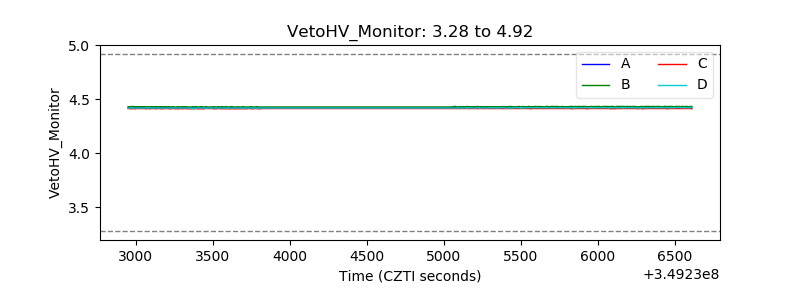 |
| Veto LLD | 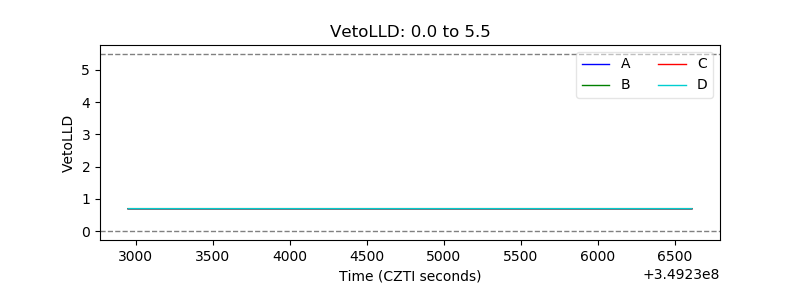 |
| Alpha Counter | 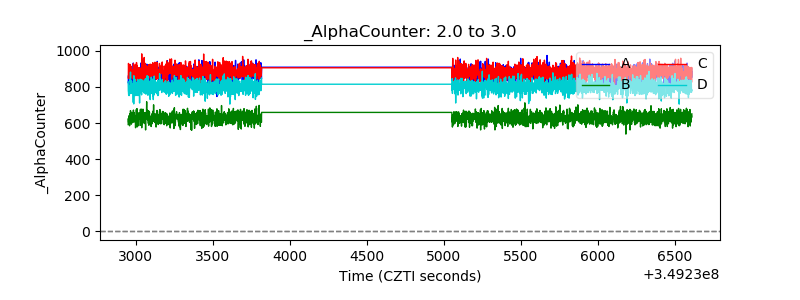 |
| _CPM_Rate | 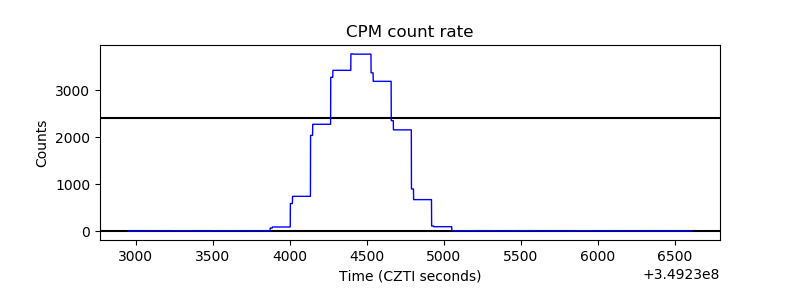 |
| CZT Counter | 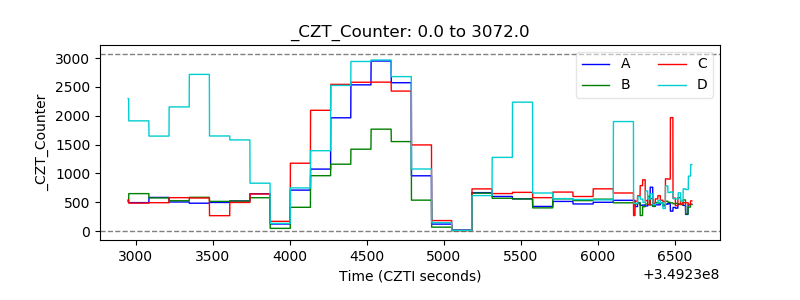 |
| +2.5 Volts monitor |  |
| +5 Volts monitor |  |
| _ROLL_ROT | 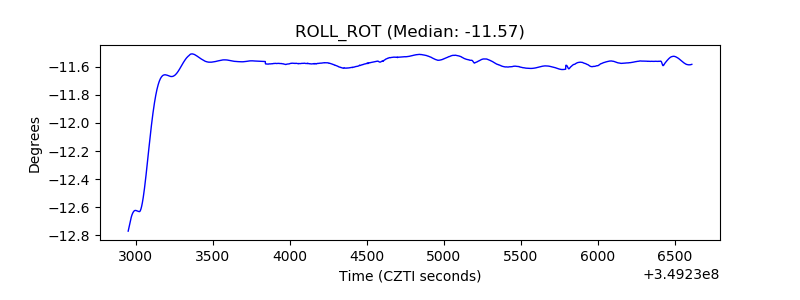 |
| _Roll_DEC | 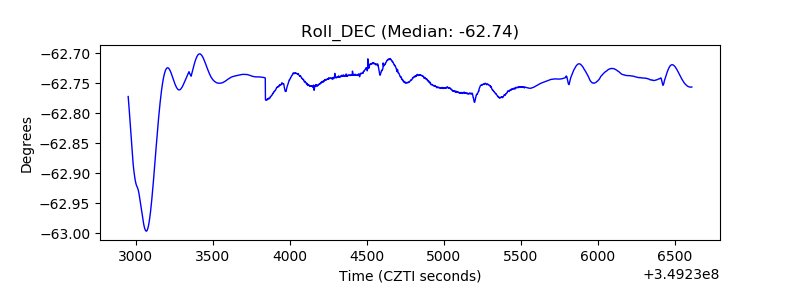 |
| _Roll_RA |  |
| Veto Counter | 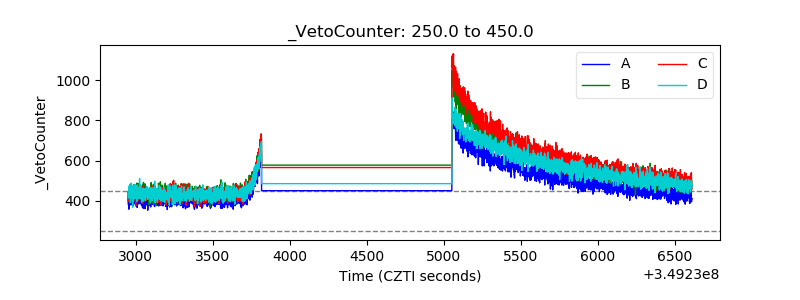 |