| Param | Original file | Final file |
|---|---|---|
| Filename | modeM0/AS1A10_121T01_9000004134_28804cztM0_level2.evt | modeM0/AS1A10_121T01_9000004134_28804cztM0_level2_quad_clean.evt |
| Size (bytes) | 601,594,560 | 112,334,400 |
| Size | 573.7 MB | 107.1 MB |
| Events in quadrant A | 3,282,811 | 753,106 |
| Events in quadrant B | 3,605,625 | 790,465 |
| Events in quadrant C | 4,485,159 | 727,857 |
| Events in quadrant D | 6,429,452 | 700,955 |
| Mode M9 | |||
|---|---|---|---|
| Quadrant | BADHDUFLAG | Total packets | Discarded packets |
| A | 0 | 14 | 0 |
| B | 0 | 14 | 0 |
| C | 0 | 14 | 0 |
| D | 0 | 14 | 0 |
| Mode M0 | |||
|---|---|---|---|
| Quadrant | BADHDUFLAG | Total packets | Discarded packets |
| A | 0 | 13532 | 1 |
| B | 0 | 14561 | 1 |
| C | 0 | 17498 | 1 |
| D | 0 | 23369 | 1 |
| Mode SS | |||
|---|---|---|---|
| Quadrant | BADHDUFLAG | Total packets | Discarded packets |
| A | 0 | 124 | 0 |
| B | 0 | 124 | 0 |
| C | 0 | 124 | 0 |
| D | 0 | 124 | 0 |
| Quadrant | Total seconds | Saturated seconds | Saturation percentage |
|---|---|---|---|
| A | 6158 | 29 | 0.470932% |
| B | 6159 | 161 | 2.614061% |
| C | 6159 | 494 | 8.020783% |
| D | 6159 | 543 | 8.816366% |
Noise dominated data is calculated using 1-second bins in cleaned event files. If a bin has >2000 counts, and if more than 50% of those come from <1% of pixels, then it is considered to be noise-dominated and hence unusable.
| Quadrant | # 1 sec bins | Bins with >0 counts | Bins with >2000 counts | High rate bins dominated by noise | Noise dominated (total time) | Noise dominated (detector-on time) | Marked lightcurve |
|---|---|---|---|---|---|---|---|
| A | 7484 | 6160 | 2 | 2 | 0.03% | 0.03% | 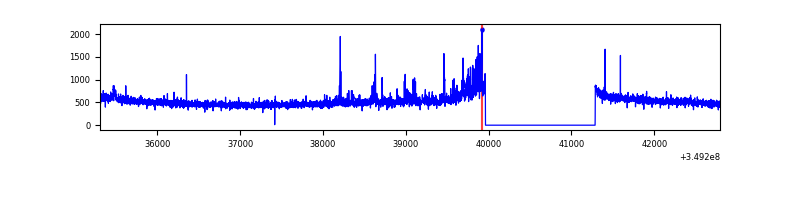 |
| B | 7485 | 6161 | 95 | 95 | 1.27% | 1.54% | 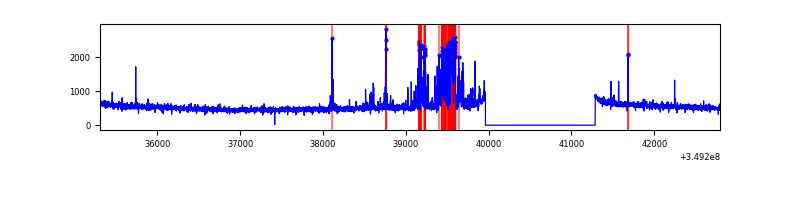 |
| C | 7485 | 6160 | 179 | 179 | 2.39% | 2.91% | 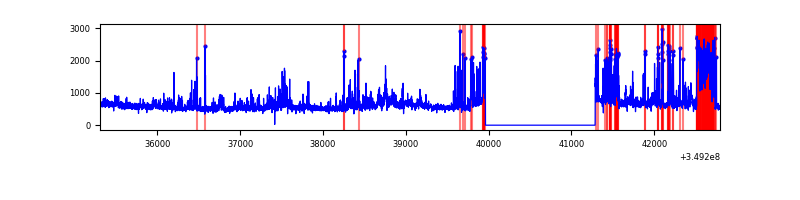 |
| D | 7485 | 6161 | 468 | 468 | 6.25% | 7.60% | 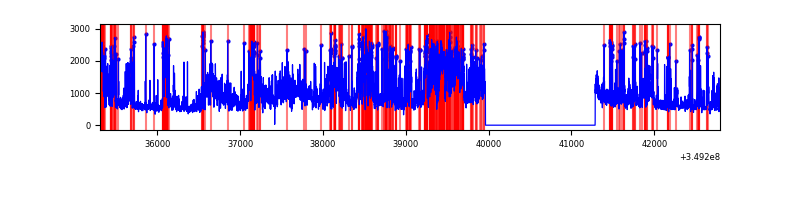 |
Top three noisy pixels from each quadrant. If the there are fewer than three noisy pixels in the level2.evt file, extra rows are filled as -1
| Pixel properties | Quadrant properties | ||||||
|---|---|---|---|---|---|---|---|
| Quadrant | DetID | PixID | Counts | Sigma | Mean | Median | Sigma |
| A | 14 | 235 | 148181 | 930.7 | 797 | 782 | 158.4 |
| A | 1 | 113 | 23068 | 140.72 | 797 | 782 | 158.4 |
| A | 13 | 254 | 11981 | 70.71 | 797 | 782 | 158.4 |
| B | 5 | 172 | 319992 | 2194.0 | 802 | 784 | 145.5 |
| B | 5 | 255 | 45267 | 305.74 | 802 | 784 | 145.5 |
| B | 15 | 35 | 30679 | 205.48 | 802 | 784 | 145.5 |
| C | 4 | 254 | 913305 | 5063.85 | 778 | 786 | 180.2 |
| C | 3 | 233 | 298663 | 1653.01 | 778 | 786 | 180.2 |
| C | 14 | 238 | 167531 | 925.32 | 778 | 786 | 180.2 |
| D | 1 | 52 | 2092433 | 11447.79 | 773 | 753 | 182.7 |
| D | 13 | 104 | 592435 | 3238.28 | 773 | 753 | 182.7 |
| D | 8 | 195 | 568645 | 3108.08 | 773 | 753 | 182.7 |
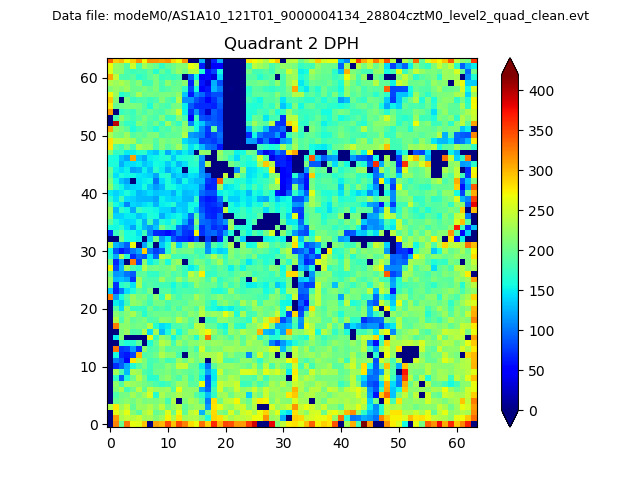
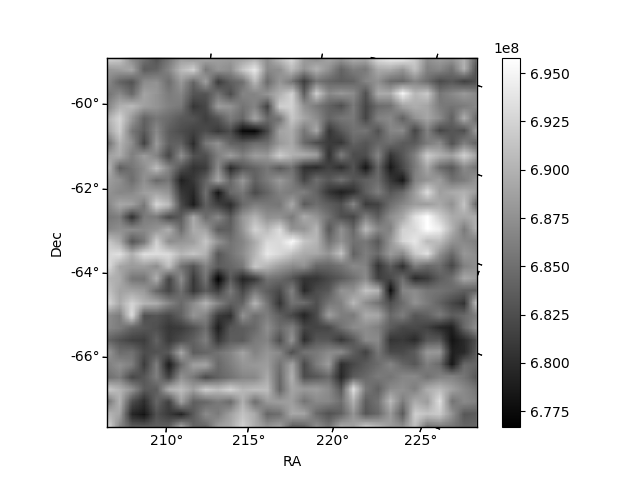
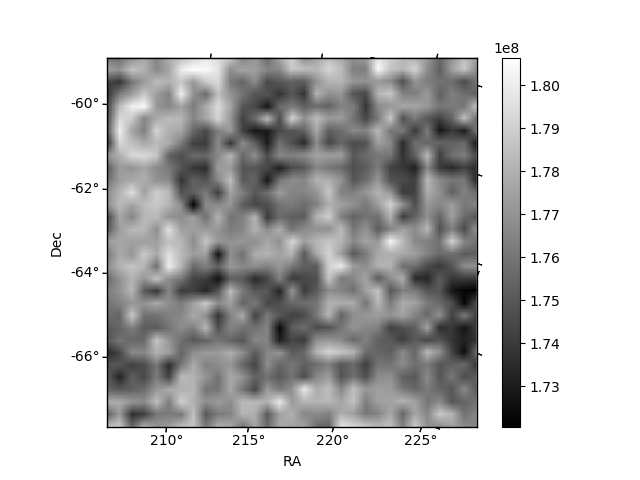
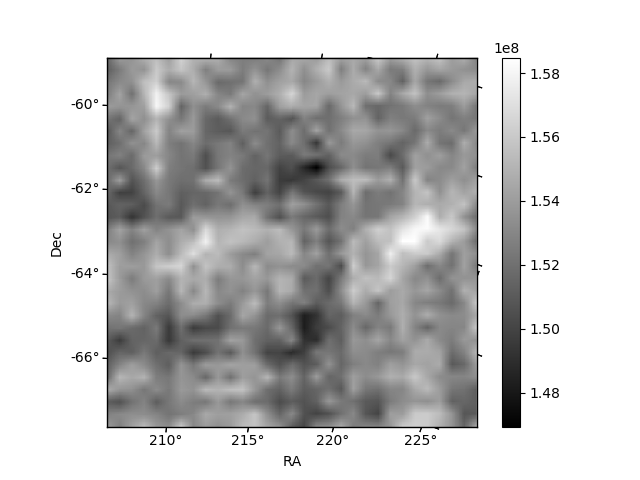
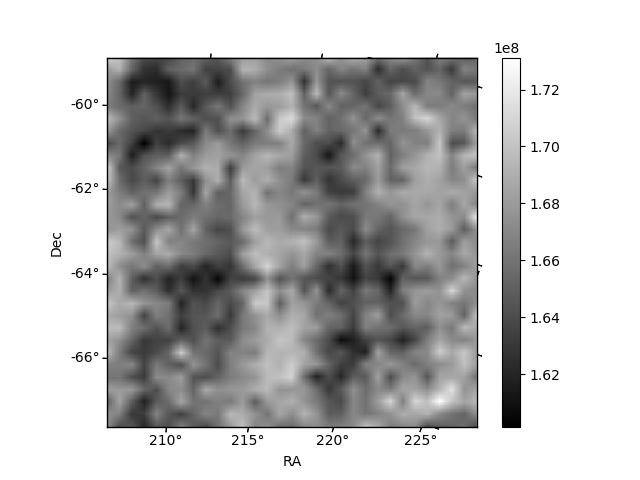
Histogram calculated using DETX and DETY for each event in the final _common_clean file
| Quadrant A | 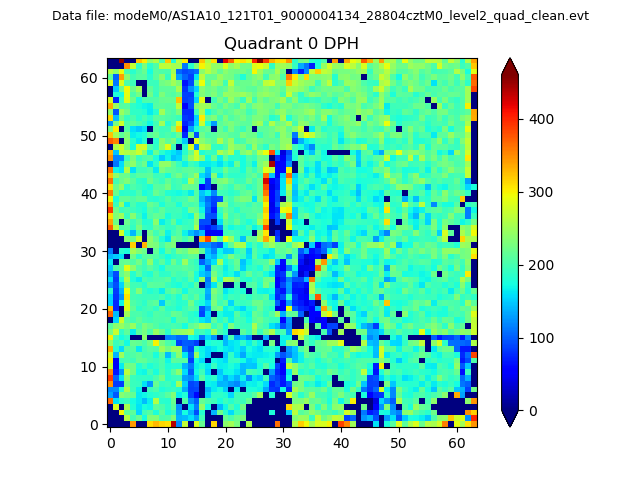 |
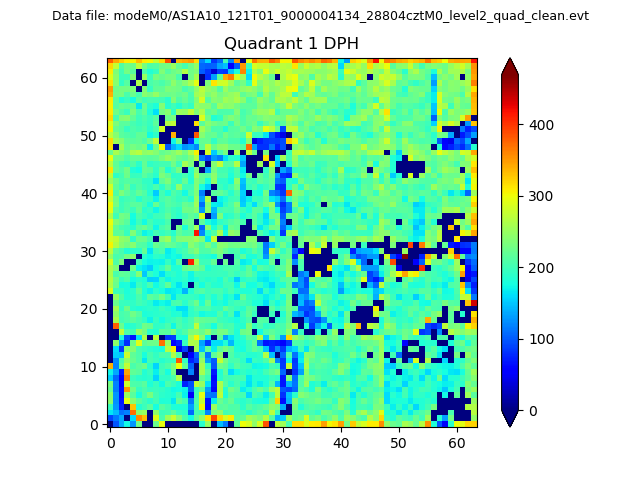 |
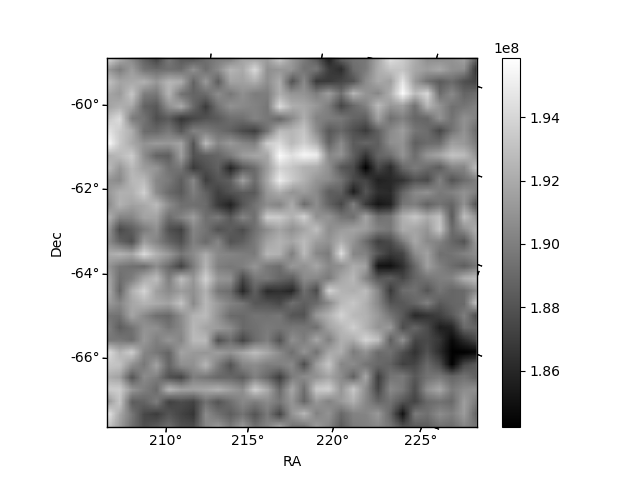
Quadrant B |
|---|---|---|---|
| Quadrant D | 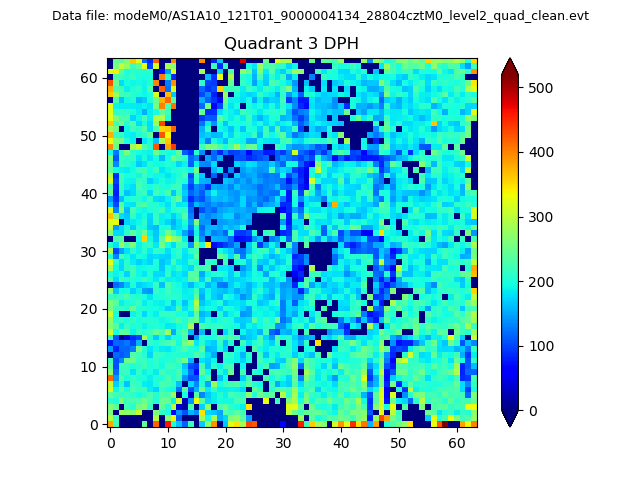 |
 |
Quadrant C |
| Plot type | Count rate plots | Images |
|---|---|---|
| Comparison with Poisson distribution Blue bars denote a histogram of data divided into 1 sec bins. Red curve is a Poisson curve with rate = median count rate of data. |
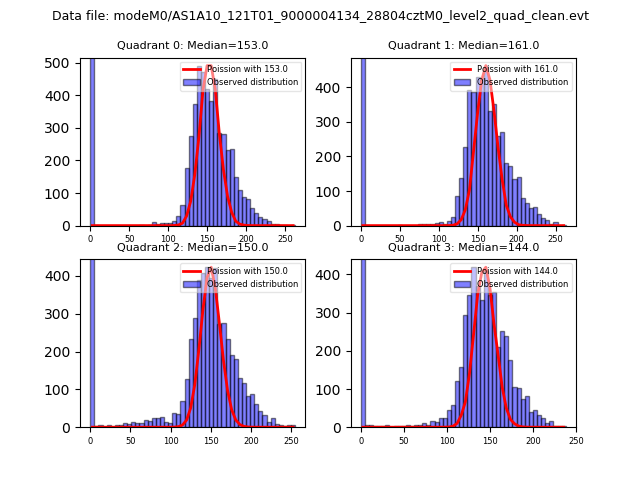 |
 |
| Quadrant-wise count rates Data is divided into 100 sec bins |
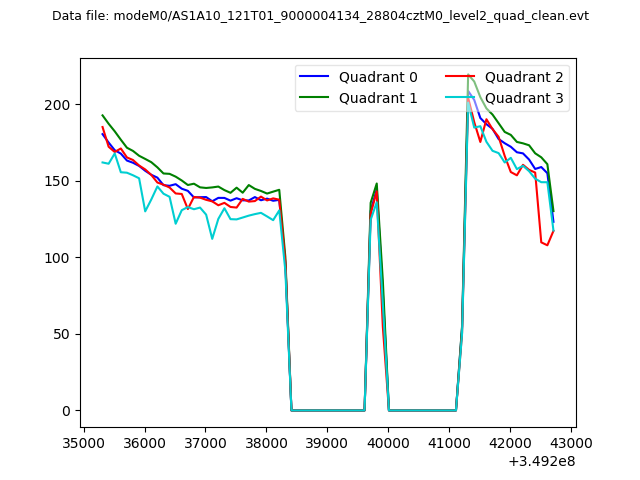 |
|
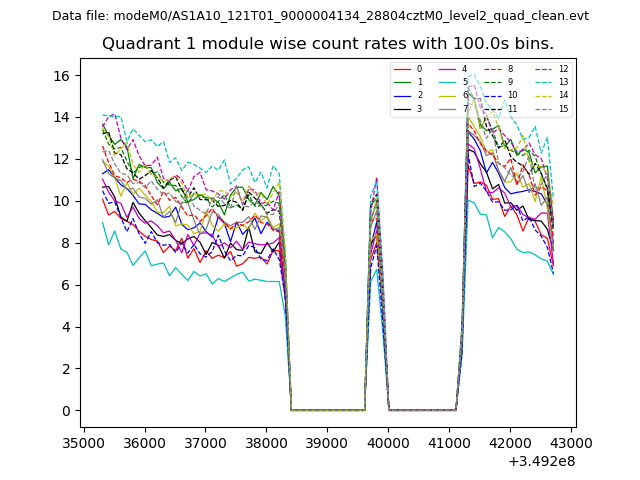
| Module-wise count rates for Quadrant A Data is divided into 100 sec bins |
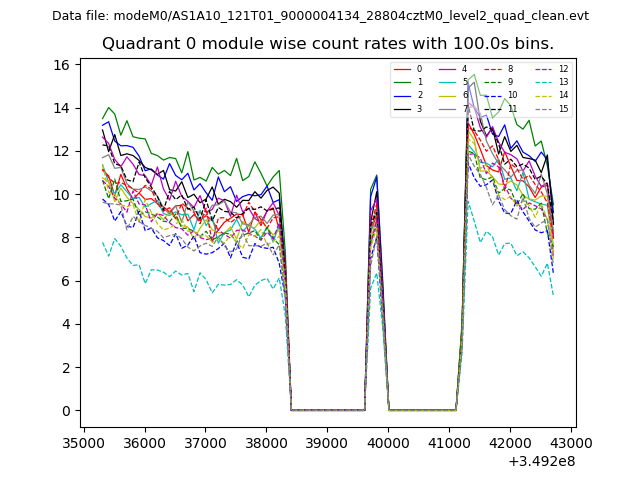 |
 |
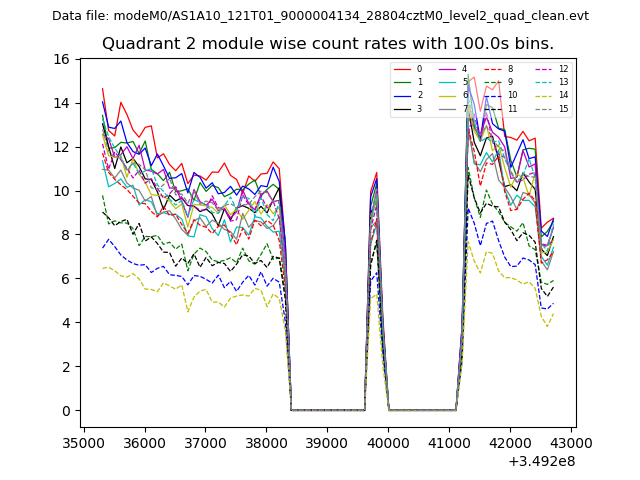
| Module-wise count rates for Quadrant B Data is divided into 100 sec bins |
 |
 |
| Module-wise count rates for Quadrant C Data is divided into 100 sec bins |
 |
 |
| Module-wise count rates for Quadrant D Data is divided into 100 sec bins |
 |
 |
| Parameter | Plot |
|---|---|
| CZT HV Monitor | 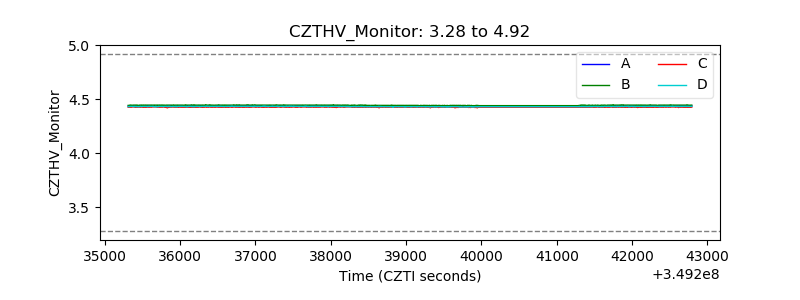 |
| D_VDD | 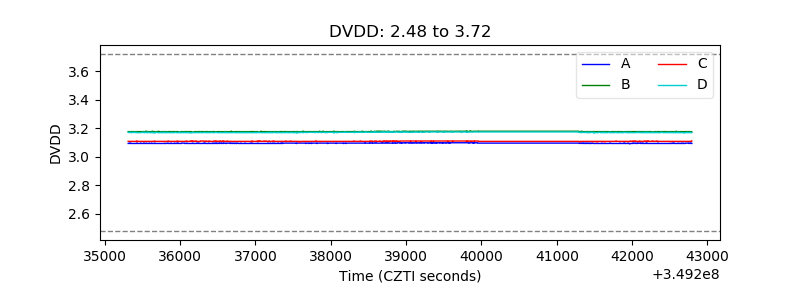 |
| Temperature 1 | 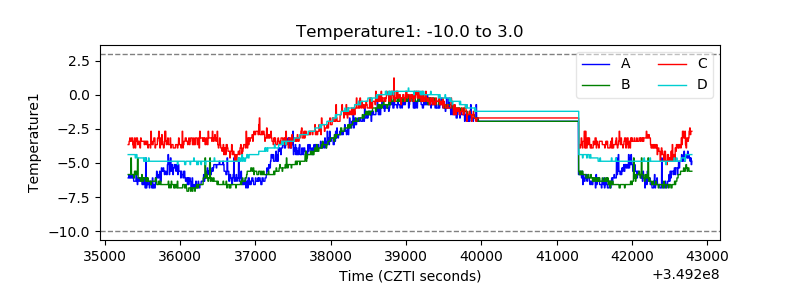 |
| Veto HV Monitor | 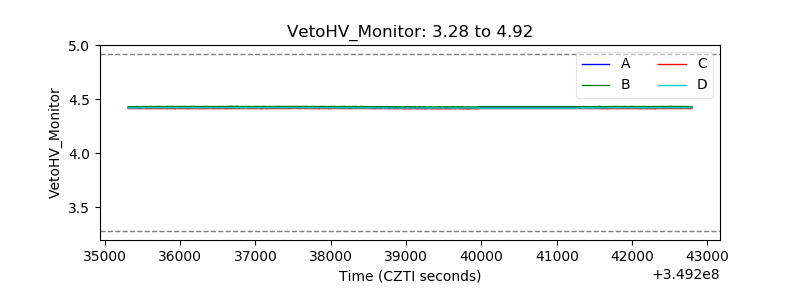 |
| Veto LLD | 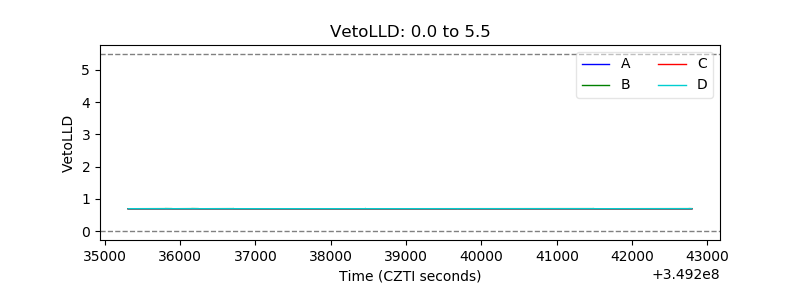 |
| Alpha Counter | 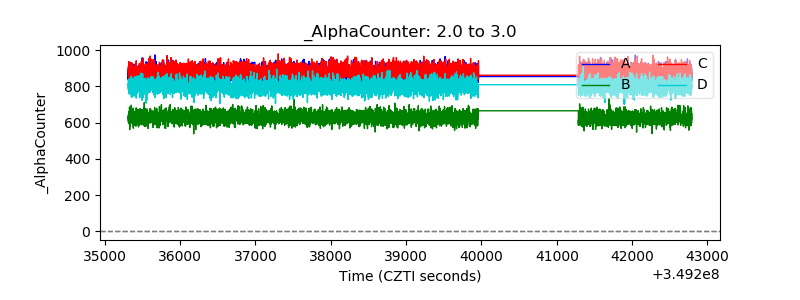 |
| _CPM_Rate | 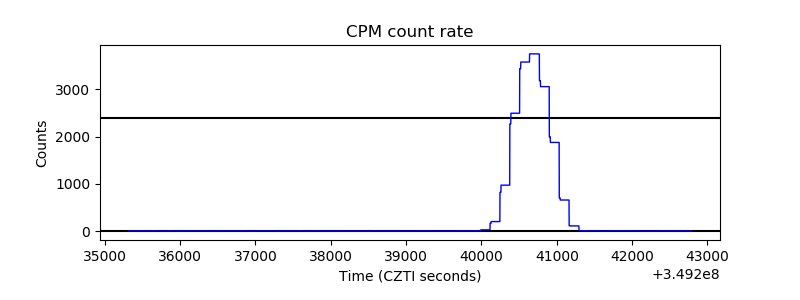 |
| CZT Counter | 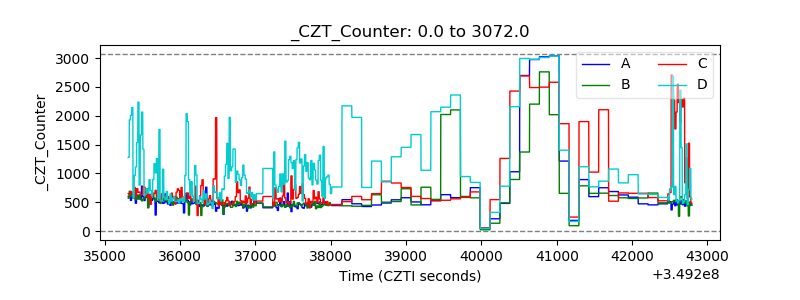 |
| +2.5 Volts monitor |  |
| +5 Volts monitor | 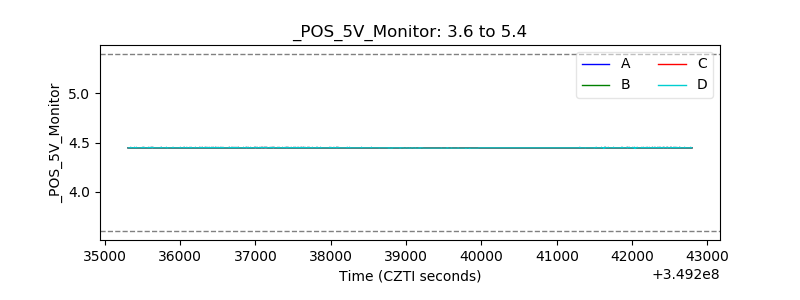 |
| _ROLL_ROT |  |
| _Roll_DEC | 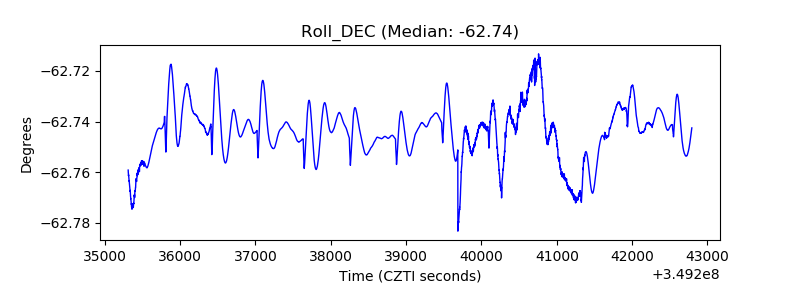 |
| _Roll_RA | 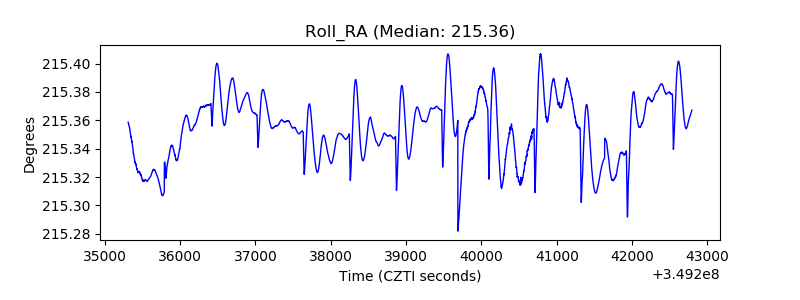 |
| Veto Counter |  |