| Param | Original file | Final file |
|---|---|---|
| Filename | modeM0/AS1A10_121T01_9000004134_28805cztM0_level2.evt | modeM0/AS1A10_121T01_9000004134_28805cztM0_level2_quad_clean.evt |
| Size (bytes) | 614,033,280 | 103,440,960 |
| Size | 585.6 MB | 98.6 MB |
| Events in quadrant A | 2,988,404 | 707,661 |
| Events in quadrant B | 3,572,747 | 730,996 |
| Events in quadrant C | 6,303,350 | 632,619 |
| Events in quadrant D | 5,340,632 | 657,411 |
| Mode M9 | |||
|---|---|---|---|
| Quadrant | BADHDUFLAG | Total packets | Discarded packets |
| A | 0 | 13 | 0 |
| B | 0 | 13 | 0 |
| C | 0 | 13 | 0 |
| D | 0 | 13 | 0 |
| Mode M0 | |||
|---|---|---|---|
| Quadrant | BADHDUFLAG | Total packets | Discarded packets |
| A | 0 | 12232 | 1 |
| B | 0 | 14117 | 1 |
| C | 0 | 22788 | 1 |
| D | 0 | 19893 | 1 |
| Mode SS | |||
|---|---|---|---|
| Quadrant | BADHDUFLAG | Total packets | Discarded packets |
| A | 0 | 118 | 0 |
| B | 0 | 118 | 0 |
| C | 0 | 118 | 0 |
| D | 0 | 118 | 0 |
| Quadrant | Total seconds | Saturated seconds | Saturation percentage |
|---|---|---|---|
| A | 5771 | 27 | 0.467857% |
| B | 5772 | 220 | 3.811504% |
| C | 5772 | 1601 | 27.737353% |
| D | 5772 | 527 | 9.130284% |
Noise dominated data is calculated using 1-second bins in cleaned event files. If a bin has >2000 counts, and if more than 50% of those come from <1% of pixels, then it is considered to be noise-dominated and hence unusable.
| Quadrant | # 1 sec bins | Bins with >0 counts | Bins with >2000 counts | High rate bins dominated by noise | Noise dominated (total time) | Noise dominated (detector-on time) | Marked lightcurve |
|---|---|---|---|---|---|---|---|
| A | 7121 | 5771 | 1 | 1 | 0.01% | 0.02% | 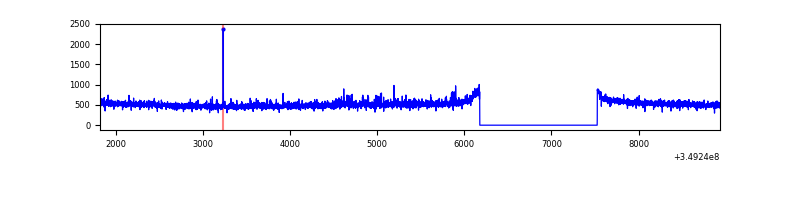 |
| B | 7122 | 5772 | 89 | 89 | 1.25% | 1.54% | 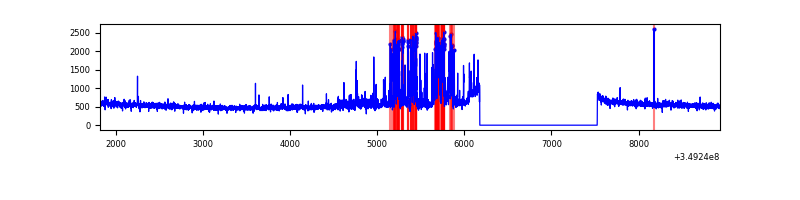 |
| C | 7122 | 5772 | 946 | 946 | 13.28% | 16.39% | 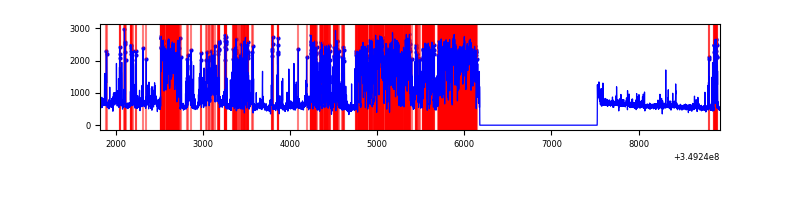 |
| D | 7122 | 5772 | 471 | 471 | 6.61% | 8.16% | 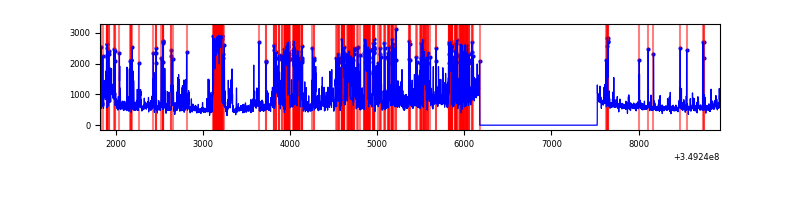 |
Top three noisy pixels from each quadrant. If the there are fewer than three noisy pixels in the level2.evt file, extra rows are filled as -1
| Pixel properties | Quadrant properties | ||||||
|---|---|---|---|---|---|---|---|
| Quadrant | DetID | PixID | Counts | Sigma | Mean | Median | Sigma |
| A | 1 | 113 | 18189 | 114.67 | 761 | 748 | 152.1 |
| A | 14 | 235 | 17127 | 107.68 | 761 | 748 | 152.1 |
| A | 15 | 174 | 11377 | 69.88 | 761 | 748 | 152.1 |
| B | 5 | 172 | 428937 | 3110.54 | 759 | 742 | 137.7 |
| B | 0 | 229 | 37776 | 269.03 | 759 | 742 | 137.7 |
| B | 0 | 245 | 34191 | 242.98 | 759 | 742 | 137.7 |
| C | 4 | 254 | 3330985 | 21833.87 | 662 | 668 | 152.5 |
| C | 3 | 233 | 199000 | 1300.28 | 662 | 668 | 152.5 |
| C | 14 | 238 | 130702 | 852.52 | 662 | 668 | 152.5 |
| D | 1 | 52 | 1698722 | 9756.2 | 736 | 718 | 174.0 |
| D | 8 | 195 | 400996 | 2299.87 | 736 | 718 | 174.0 |
| D | 12 | 233 | 226403 | 1296.72 | 736 | 718 | 174.0 |
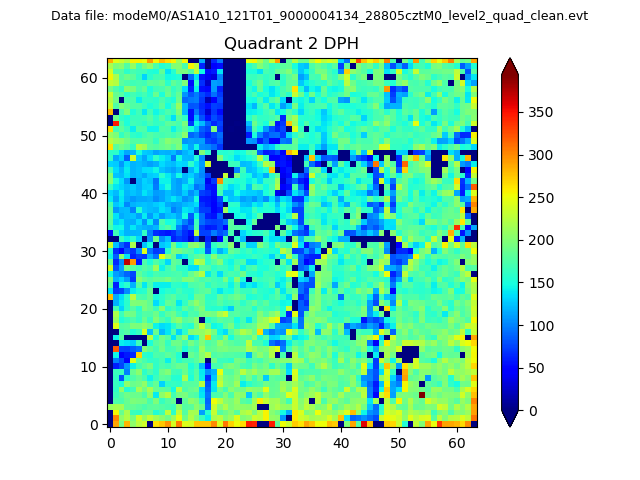
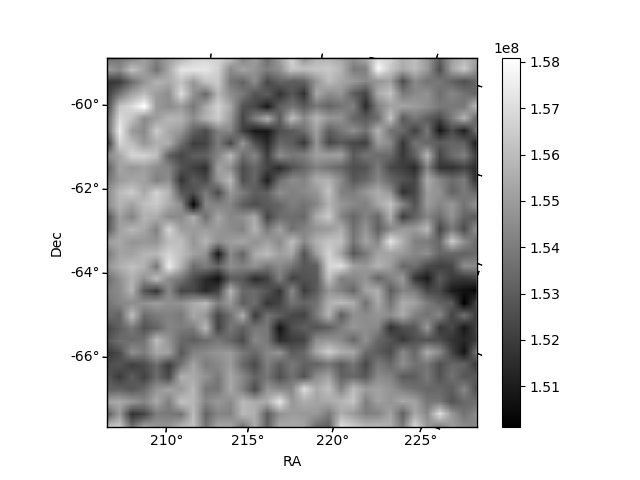
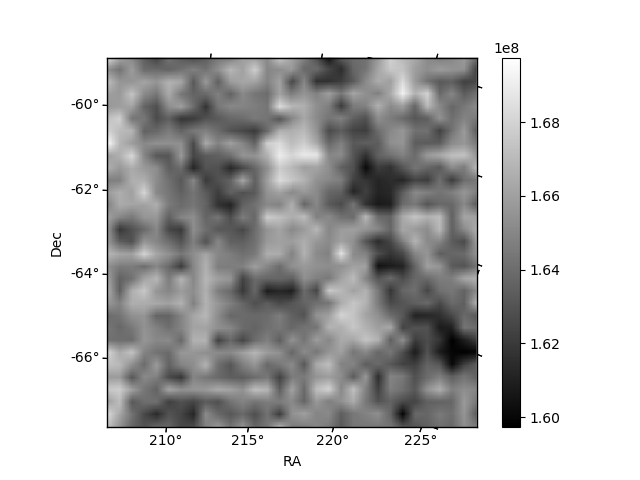
Histogram calculated using DETX and DETY for each event in the final _common_clean file
| Quadrant A | 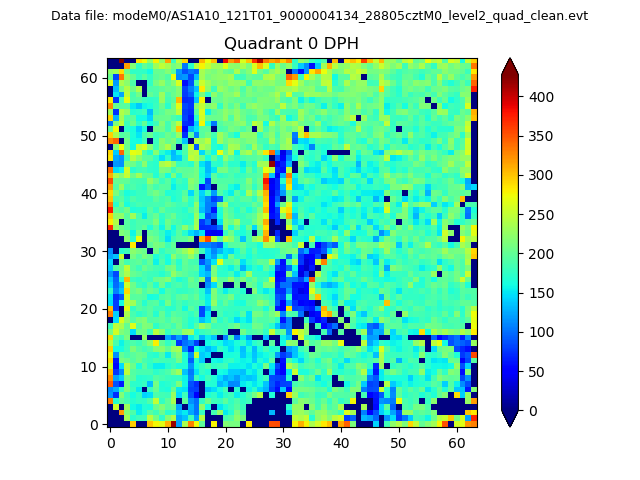 |
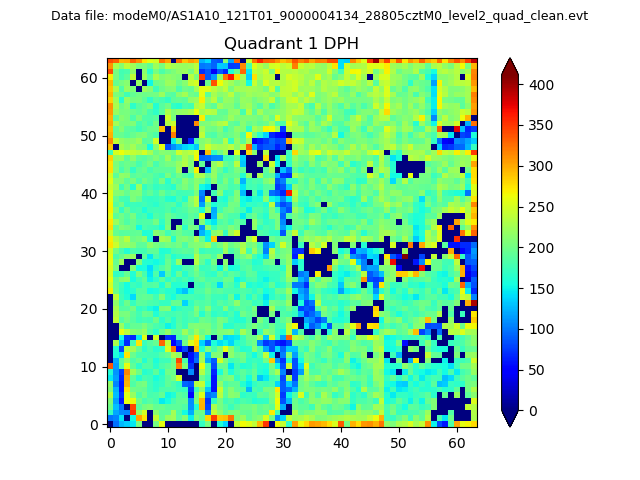 |
Quadrant B |
|---|---|---|---|
| Quadrant D | 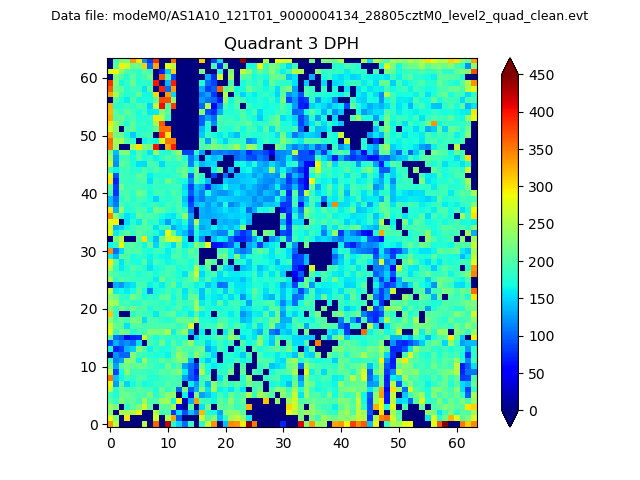 |
 |
Quadrant C |
| Plot type | Count rate plots | Images |
|---|---|---|
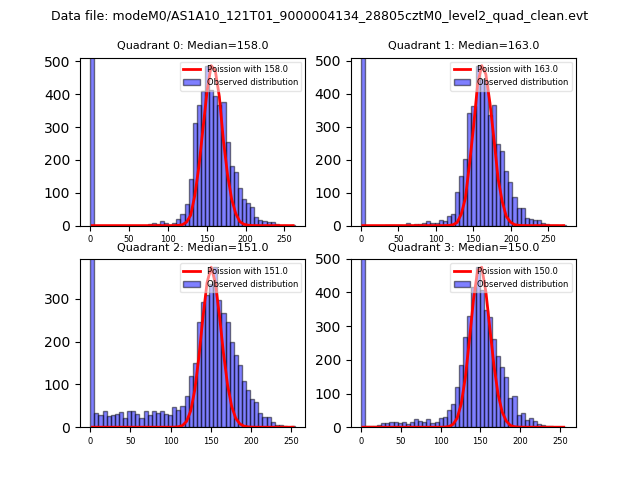
| Comparison with Poisson distribution Blue bars denote a histogram of data divided into 1 sec bins. Red curve is a Poisson curve with rate = median count rate of data. |
 |
 |
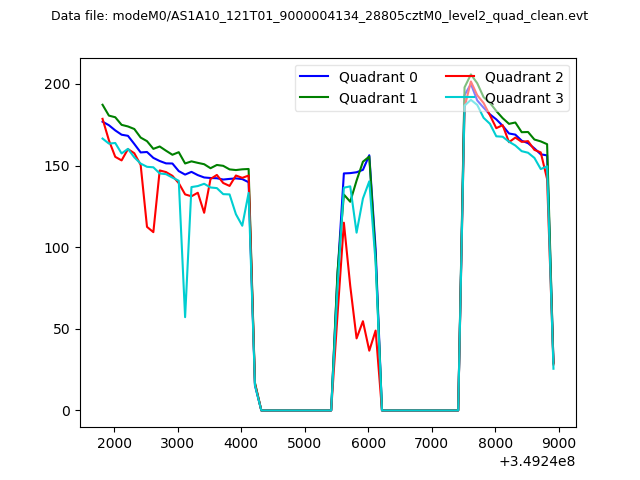
| Quadrant-wise count rates Data is divided into 100 sec bins |
 |
|
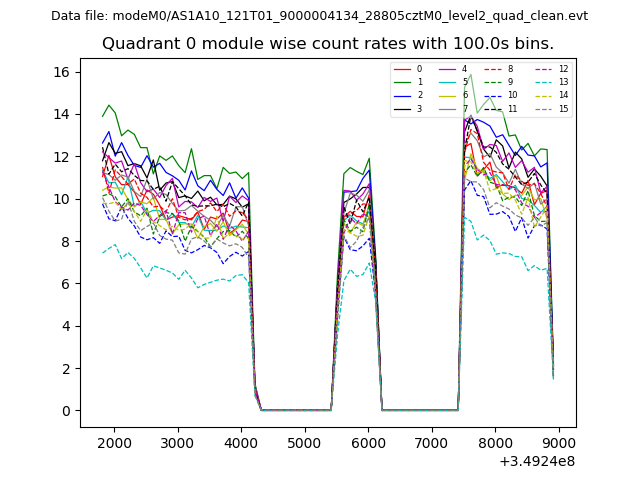
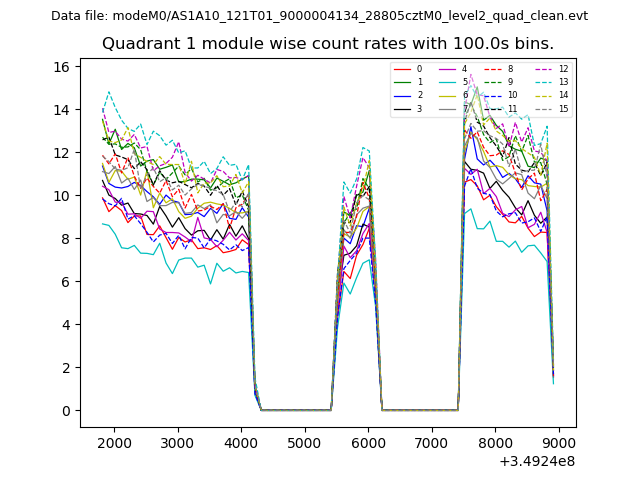
| Module-wise count rates for Quadrant A Data is divided into 100 sec bins |
 |
 |
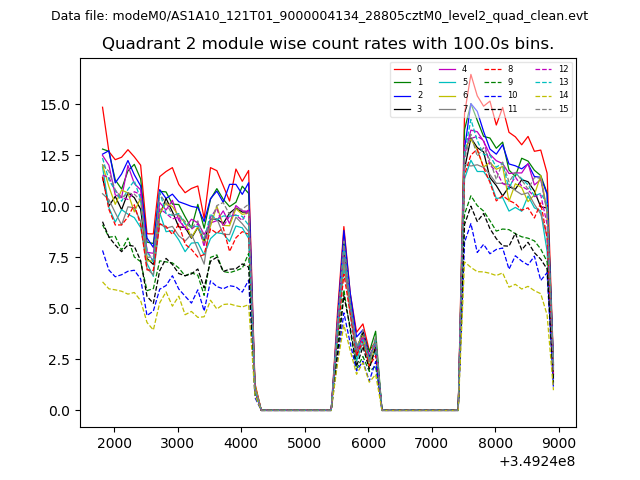
| Module-wise count rates for Quadrant B Data is divided into 100 sec bins |
 |
 |
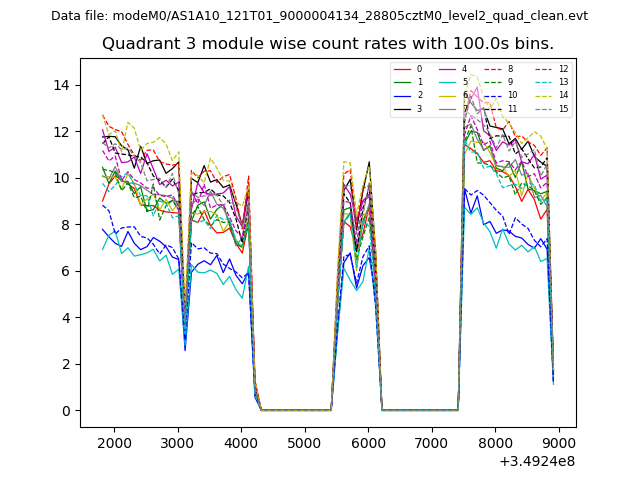
| Module-wise count rates for Quadrant C Data is divided into 100 sec bins |
 |
 |
| Module-wise count rates for Quadrant D Data is divided into 100 sec bins |
 |
 |
| Parameter | Plot |
|---|---|
| CZT HV Monitor | 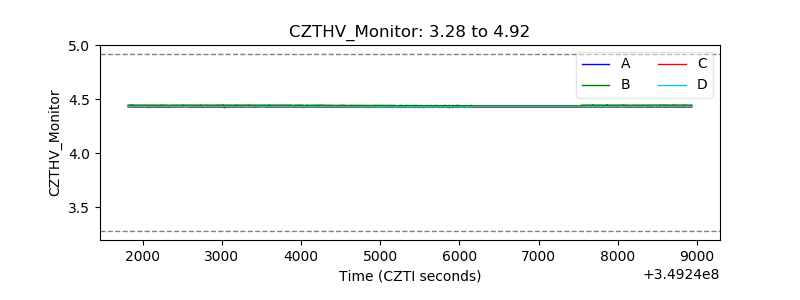 |
| D_VDD | 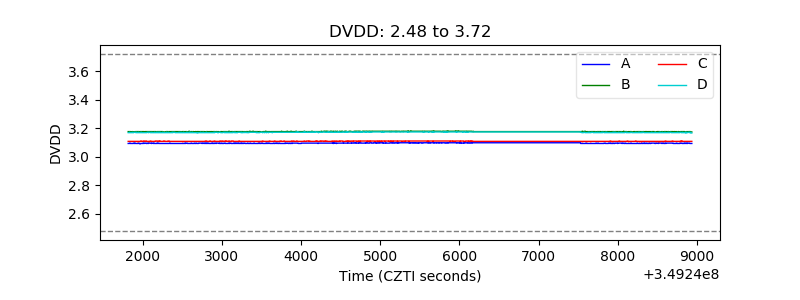 |
| Temperature 1 | 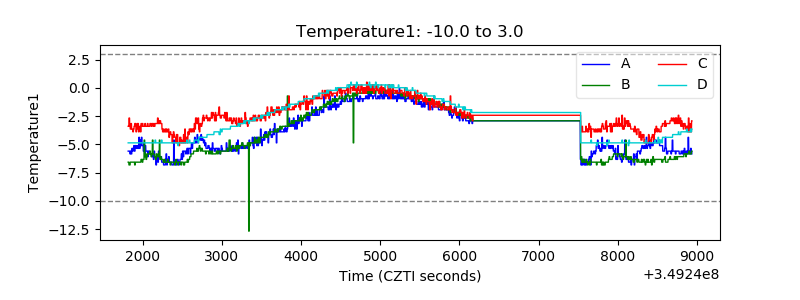 |
| Veto HV Monitor | 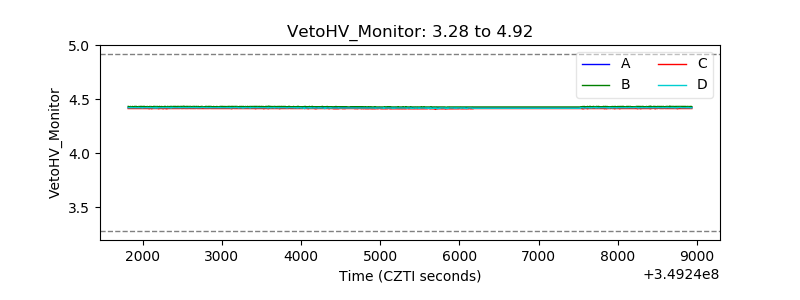 |
| Veto LLD | 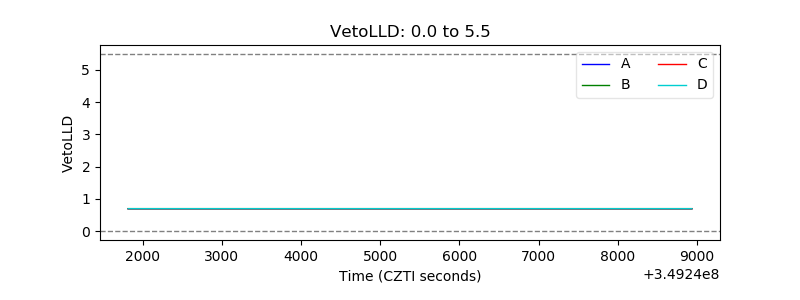 |
| Alpha Counter | 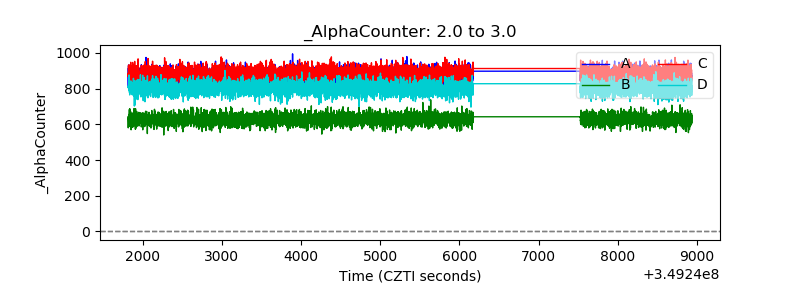 |
| _CPM_Rate | 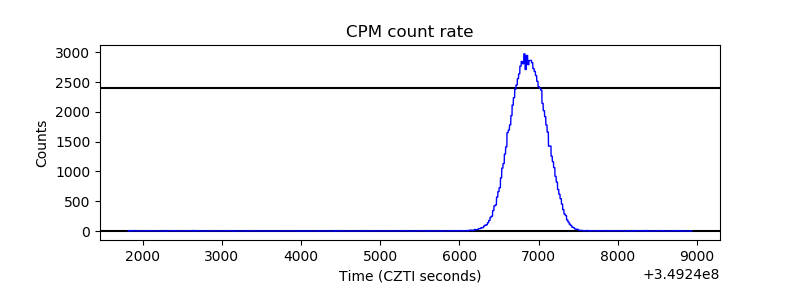 |
| CZT Counter | 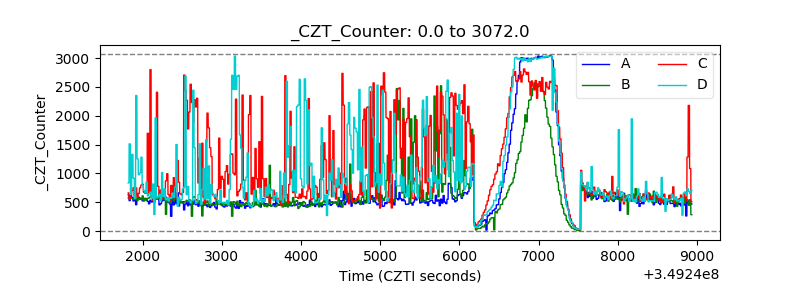 |
| +2.5 Volts monitor | 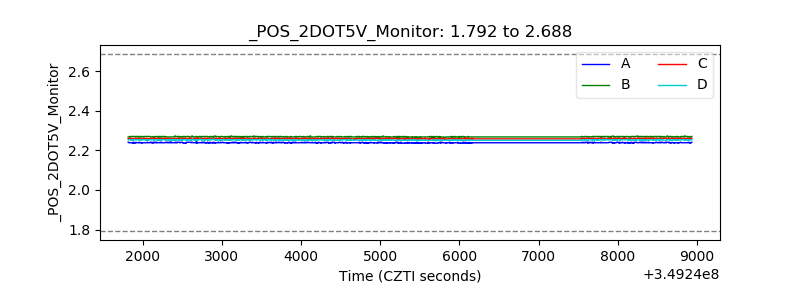 |
| +5 Volts monitor | 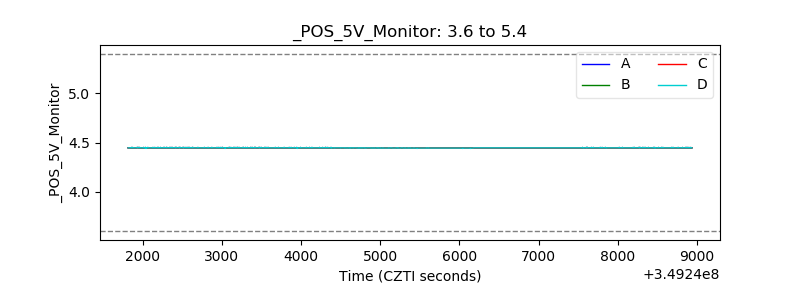 |
| _ROLL_ROT | 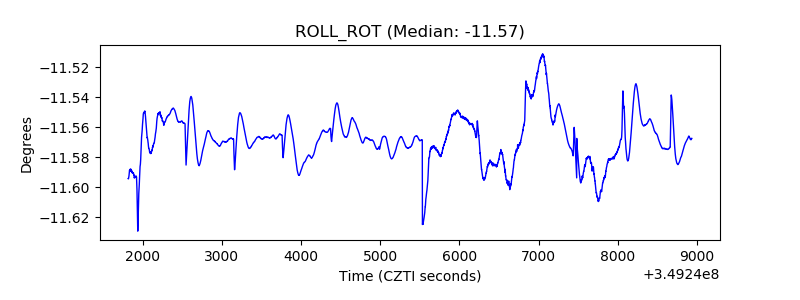 |
| _Roll_DEC | 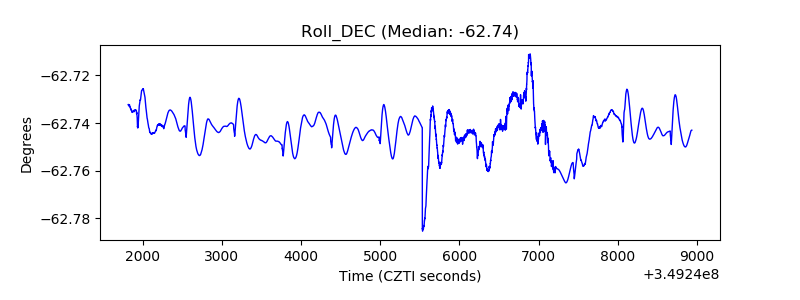 |
| _Roll_RA | 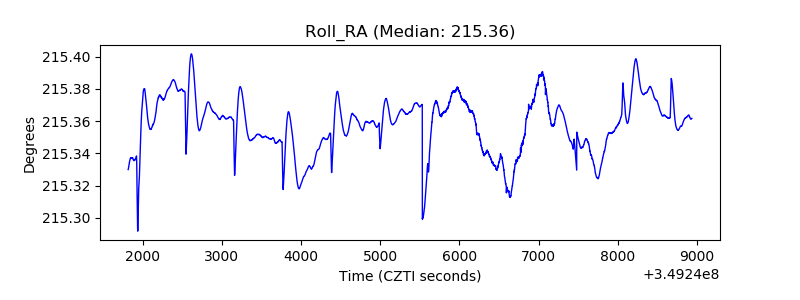 |
| Veto Counter | 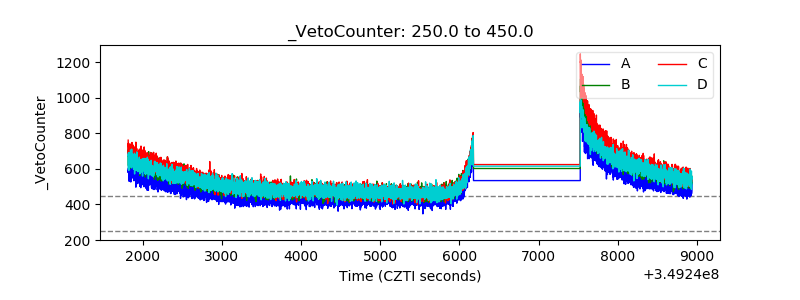 |