| Param | Original file | Final file |
|---|---|---|
| Filename | modeM0/AS1A10_121T01_9000004134_28807cztM0_level2.evt | modeM0/AS1A10_121T01_9000004134_28807cztM0_level2_quad_clean.evt |
| Size (bytes) | 562,256,640 | 104,745,600 |
| Size | 536.2 MB | 99.9 MB |
| Events in quadrant A | 3,317,810 | 698,246 |
| Events in quadrant B | 3,926,856 | 710,511 |
| Events in quadrant C | 3,781,499 | 687,522 |
| Events in quadrant D | 5,585,974 | 647,029 |
| Mode M9 | |||
|---|---|---|---|
| Quadrant | BADHDUFLAG | Total packets | Discarded packets |
| A | 0 | 11 | 0 |
| B | 0 | 11 | 0 |
| C | 0 | 11 | 0 |
| D | 0 | 11 | 0 |
| Mode M0 | |||
|---|---|---|---|
| Quadrant | BADHDUFLAG | Total packets | Discarded packets |
| A | 0 | 13475 | 1 |
| B | 0 | 15380 | 1 |
| C | 0 | 15081 | 1 |
| D | 0 | 20718 | 1 |
| Mode SS | |||
|---|---|---|---|
| Quadrant | BADHDUFLAG | Total packets | Discarded packets |
| A | 0 | 124 | 0 |
| B | 0 | 124 | 0 |
| C | 0 | 124 | 0 |
| D | 0 | 124 | 0 |
| Quadrant | Total seconds | Saturated seconds | Saturation percentage |
|---|---|---|---|
| A | 6144 | 128 | 2.083333% |
| B | 6144 | 279 | 4.541016% |
| C | 6144 | 244 | 3.971354% |
| D | 6144 | 462 | 7.519531% |
Noise dominated data is calculated using 1-second bins in cleaned event files. If a bin has >2000 counts, and if more than 50% of those come from <1% of pixels, then it is considered to be noise-dominated and hence unusable.
| Quadrant | # 1 sec bins | Bins with >0 counts | Bins with >2000 counts | High rate bins dominated by noise | Noise dominated (total time) | Noise dominated (detector-on time) | Marked lightcurve |
|---|---|---|---|---|---|---|---|
| A | 7259 | 6144 | 42 | 42 | 0.58% | 0.68% | 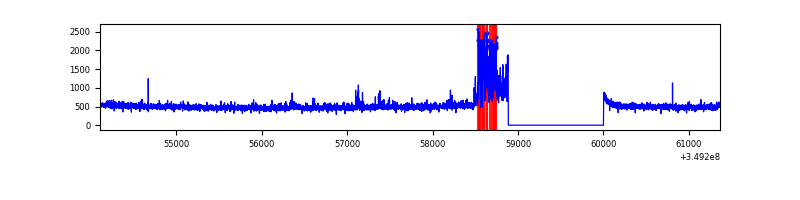 |
| B | 7259 | 6144 | 168 | 168 | 2.31% | 2.73% | 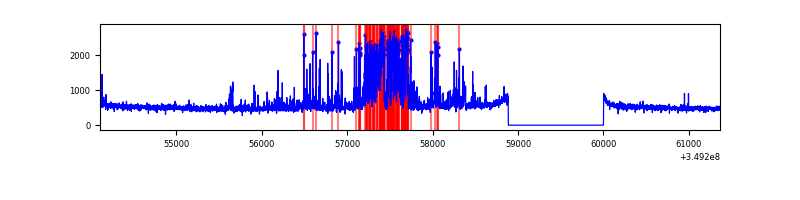 |
| C | 7259 | 6144 | 14 | 14 | 0.19% | 0.23% | 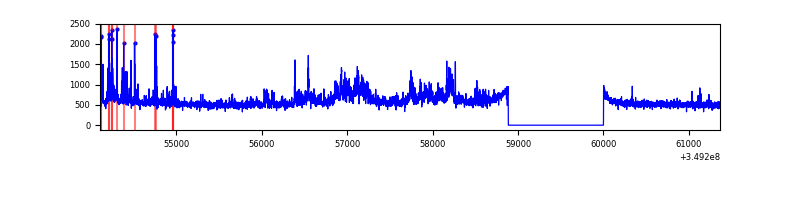 |
| D | 7259 | 6144 | 378 | 378 | 5.21% | 6.15% | 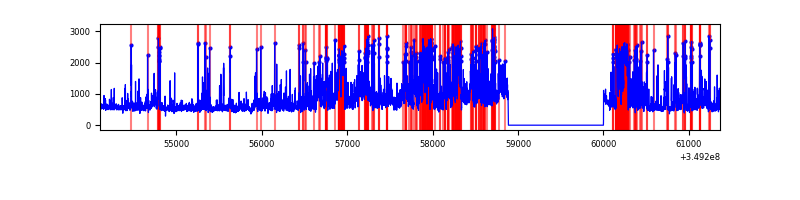 |
Top three noisy pixels from each quadrant. If the there are fewer than three noisy pixels in the level2.evt file, extra rows are filled as -1
| Pixel properties | Quadrant properties | ||||||
|---|---|---|---|---|---|---|---|
| Quadrant | DetID | PixID | Counts | Sigma | Mean | Median | Sigma |
| A | 14 | 235 | 287044 | 1855.38 | 780 | 765 | 154.3 |
| A | 13 | 254 | 12359 | 75.14 | 780 | 765 | 154.3 |
| A | 15 | 174 | 9613 | 57.34 | 780 | 765 | 154.3 |
| B | 5 | 172 | 609519 | 4265.4 | 768 | 750 | 142.7 |
| B | 5 | 255 | 218875 | 1528.32 | 768 | 750 | 142.7 |
| B | 0 | 190 | 36176 | 248.22 | 768 | 750 | 142.7 |
| C | 3 | 233 | 483397 | 2753.92 | 759 | 766 | 175.3 |
| C | 14 | 238 | 163886 | 930.77 | 759 | 766 | 175.3 |
| C | 4 | 254 | 108035 | 612.08 | 759 | 766 | 175.3 |
| D | 1 | 52 | 1443567 | 8037.04 | 756 | 737 | 179.5 |
| D | 8 | 195 | 632127 | 3517.05 | 756 | 737 | 179.5 |
| D | 13 | 104 | 367056 | 2040.52 | 756 | 737 | 179.5 |
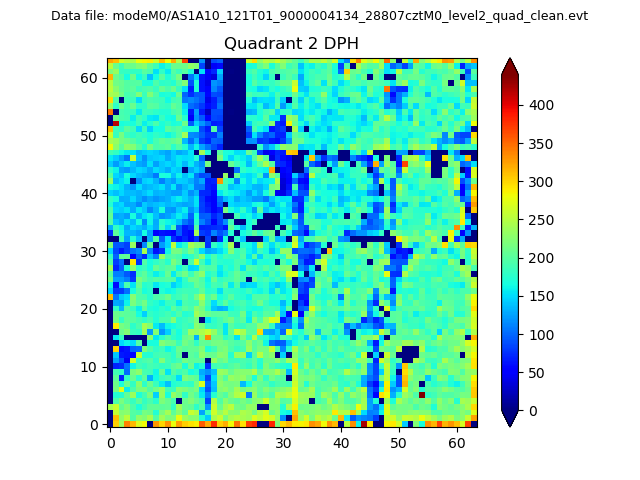
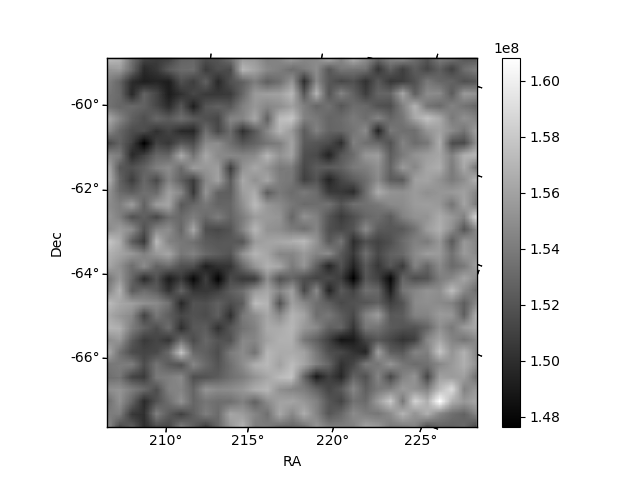
Histogram calculated using DETX and DETY for each event in the final _common_clean file
| Quadrant A | 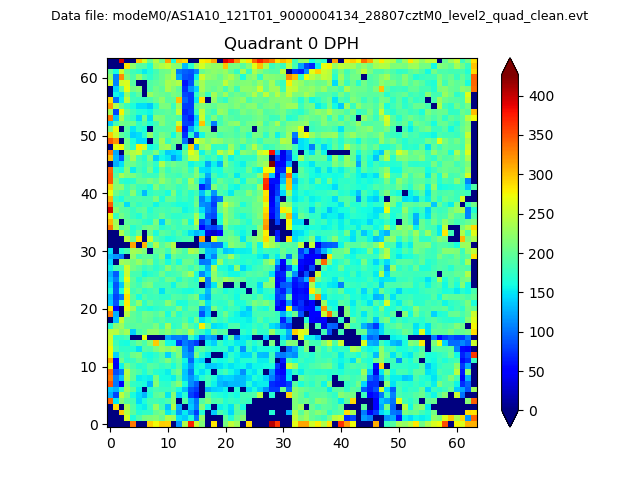 |
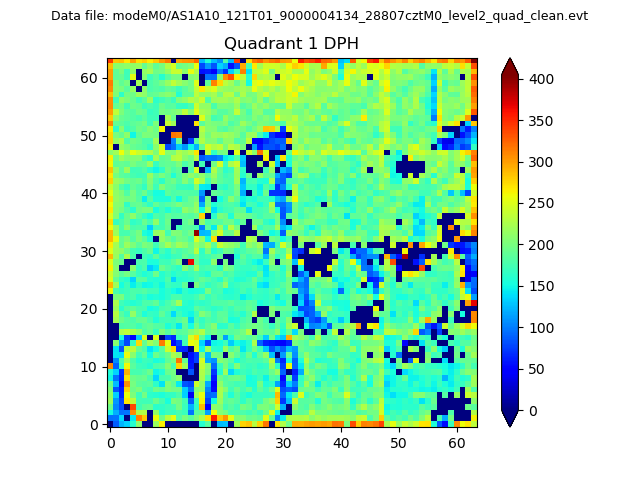 |
Quadrant B |
|---|---|---|---|
| Quadrant D | 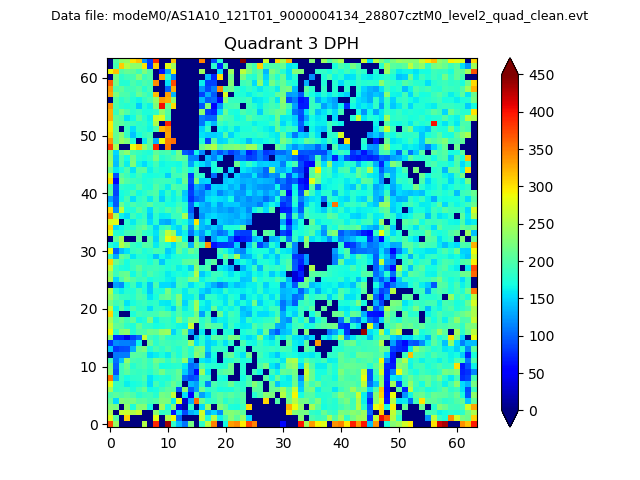 |
 |
Quadrant C |
| Plot type | Count rate plots | Images |
|---|---|---|
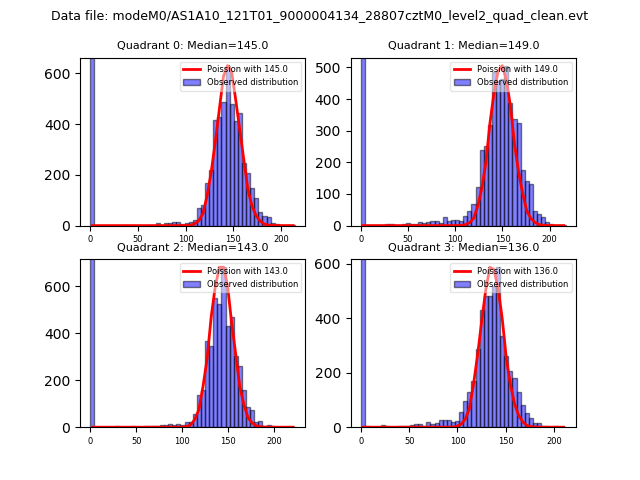
| Comparison with Poisson distribution Blue bars denote a histogram of data divided into 1 sec bins. Red curve is a Poisson curve with rate = median count rate of data. |
 |
 |
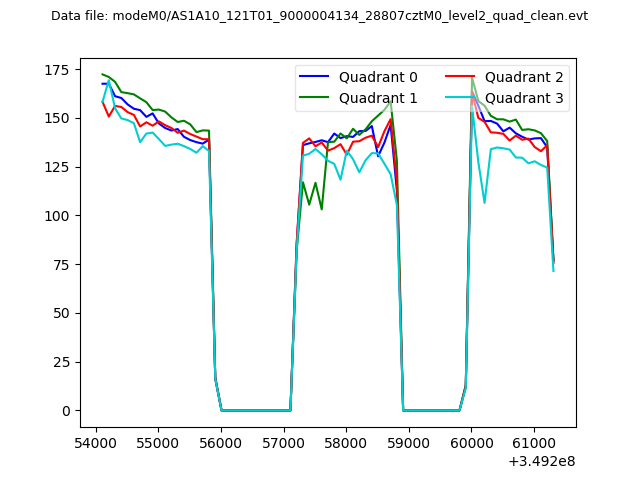
| Quadrant-wise count rates Data is divided into 100 sec bins |
 |
|
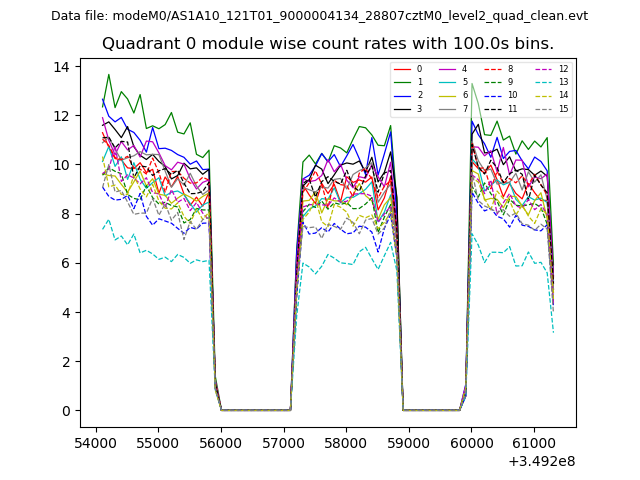
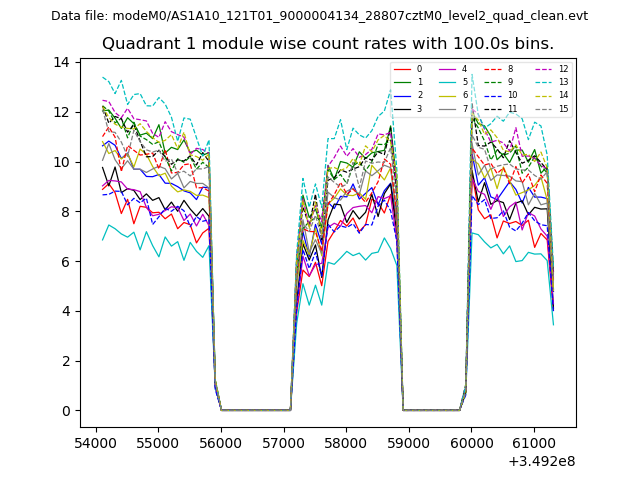
| Module-wise count rates for Quadrant A Data is divided into 100 sec bins |
 |
 |
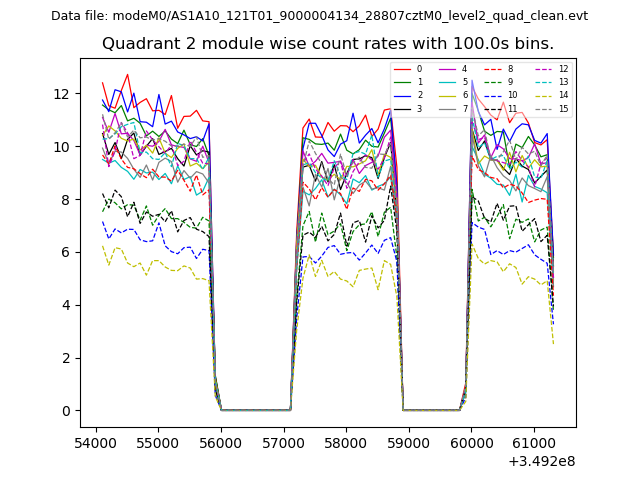
| Module-wise count rates for Quadrant B Data is divided into 100 sec bins |
 |
 |
| Module-wise count rates for Quadrant C Data is divided into 100 sec bins |
 |
 |
| Module-wise count rates for Quadrant D Data is divided into 100 sec bins |
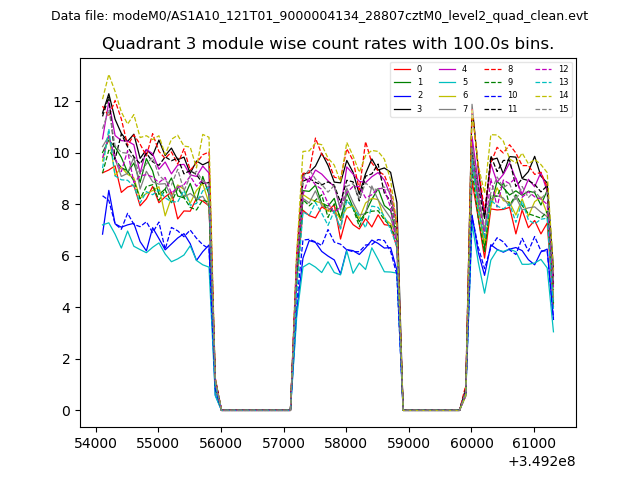 |
 |
| Parameter | Plot |
|---|---|
| CZT HV Monitor | 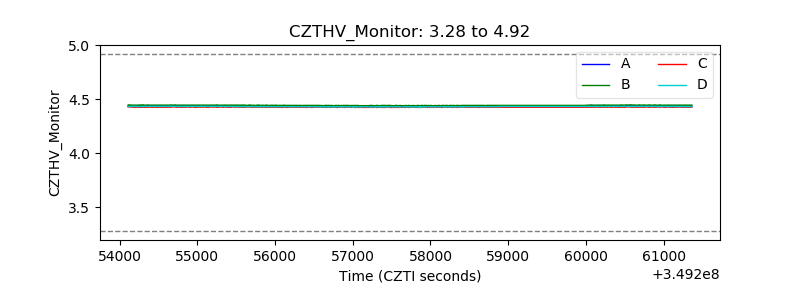 |
| D_VDD | 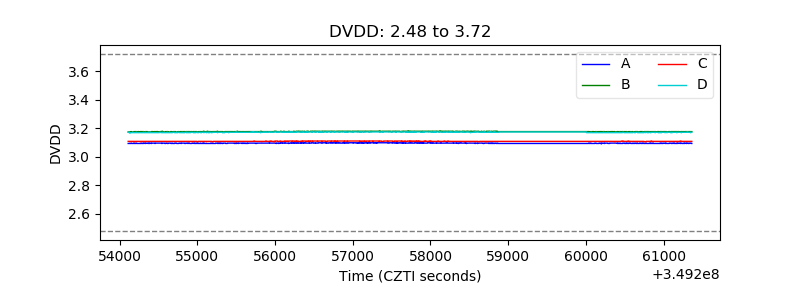 |
| Temperature 1 | 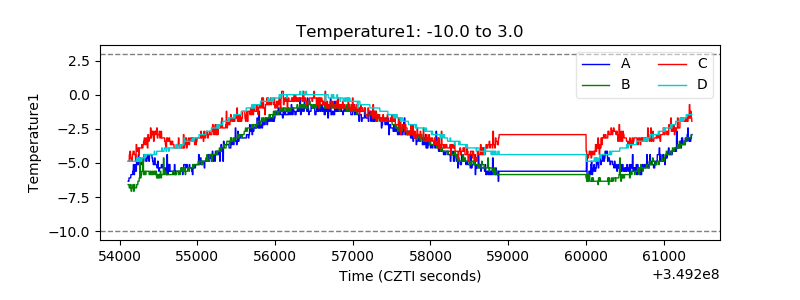 |
| Veto HV Monitor | 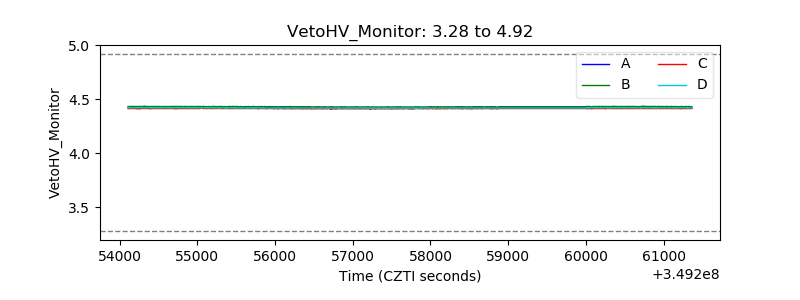 |
| Veto LLD | 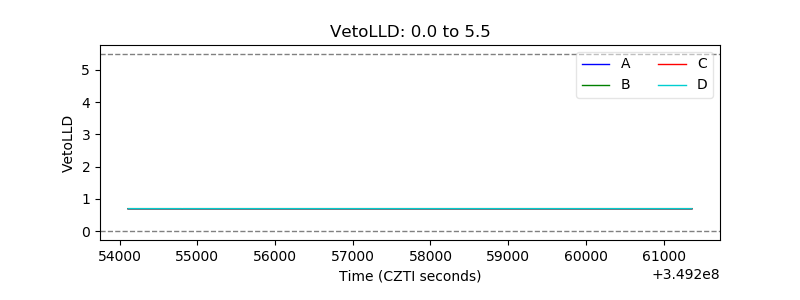 |
| Alpha Counter | 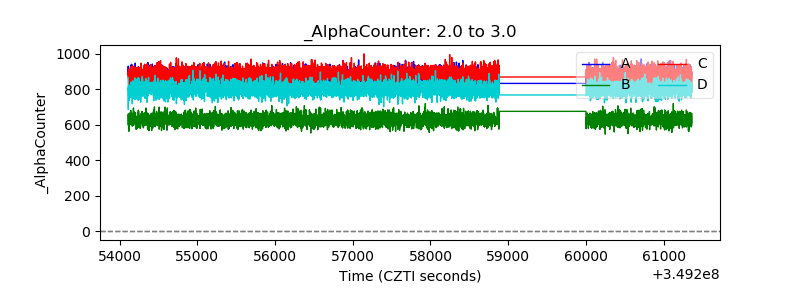 |
| _CPM_Rate | 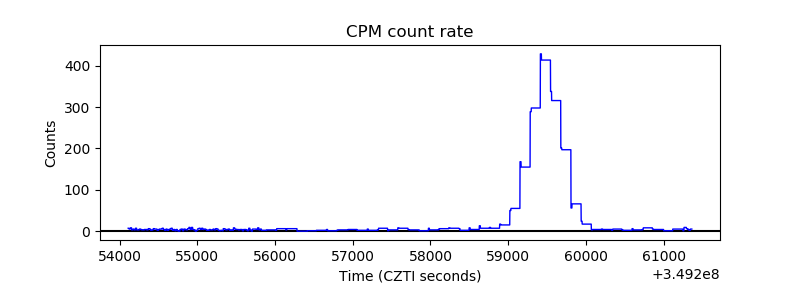 |
| CZT Counter | 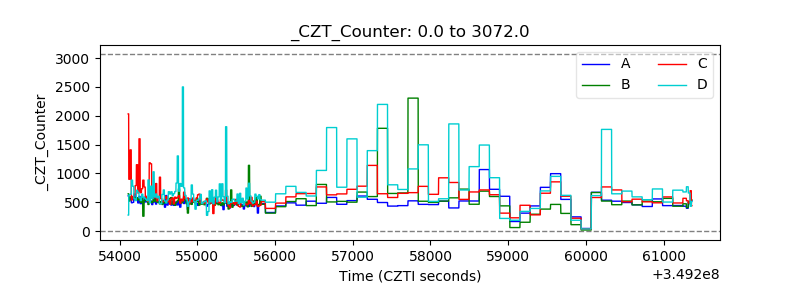 |
| +2.5 Volts monitor |  |
| +5 Volts monitor | 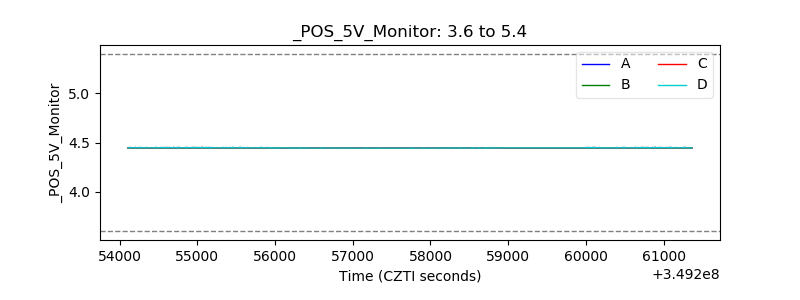 |
| _ROLL_ROT | 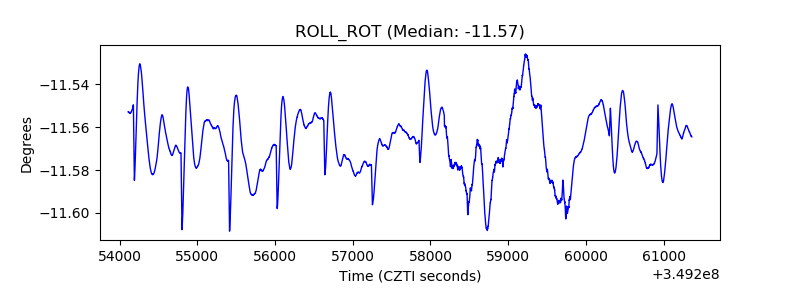 |
| _Roll_DEC | 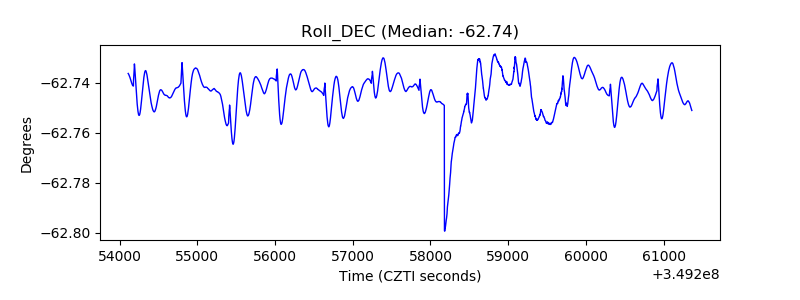 |
| _Roll_RA |  |
| Veto Counter | 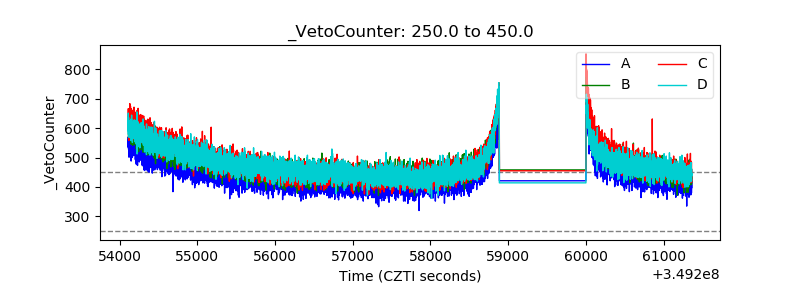 |