| Param | Original file | Final file |
|---|---|---|
| Filename | modeM0/AS1A10_121T01_9000004134_28809cztM0_level2.evt | modeM0/AS1A10_121T01_9000004134_28809cztM0_level2_quad_clean.evt |
| Size (bytes) | 714,931,200 | 110,802,240 |
| Size | 681.8 MB | 105.7 MB |
| Events in quadrant A | 3,851,707 | 724,227 |
| Events in quadrant B | 4,033,064 | 743,728 |
| Events in quadrant C | 4,090,031 | 712,766 |
| Events in quadrant D | 9,166,378 | 649,117 |
| Mode M9 | |||
|---|---|---|---|
| Quadrant | BADHDUFLAG | Total packets | Discarded packets |
| A | 0 | 2 | 0 |
| B | 0 | 2 | 0 |
| C | 0 | 2 | 0 |
| D | 0 | 2 | 0 |
| Mode M0 | |||
|---|---|---|---|
| Quadrant | BADHDUFLAG | Total packets | Discarded packets |
| A | 0 | 16238 | 1 |
| B | 0 | 16697 | 1 |
| C | 0 | 16672 | 1 |
| D | 0 | 32624 | 1 |
| Mode SS | |||
|---|---|---|---|
| Quadrant | BADHDUFLAG | Total packets | Discarded packets |
| A | 0 | 154 | 0 |
| B | 0 | 154 | 0 |
| C | 0 | 154 | 0 |
| D | 0 | 154 | 0 |
| Quadrant | Total seconds | Saturated seconds | Saturation percentage |
|---|---|---|---|
| A | 7551 | 298 | 3.946497% |
| B | 7551 | 341 | 4.515958% |
| C | 7551 | 351 | 4.648391% |
| D | 7550 | 1292 | 17.112583% |
Noise dominated data is calculated using 1-second bins in cleaned event files. If a bin has >2000 counts, and if more than 50% of those come from <1% of pixels, then it is considered to be noise-dominated and hence unusable.
| Quadrant | # 1 sec bins | Bins with >0 counts | Bins with >2000 counts | High rate bins dominated by noise | Noise dominated (total time) | Noise dominated (detector-on time) | Marked lightcurve |
|---|---|---|---|---|---|---|---|
| A | 7706 | 7551 | 34 | 34 | 0.44% | 0.45% | 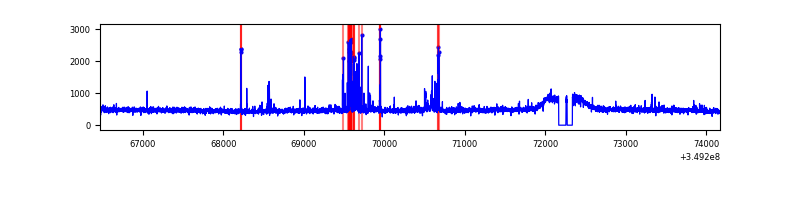 |
| B | 7706 | 7551 | 41 | 41 | 0.53% | 0.54% | 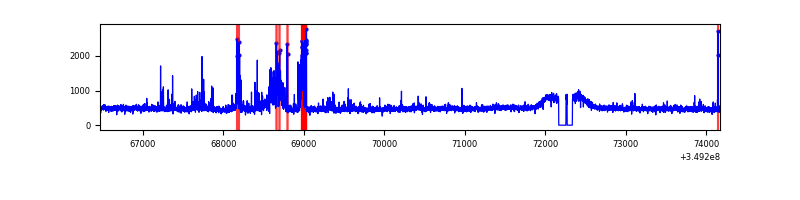 |
| C | 7706 | 7551 | 1 | 1 | 0.01% | 0.01% | 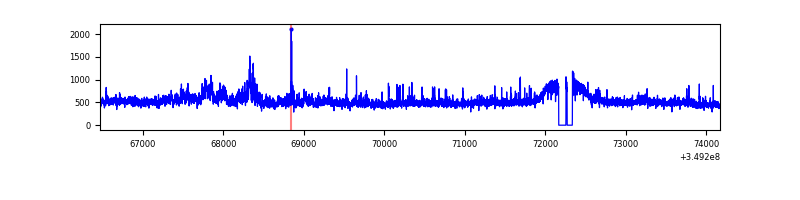 |
| D | 7705 | 7550 | 1019 | 1019 | 13.23% | 13.50% | 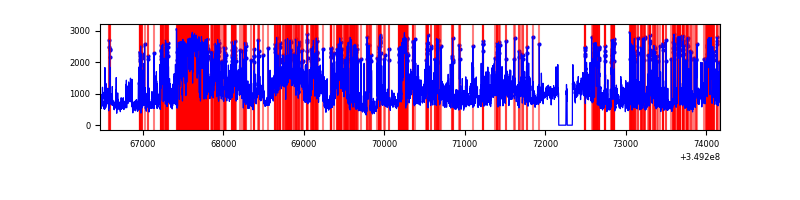 |
Top three noisy pixels from each quadrant. If the there are fewer than three noisy pixels in the level2.evt file, extra rows are filled as -1
| Pixel properties | Quadrant properties | ||||||
|---|---|---|---|---|---|---|---|
| Quadrant | DetID | PixID | Counts | Sigma | Mean | Median | Sigma |
| A | 14 | 235 | 234337 | 1250.6 | 928 | 906 | 186.7 |
| A | 13 | 254 | 14787 | 74.37 | 928 | 906 | 186.7 |
| A | 15 | 174 | 14209 | 71.27 | 928 | 906 | 186.7 |
| B | 5 | 172 | 167256 | 953.0 | 922 | 898 | 174.6 |
| B | 0 | 229 | 74095 | 419.32 | 922 | 898 | 174.6 |
| B | 0 | 244 | 60401 | 340.87 | 922 | 898 | 174.6 |
| C | 3 | 233 | 370546 | 1765.93 | 898 | 901 | 209.3 |
| C | 14 | 238 | 165760 | 787.59 | 898 | 901 | 209.3 |
| C | 14 | 254 | 34937 | 162.6 | 898 | 901 | 209.3 |
| D | 1 | 52 | 3486365 | 16845.52 | 864 | 838 | 206.9 |
| D | 8 | 195 | 1337840 | 6461.72 | 864 | 838 | 206.9 |
| D | 12 | 233 | 699142 | 3374.9 | 864 | 838 | 206.9 |
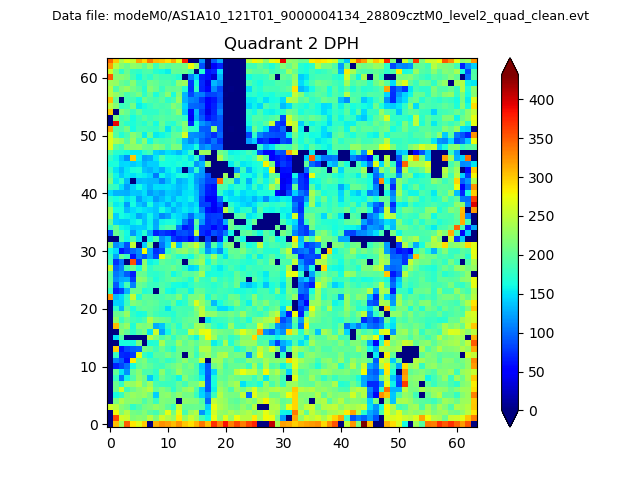
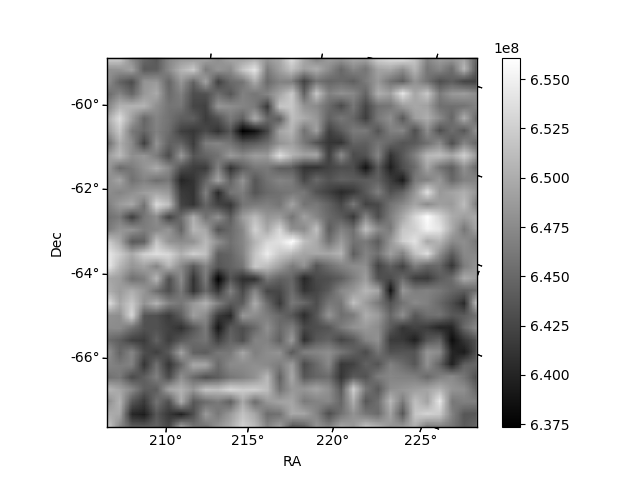
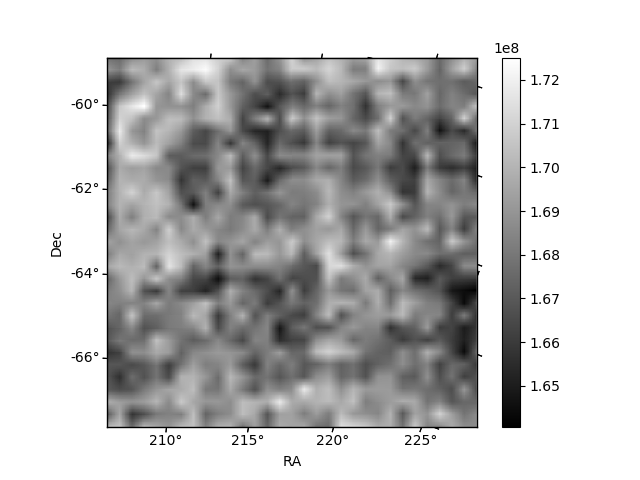
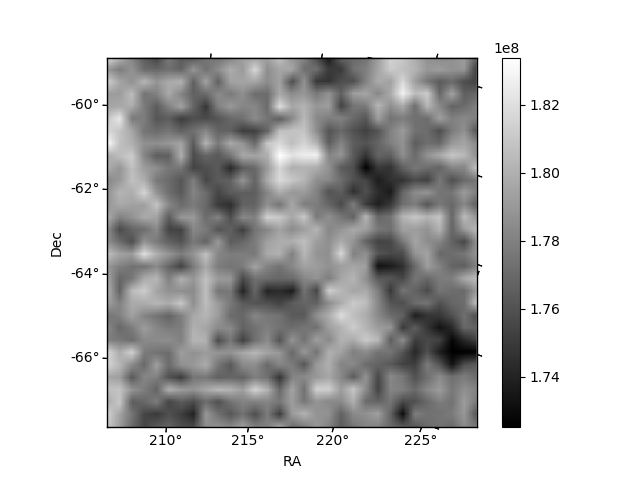
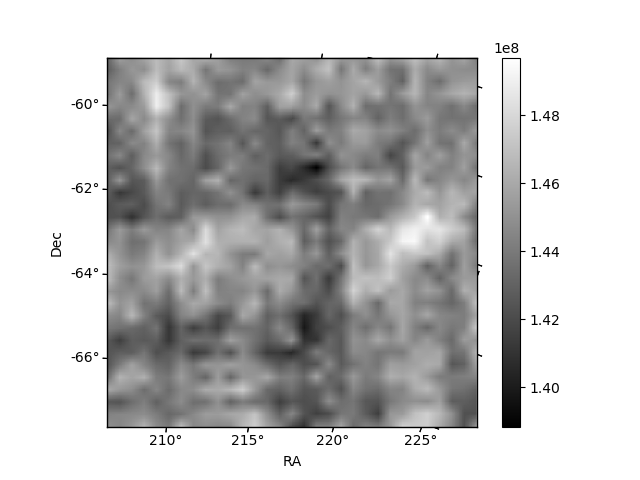
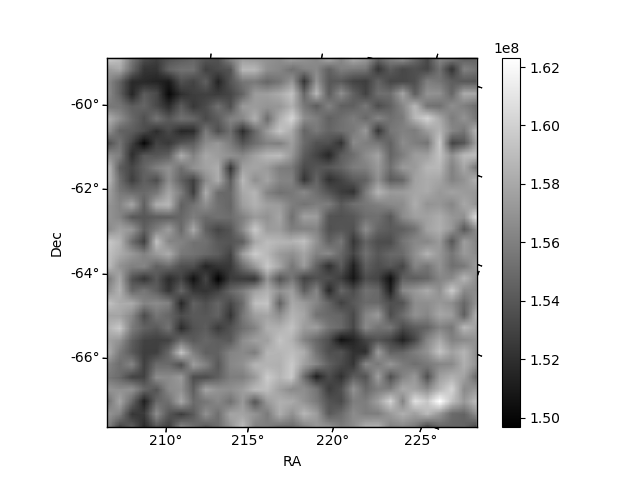
Histogram calculated using DETX and DETY for each event in the final _common_clean file
| Quadrant A | 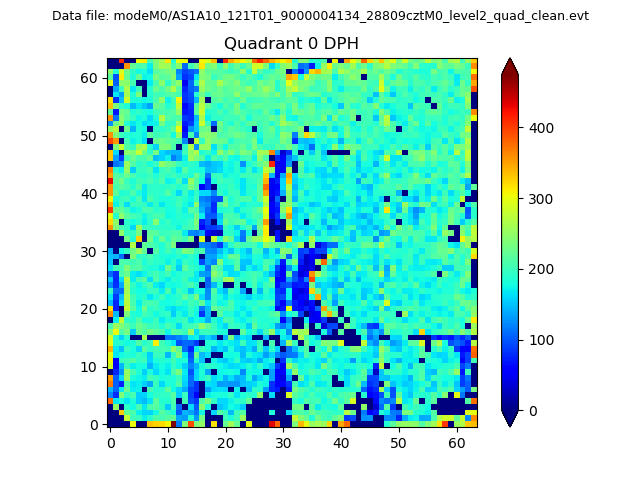 |
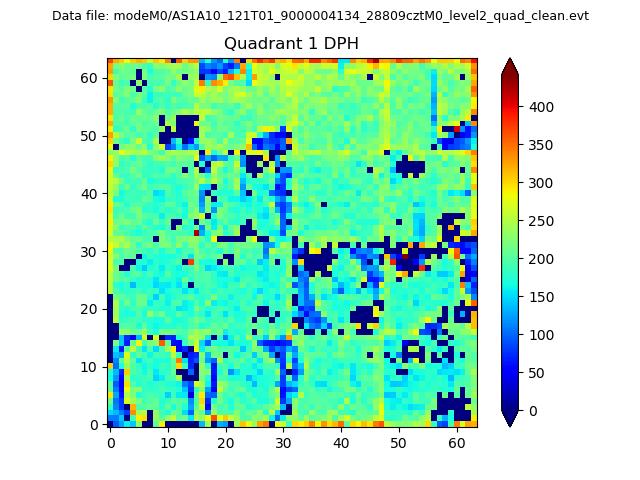 |
Quadrant B |
|---|---|---|---|
| Quadrant D | 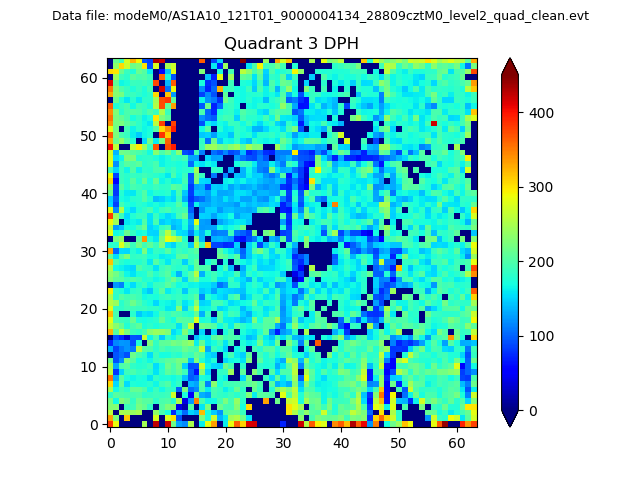 |
 |
Quadrant C |
| Plot type | Count rate plots | Images |
|---|---|---|
| Comparison with Poisson distribution Blue bars denote a histogram of data divided into 1 sec bins. Red curve is a Poisson curve with rate = median count rate of data. |
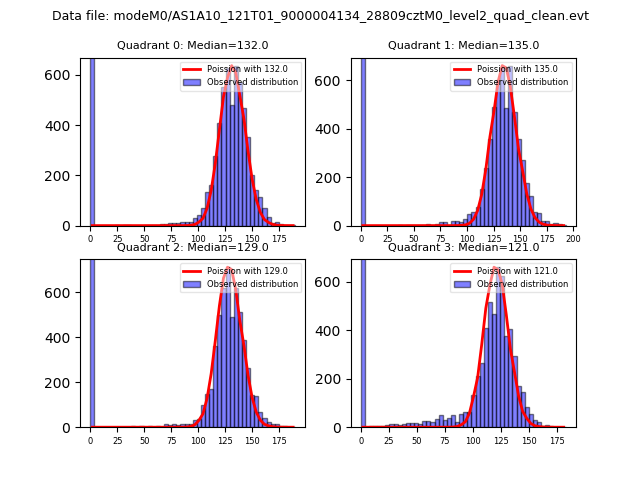 |
 |
| Quadrant-wise count rates Data is divided into 100 sec bins |
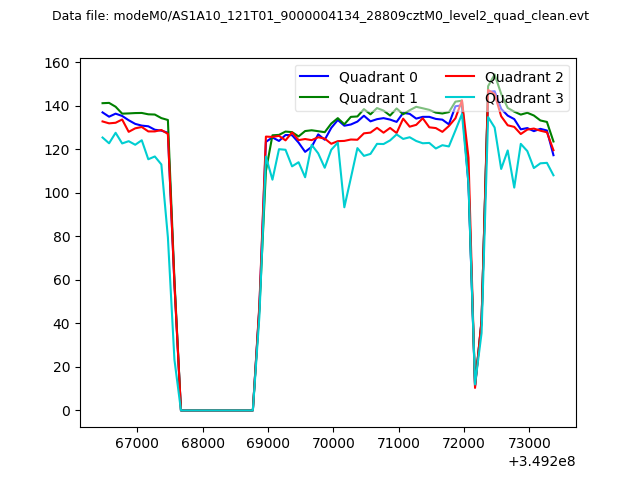 |
|
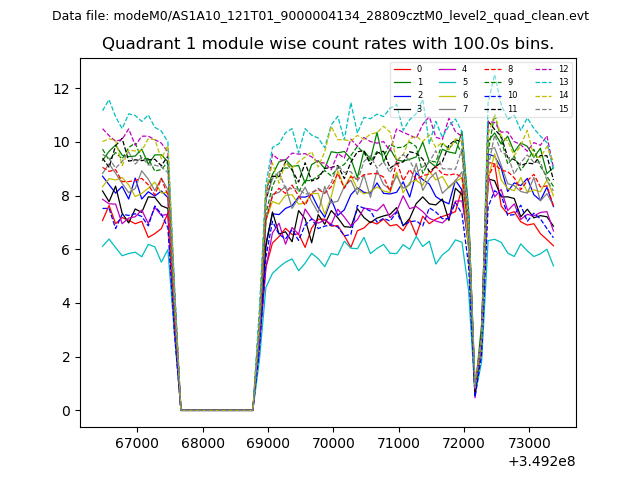
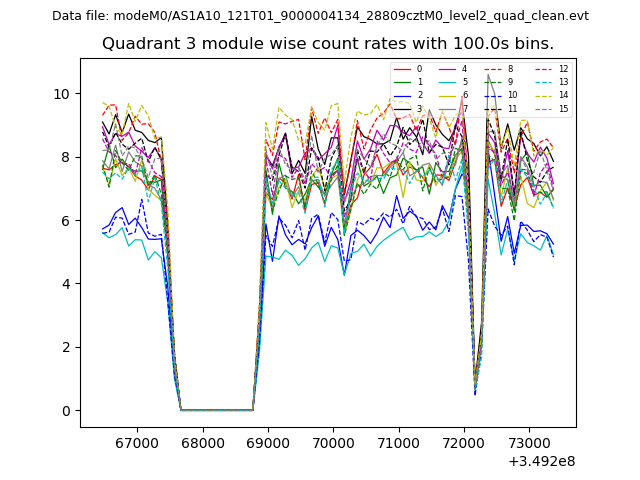
| Module-wise count rates for Quadrant A Data is divided into 100 sec bins |
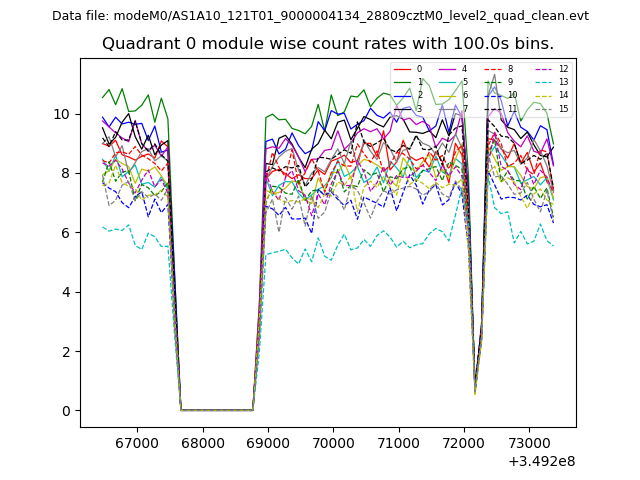 |
 |
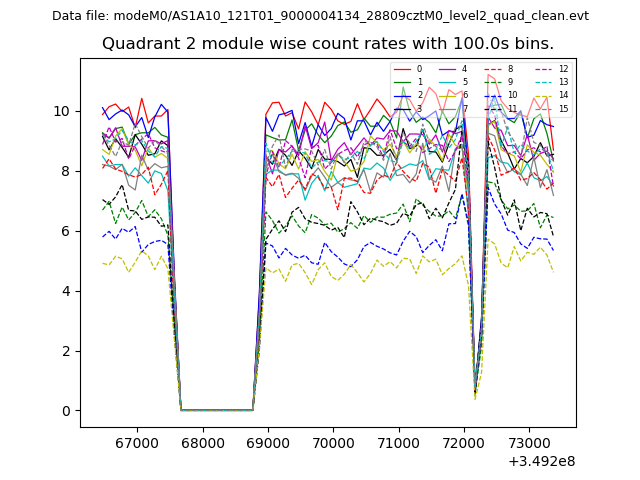
| Module-wise count rates for Quadrant B Data is divided into 100 sec bins |
 |
 |
| Module-wise count rates for Quadrant C Data is divided into 100 sec bins |
 |
 |
| Module-wise count rates for Quadrant D Data is divided into 100 sec bins |
 |
 |
| Parameter | Plot |
|---|---|
| CZT HV Monitor | 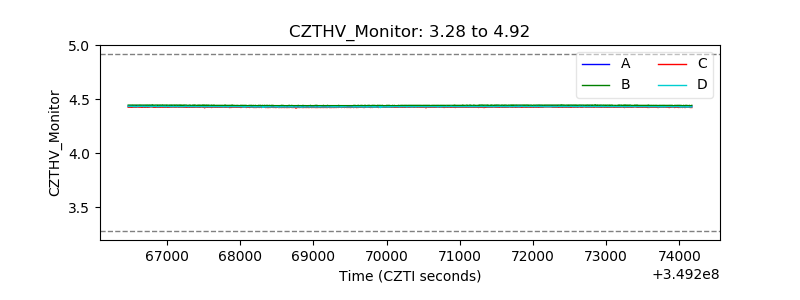 |
| D_VDD | 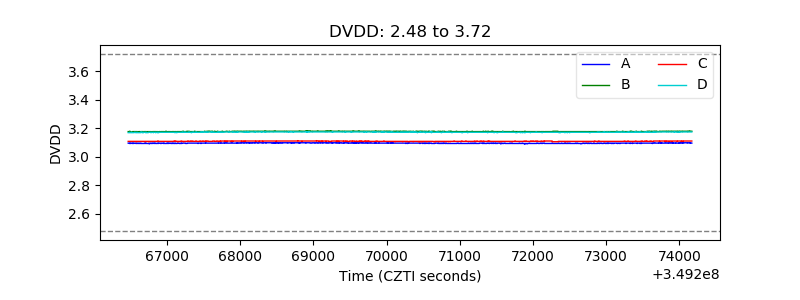 |
| Temperature 1 | 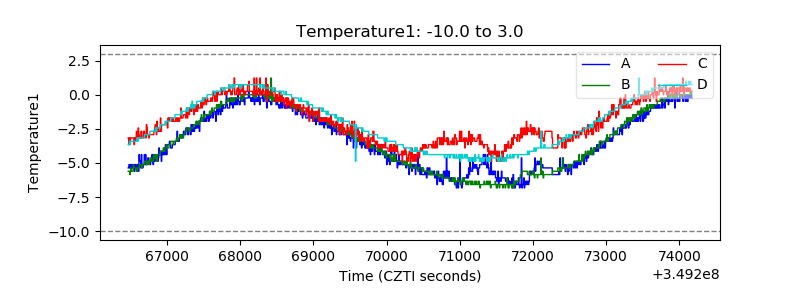 |
| Veto HV Monitor | 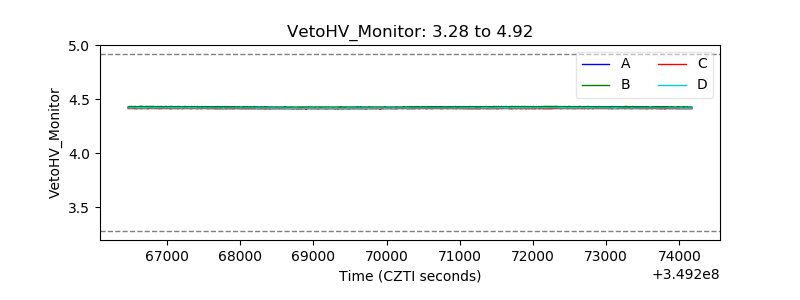 |
| Veto LLD | 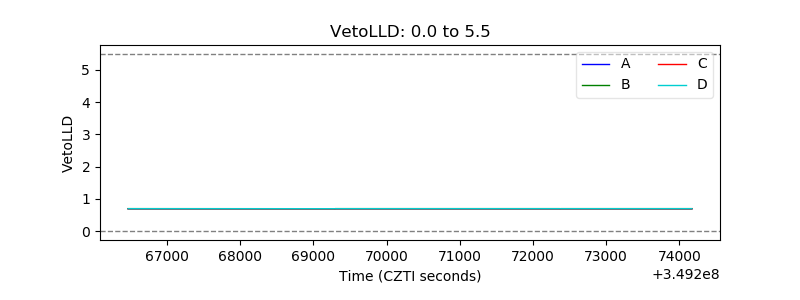 |
| Alpha Counter | 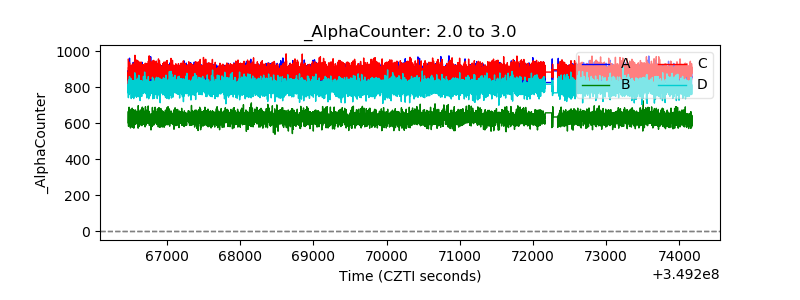 |
| _CPM_Rate | 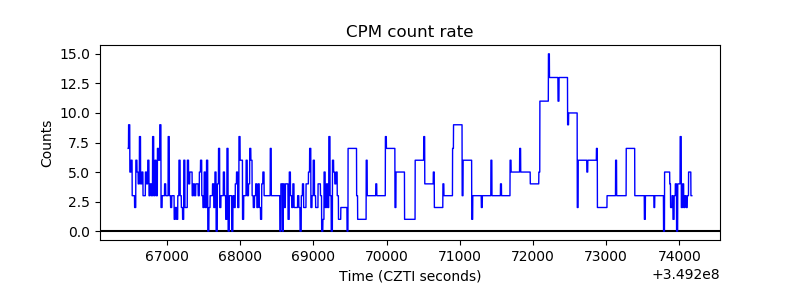 |
| CZT Counter | 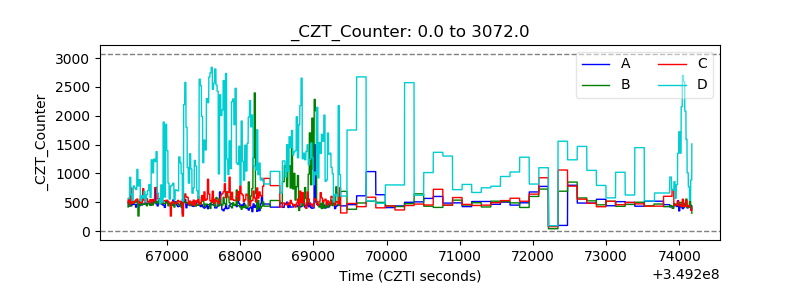 |
| +2.5 Volts monitor |  |
| +5 Volts monitor | 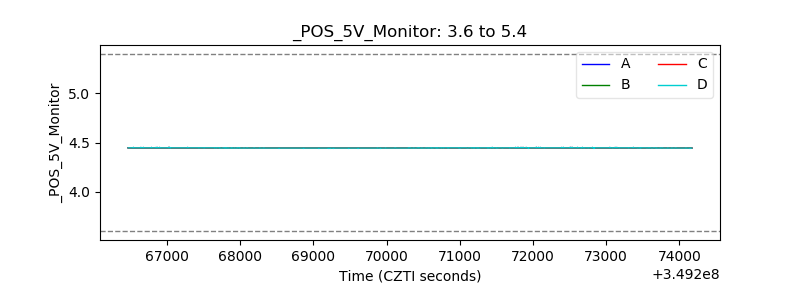 |
| _ROLL_ROT | 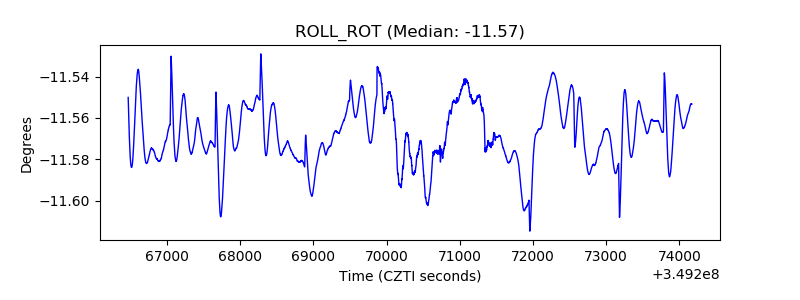 |
| _Roll_DEC | 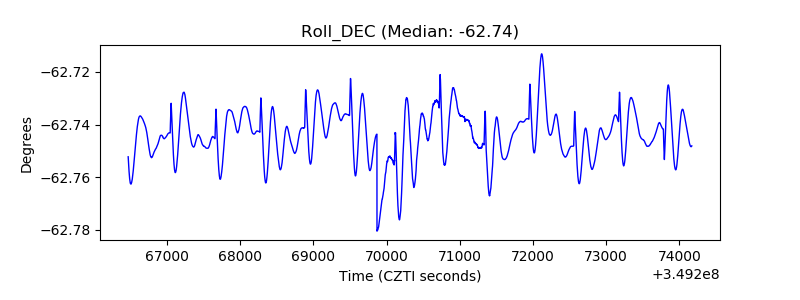 |
| _Roll_RA | 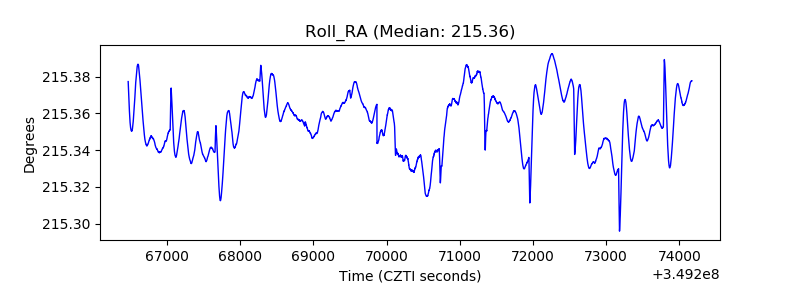 |
| Veto Counter | 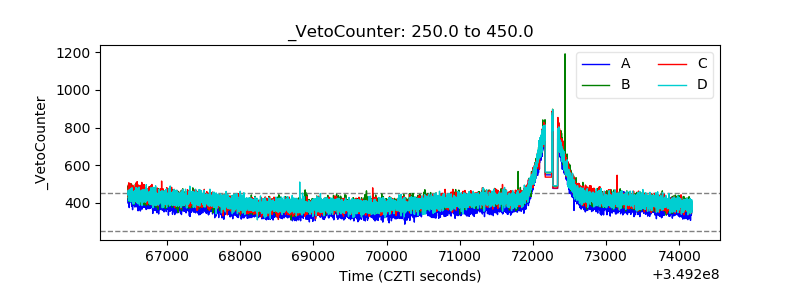 |