| Param | Original file | Final file |
|---|---|---|
| Filename | modeM0/AS1A10_121T01_9000004134_28810cztM0_level2.evt | modeM0/AS1A10_121T01_9000004134_28810cztM0_level2_quad_clean.evt |
| Size (bytes) | 709,401,600 | 103,921,920 |
| Size | 676.5 MB | 99.1 MB |
| Events in quadrant A | 4,075,256 | 670,899 |
| Events in quadrant B | 4,543,853 | 671,842 |
| Events in quadrant C | 4,491,046 | 651,513 |
| Events in quadrant D | 7,853,735 | 617,297 |
| Mode M0 | |||
|---|---|---|---|
| Quadrant | BADHDUFLAG | Total packets | Discarded packets |
| A | 0 | 16932 | 0 |
| B | 0 | 18341 | 0 |
| C | 0 | 18319 | 0 |
| D | 0 | 28647 | 0 |
| Mode SS | |||
|---|---|---|---|
| Quadrant | BADHDUFLAG | Total packets | Discarded packets |
| A | 0 | 154 | 0 |
| B | 0 | 154 | 0 |
| C | 0 | 154 | 0 |
| D | 0 | 154 | 0 |
| Quadrant | Total seconds | Saturated seconds | Saturation percentage |
|---|---|---|---|
| A | 7689 | 321 | 4.174795% |
| B | 7690 | 570 | 7.412224% |
| C | 7689 | 463 | 6.021589% |
| D | 7689 | 1061 | 13.798934% |
Noise dominated data is calculated using 1-second bins in cleaned event files. If a bin has >2000 counts, and if more than 50% of those come from <1% of pixels, then it is considered to be noise-dominated and hence unusable.
| Quadrant | # 1 sec bins | Bins with >0 counts | Bins with >2000 counts | High rate bins dominated by noise | Noise dominated (total time) | Noise dominated (detector-on time) | Marked lightcurve |
|---|---|---|---|---|---|---|---|
| A | 7689 | 7689 | 13 | 13 | 0.17% | 0.17% | 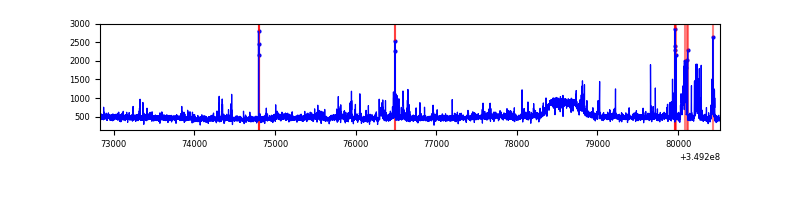 |
| B | 7690 | 7690 | 223 | 223 | 2.90% | 2.90% | 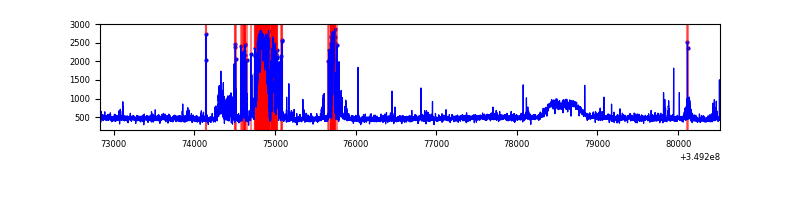 |
| C | 7689 | 7689 | 1 | 1 | 0.01% | 0.01% | 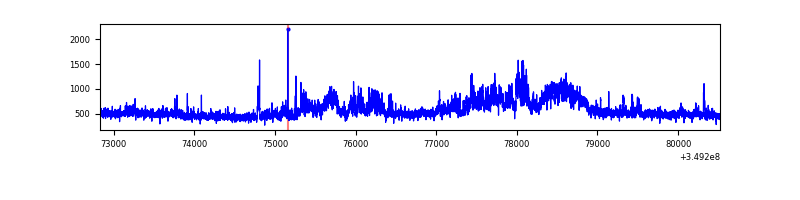 |
| D | 7688 | 7688 | 771 | 771 | 10.03% | 10.03% | 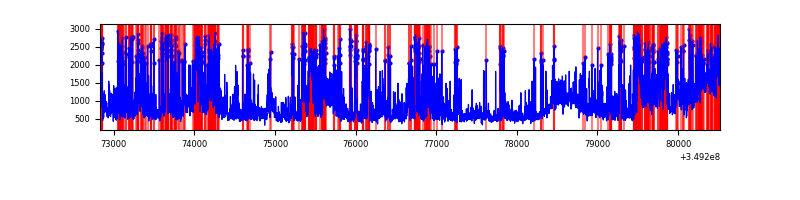 |
Top three noisy pixels from each quadrant. If the there are fewer than three noisy pixels in the level2.evt file, extra rows are filled as -1
| Pixel properties | Quadrant properties | ||||||
|---|---|---|---|---|---|---|---|
| Quadrant | DetID | PixID | Counts | Sigma | Mean | Median | Sigma |
| A | 14 | 235 | 344244 | 1781.26 | 949 | 927 | 192.7 |
| A | 4 | 2 | 23797 | 118.66 | 949 | 927 | 192.7 |
| A | 15 | 174 | 20606 | 102.1 | 949 | 927 | 192.7 |
| B | 5 | 172 | 725168 | 4110.83 | 928 | 903 | 176.2 |
| B | 0 | 229 | 77133 | 432.67 | 928 | 903 | 176.2 |
| B | 12 | 111 | 21320 | 115.88 | 928 | 903 | 176.2 |
| C | 3 | 233 | 709414 | 3336.28 | 905 | 908 | 212.4 |
| C | 14 | 238 | 184151 | 862.87 | 905 | 908 | 212.4 |
| C | 14 | 254 | 61941 | 287.4 | 905 | 908 | 212.4 |
| D | 1 | 52 | 2063949 | 9527.39 | 895 | 866 | 216.5 |
| D | 8 | 195 | 1200421 | 5539.59 | 895 | 866 | 216.5 |
| D | 2 | 250 | 325083 | 1497.25 | 895 | 866 | 216.5 |
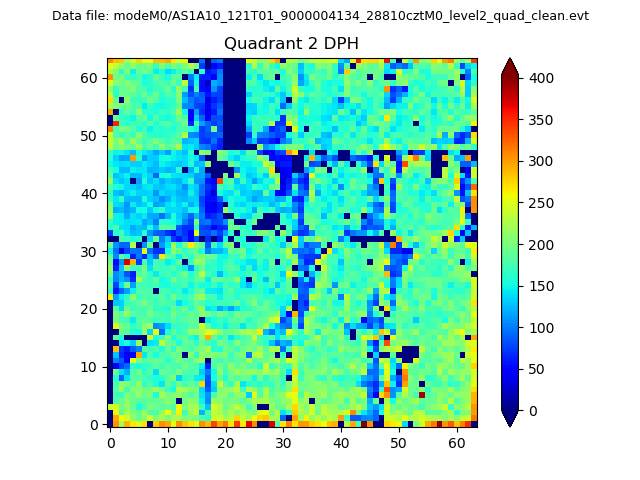
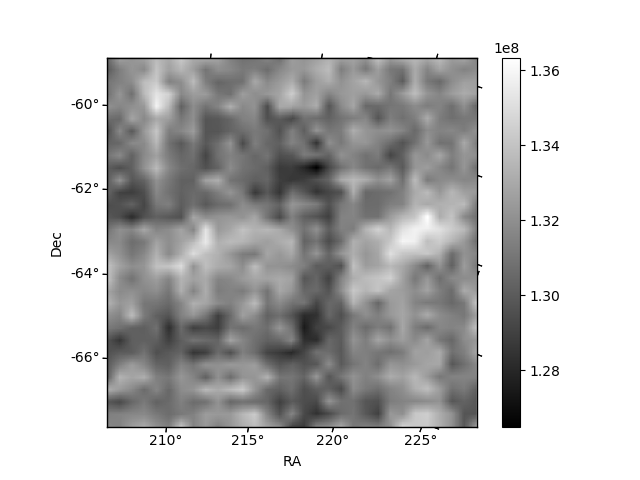
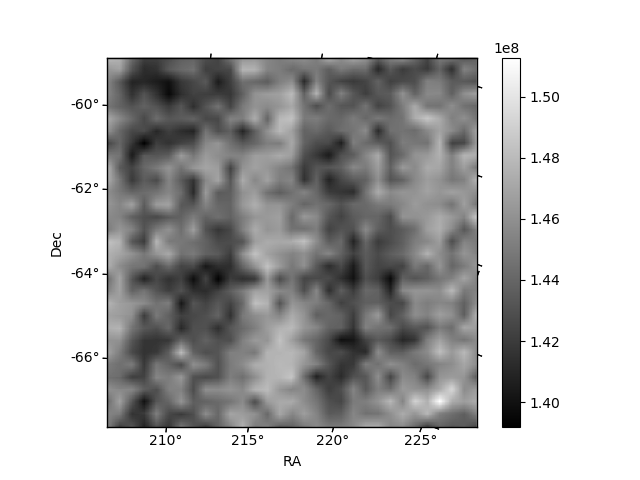
Histogram calculated using DETX and DETY for each event in the final _common_clean file
| Quadrant A | 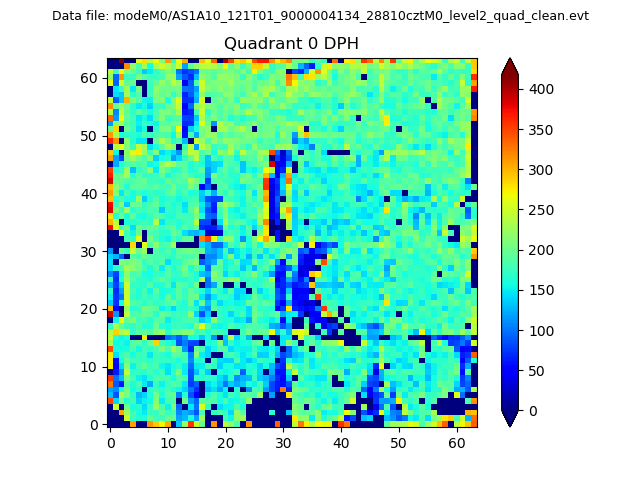 |
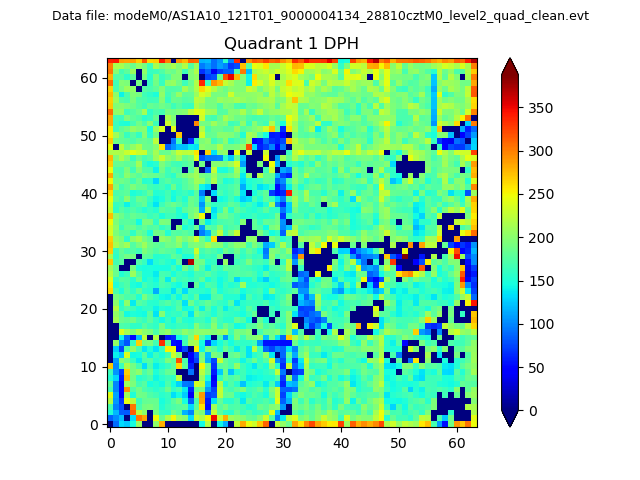 |
Quadrant B |
|---|---|---|---|
| Quadrant D | 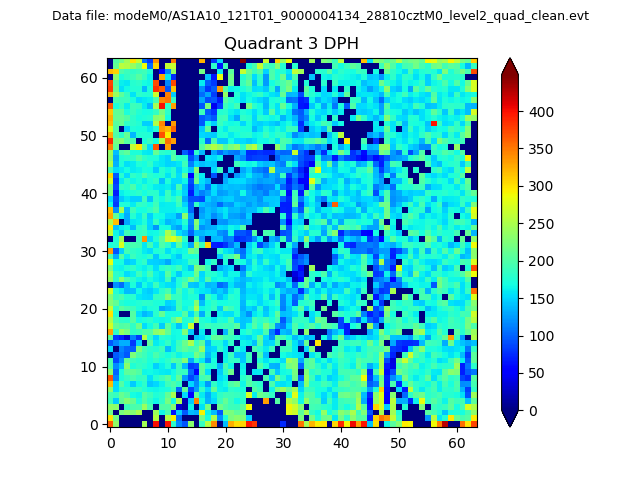 |
 |
Quadrant C |
| Plot type | Count rate plots | Images |
|---|---|---|
| Comparison with Poisson distribution Blue bars denote a histogram of data divided into 1 sec bins. Red curve is a Poisson curve with rate = median count rate of data. |
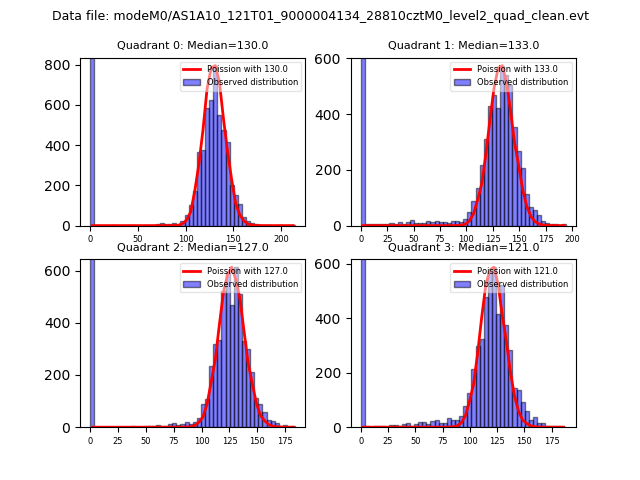 |
 |
| Quadrant-wise count rates Data is divided into 100 sec bins |
 |
|
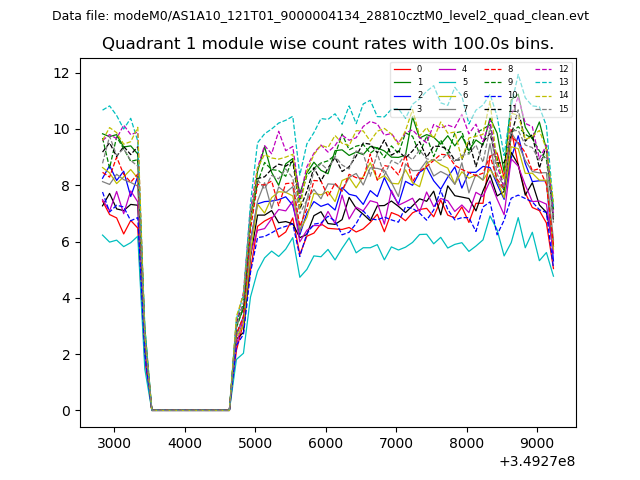
| Module-wise count rates for Quadrant A Data is divided into 100 sec bins |
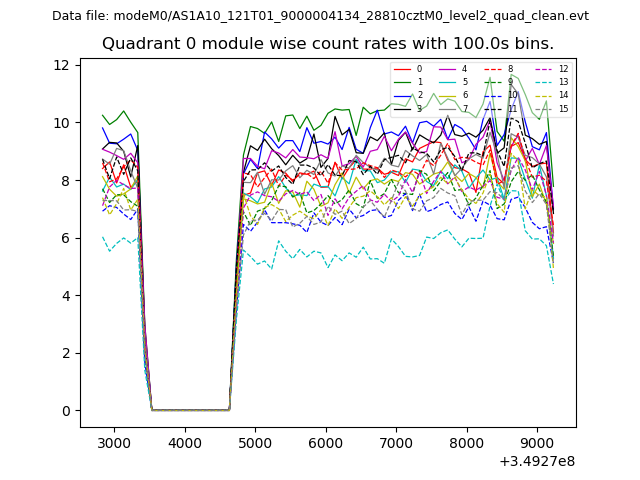 |
 |
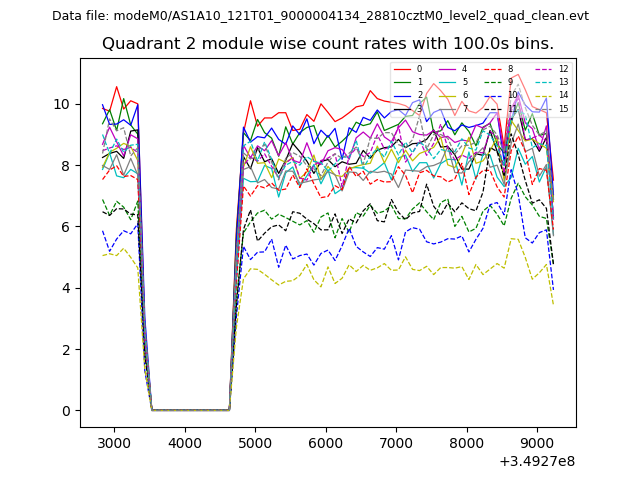
| Module-wise count rates for Quadrant B Data is divided into 100 sec bins |
 |
 |
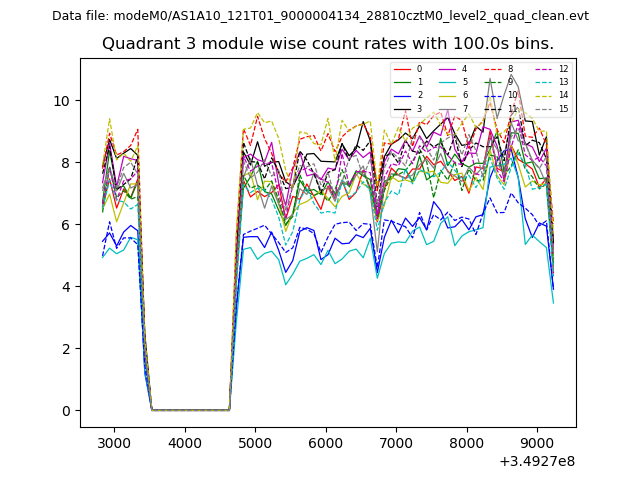
| Module-wise count rates for Quadrant C Data is divided into 100 sec bins |
 |
 |
| Module-wise count rates for Quadrant D Data is divided into 100 sec bins |
 |
 |
| Parameter | Plot |
|---|---|
| CZT HV Monitor | 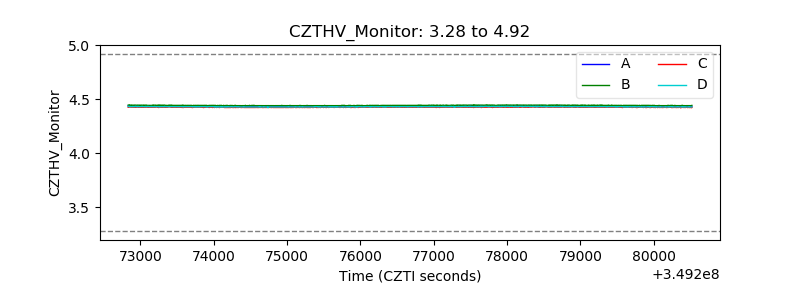 |
| D_VDD | 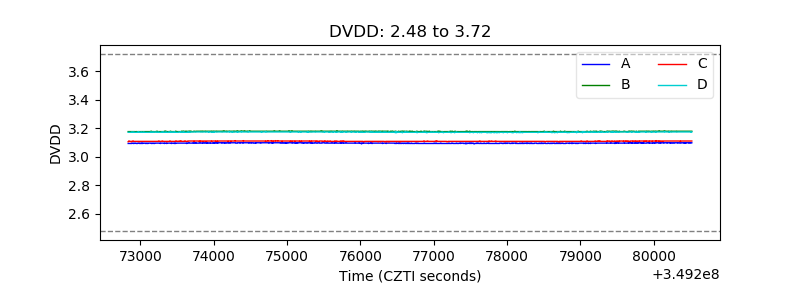 |
| Temperature 1 | 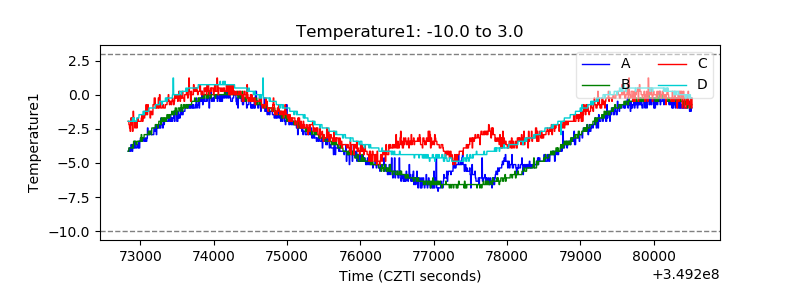 |
| Veto HV Monitor | 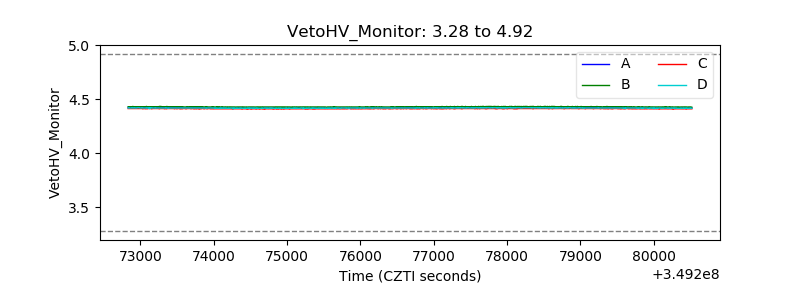 |
| Veto LLD | 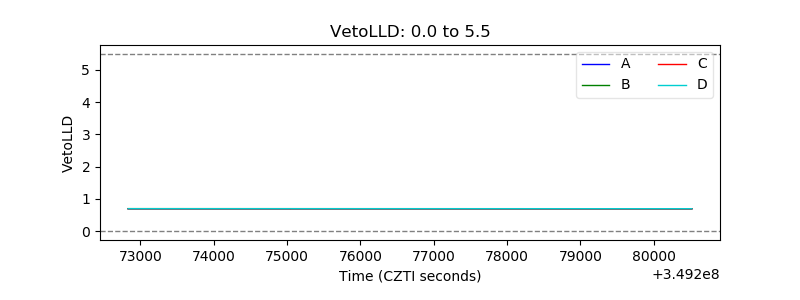 |
| Alpha Counter |  |
| _CPM_Rate | 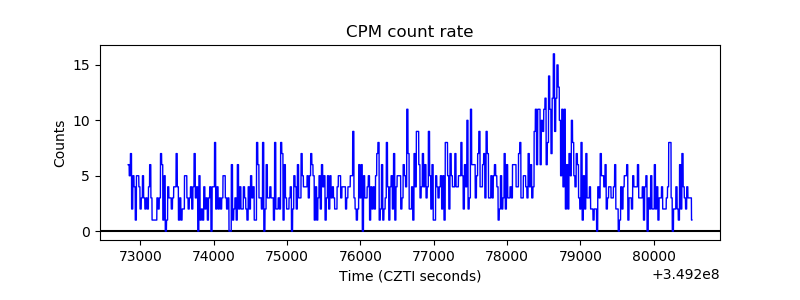 |
| CZT Counter | 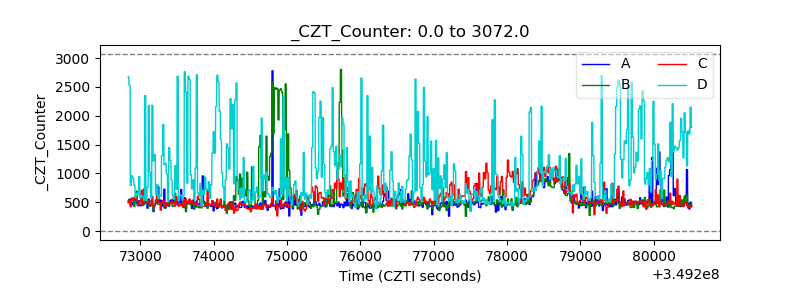 |
| +2.5 Volts monitor |  |
| +5 Volts monitor |  |
| _ROLL_ROT | 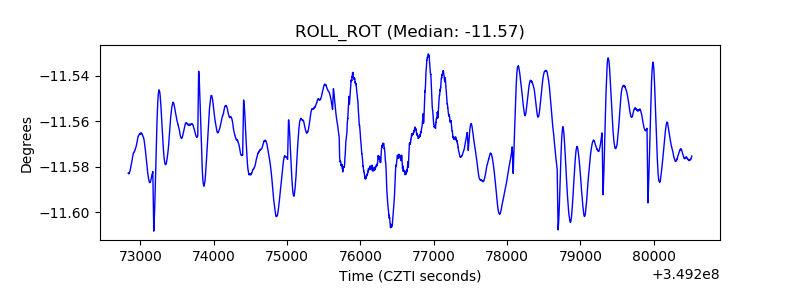 |
| _Roll_DEC | 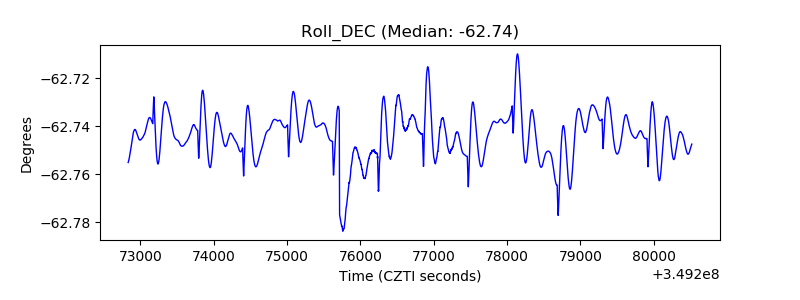 |
| _Roll_RA | 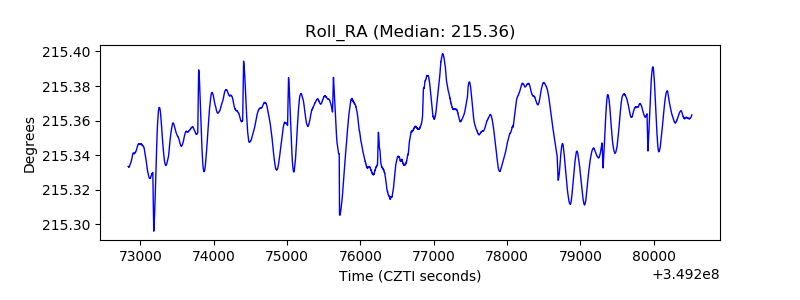 |
| Veto Counter | 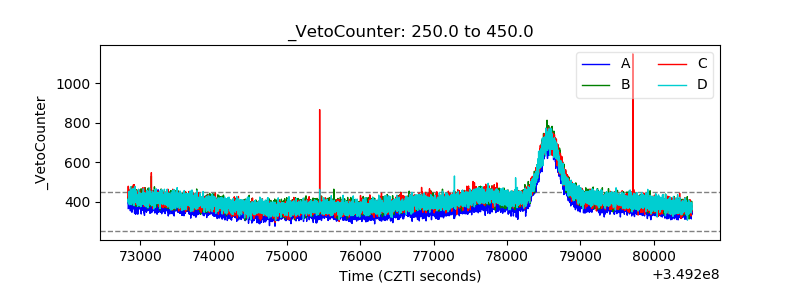 |