| Param | Original file | Final file |
|---|---|---|
| Filename | modeM0/AS1A10_121T01_9000004134_28815cztM0_level2.evt | modeM0/AS1A10_121T01_9000004134_28815cztM0_level2_quad_clean.evt |
| Size (bytes) | 731,427,840 | 110,903,040 |
| Size | 697.5 MB | 105.8 MB |
| Events in quadrant A | 3,857,130 | 764,015 |
| Events in quadrant B | 3,270,823 | 802,065 |
| Events in quadrant C | 3,983,320 | 745,162 |
| Events in quadrant D | 10,601,308 | 593,910 |
| Mode M9 | |||
|---|---|---|---|
| Quadrant | BADHDUFLAG | Total packets | Discarded packets |
| A | 0 | 12 | 0 |
| B | 0 | 13 | 0 |
| C | 0 | 13 | 0 |
| D | 0 | 13 | 0 |
| Mode M0 | |||
|---|---|---|---|
| Quadrant | BADHDUFLAG | Total packets | Discarded packets |
| A | 0 | 15610 | 4 |
| B | 0 | 13879 | 2 |
| C | 0 | 16374 | 2 |
| D | 0 | 35982 | 2 |
| Mode SS | |||
|---|---|---|---|
| Quadrant | BADHDUFLAG | Total packets | Discarded packets |
| A | 0 | 130 | 0 |
| B | 0 | 130 | 0 |
| C | 0 | 130 | 0 |
| D | 0 | 130 | 0 |
| Quadrant | Total seconds | Saturated seconds | Saturation percentage |
|---|---|---|---|
| A | 6491 | 221 | 3.404714% |
| B | 6491 | 53 | 0.816515% |
| C | 6491 | 216 | 3.327684% |
| D | 6491 | 2894 | 44.584810% |
Noise dominated data is calculated using 1-second bins in cleaned event files. If a bin has >2000 counts, and if more than 50% of those come from <1% of pixels, then it is considered to be noise-dominated and hence unusable.
| Quadrant | # 1 sec bins | Bins with >0 counts | Bins with >2000 counts | High rate bins dominated by noise | Noise dominated (total time) | Noise dominated (detector-on time) | Marked lightcurve |
|---|---|---|---|---|---|---|---|
| A | 7561 | 6491 | 212 | 212 | 2.80% | 3.27% | 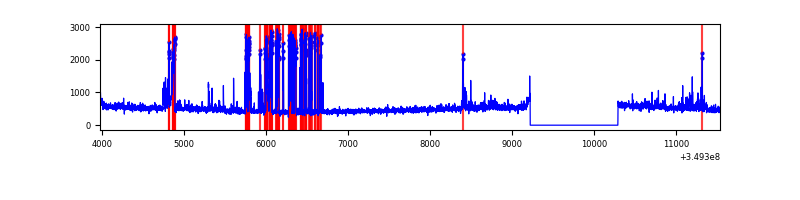 |
| B | 7561 | 6491 | 4 | 4 | 0.05% | 0.06% | 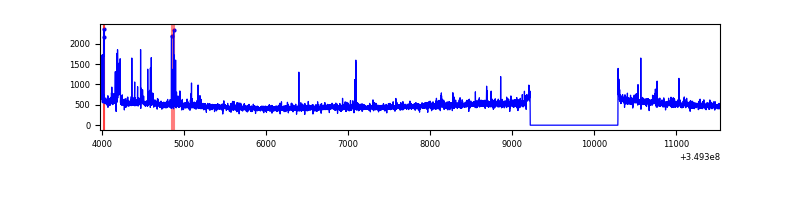 |
| C | 7561 | 6491 | 1 | 1 | 0.01% | 0.02% | 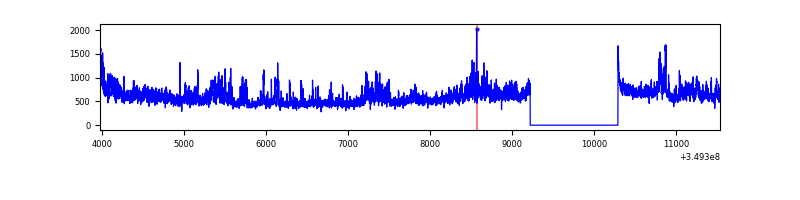 |
| D | 7561 | 6491 | 2618 | 2618 | 34.63% | 40.33% | 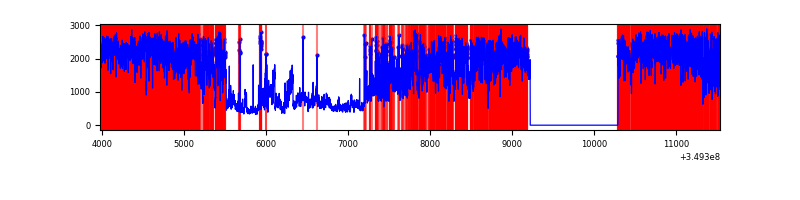 |
Top three noisy pixels from each quadrant. If the there are fewer than three noisy pixels in the level2.evt file, extra rows are filled as -1
| Pixel properties | Quadrant properties | ||||||
|---|---|---|---|---|---|---|---|
| Quadrant | DetID | PixID | Counts | Sigma | Mean | Median | Sigma |
| A | 6 | 16 | 540116 | 3409.01 | 787 | 769 | 158.2 |
| A | 14 | 235 | 132729 | 834.07 | 787 | 769 | 158.2 |
| A | 15 | 174 | 106571 | 668.73 | 787 | 769 | 158.2 |
| B | 5 | 172 | 74509 | 492.05 | 797 | 780 | 149.8 |
| B | 0 | 244 | 23110 | 149.02 | 797 | 780 | 149.8 |
| B | 12 | 111 | 17727 | 113.1 | 797 | 780 | 149.8 |
| C | 3 | 233 | 799426 | 4488.95 | 756 | 759 | 177.9 |
| C | 14 | 238 | 168259 | 941.44 | 756 | 759 | 177.9 |
| C | 14 | 254 | 67644 | 375.93 | 756 | 759 | 177.9 |
| D | 8 | 195 | 5427908 | 34887.08 | 642 | 626 | 155.6 |
| D | 13 | 104 | 1168791 | 7509.07 | 642 | 626 | 155.6 |
| D | 1 | 52 | 1082393 | 6953.7 | 642 | 626 | 155.6 |
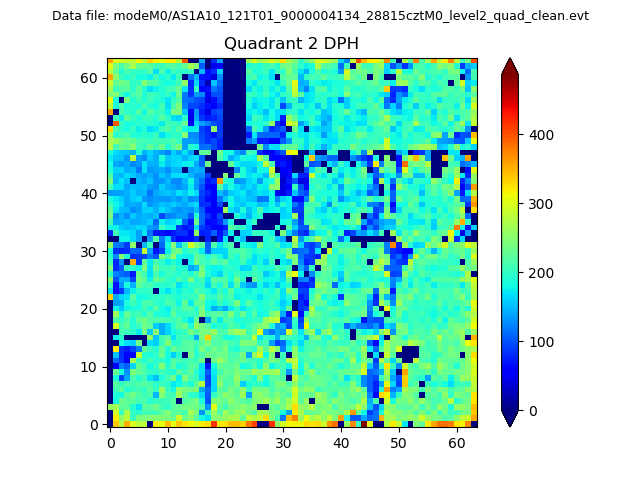
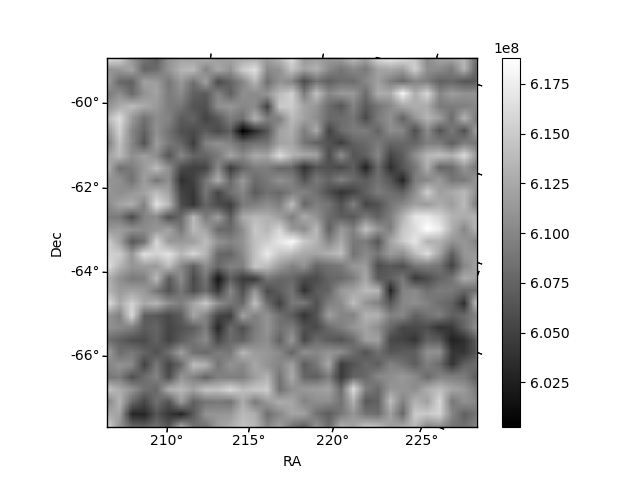
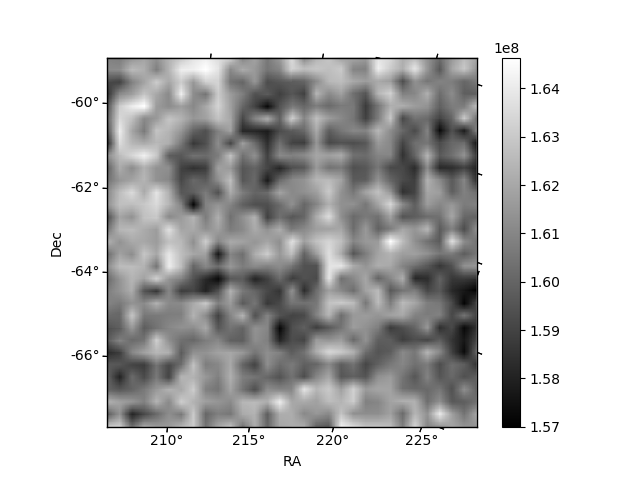
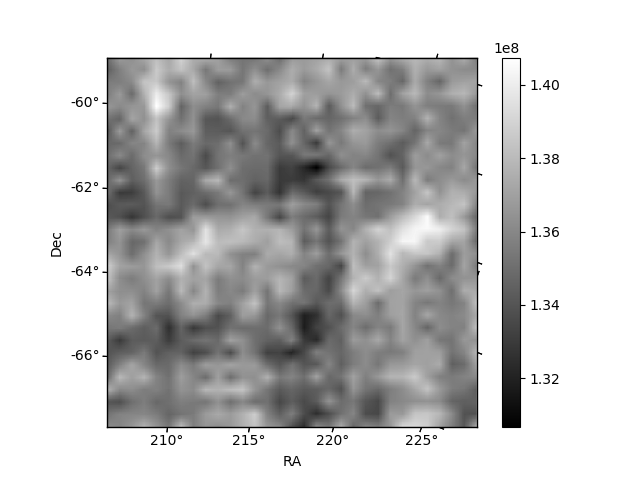
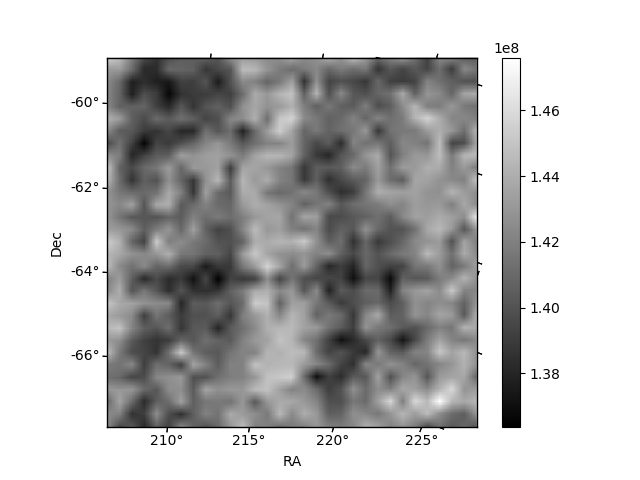
Histogram calculated using DETX and DETY for each event in the final _common_clean file
| Quadrant A | 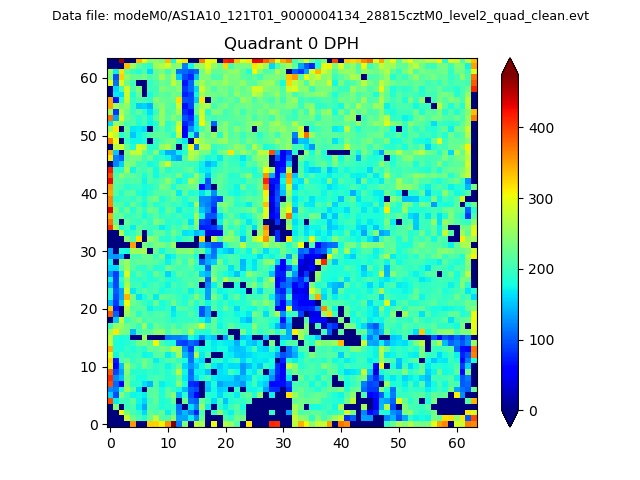 |
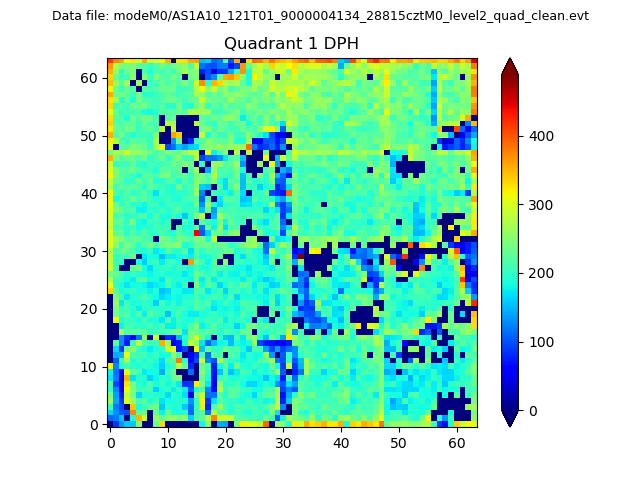 |
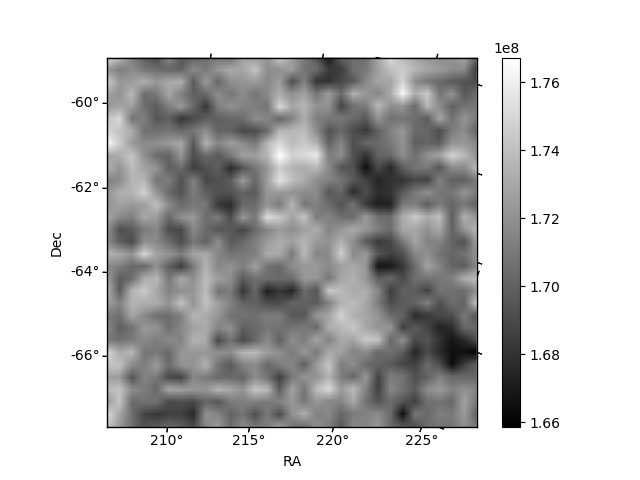
Quadrant B |
|---|---|---|---|
| Quadrant D | 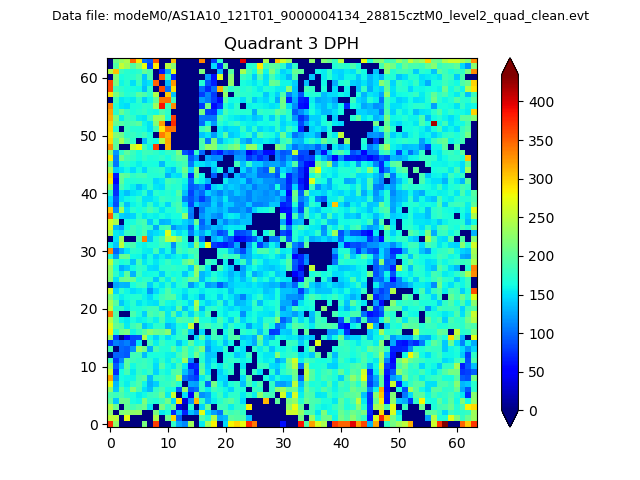 |
 |
Quadrant C |
| Plot type | Count rate plots | Images |
|---|---|---|
| Comparison with Poisson distribution Blue bars denote a histogram of data divided into 1 sec bins. Red curve is a Poisson curve with rate = median count rate of data. |
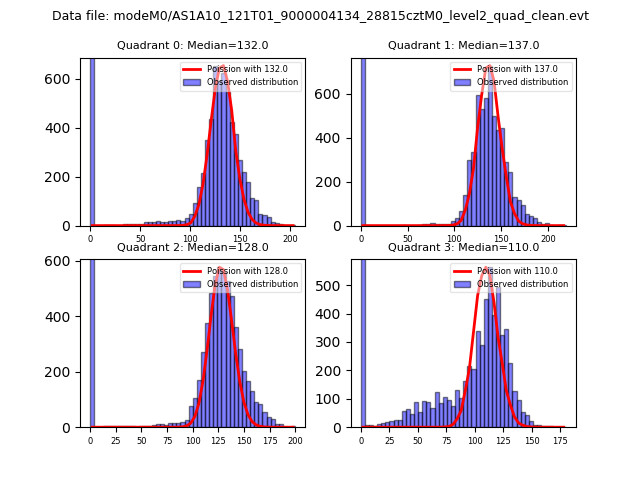 |
 |
| Quadrant-wise count rates Data is divided into 100 sec bins |
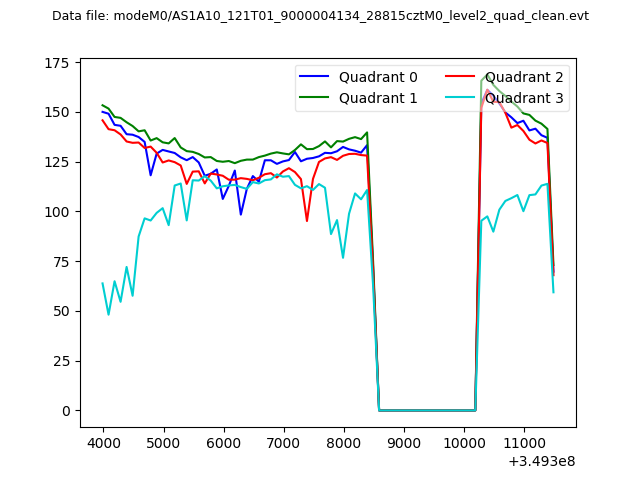 |
|
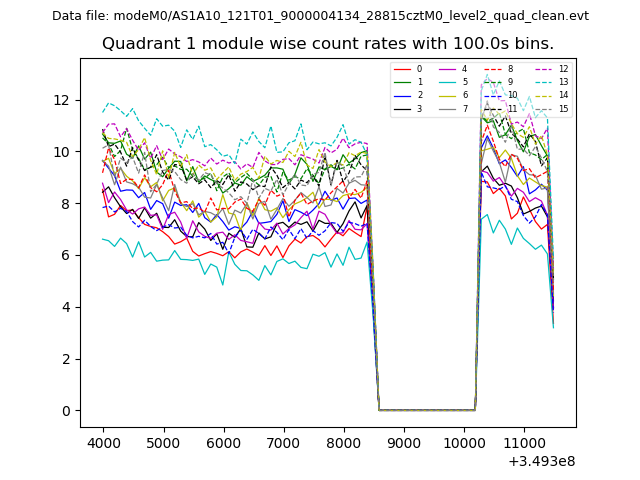
| Module-wise count rates for Quadrant A Data is divided into 100 sec bins |
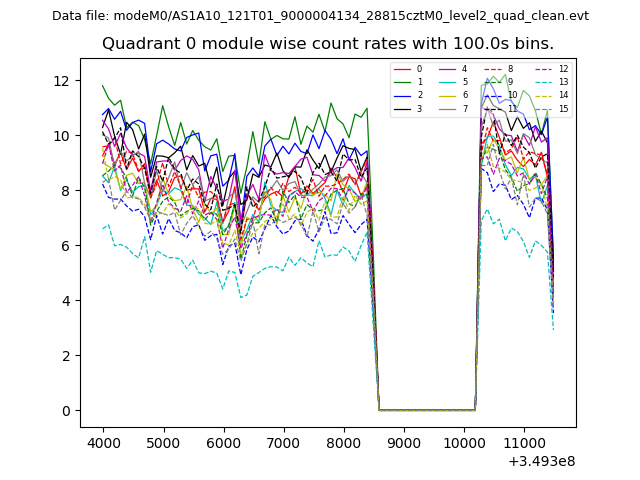 |
 |
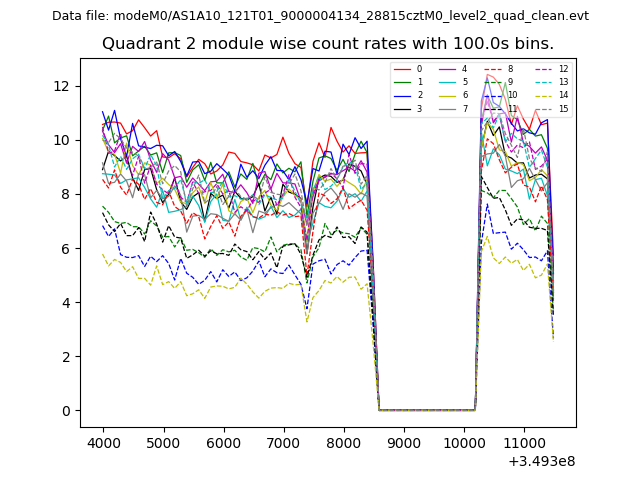
| Module-wise count rates for Quadrant B Data is divided into 100 sec bins |
 |
 |
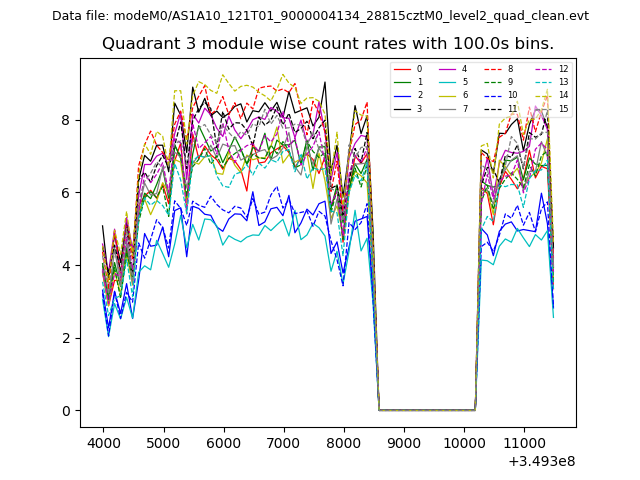
| Module-wise count rates for Quadrant C Data is divided into 100 sec bins |
 |
 |
| Module-wise count rates for Quadrant D Data is divided into 100 sec bins |
 |
 |
| Parameter | Plot |
|---|---|
| CZT HV Monitor | 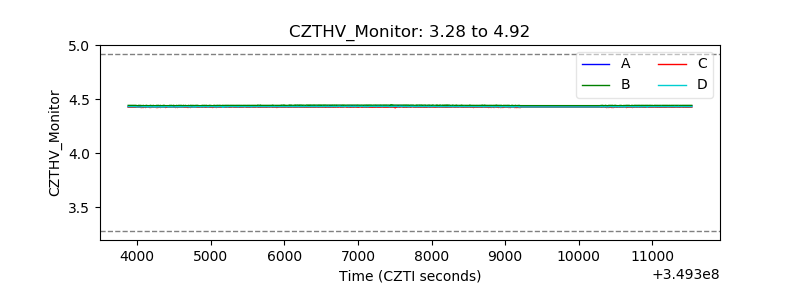 |
| D_VDD | 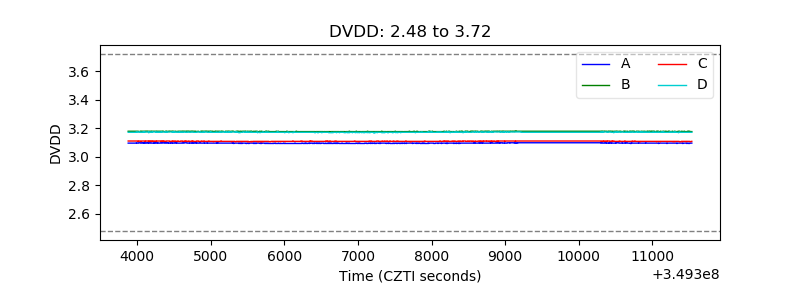 |
| Temperature 1 | 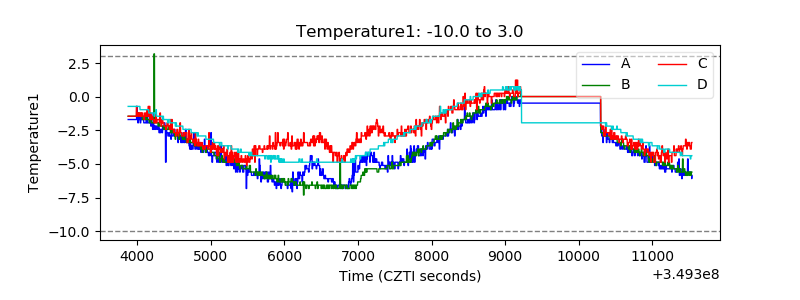 |
| Veto HV Monitor | 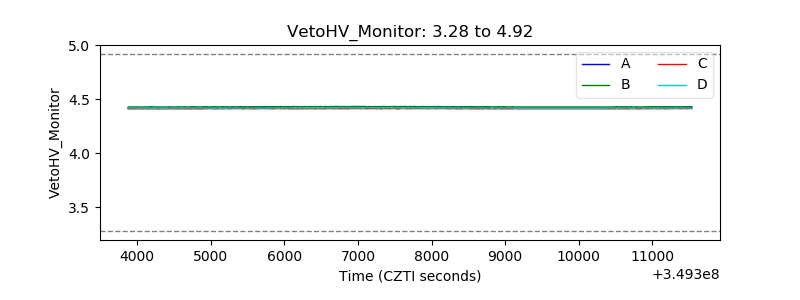 |
| Veto LLD | 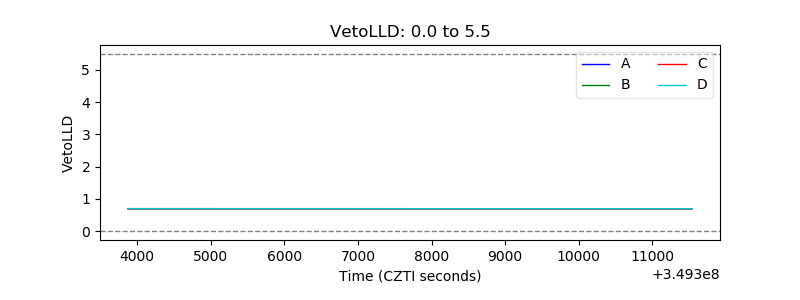 |
| Alpha Counter | 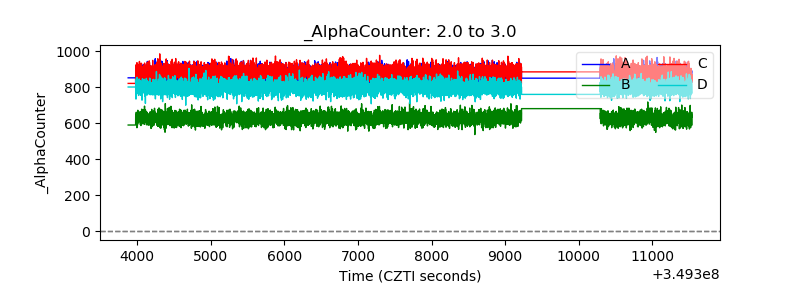 |
| _CPM_Rate | 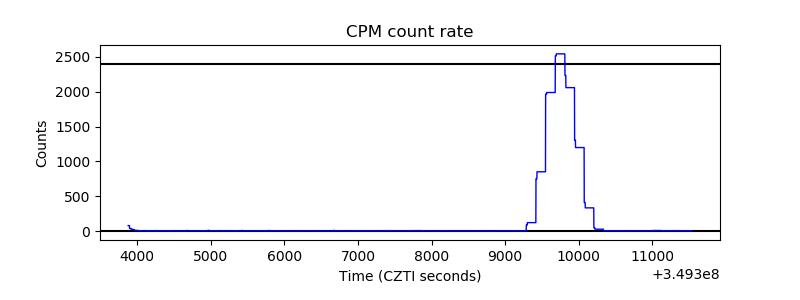 |
| CZT Counter | 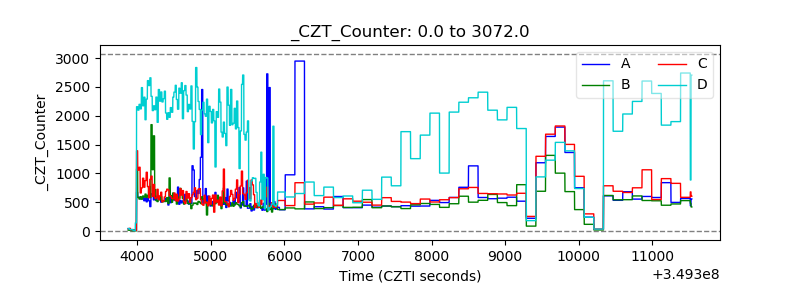 |
| +2.5 Volts monitor | 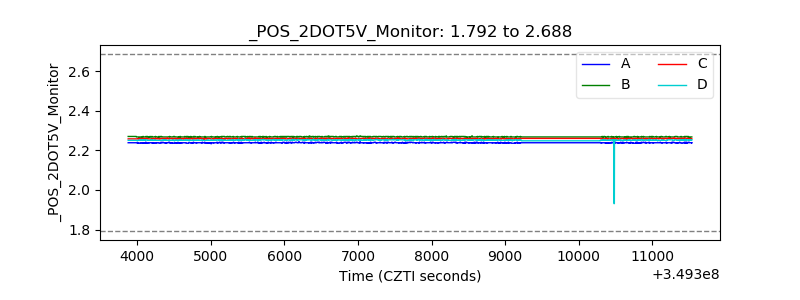 |
| +5 Volts monitor | 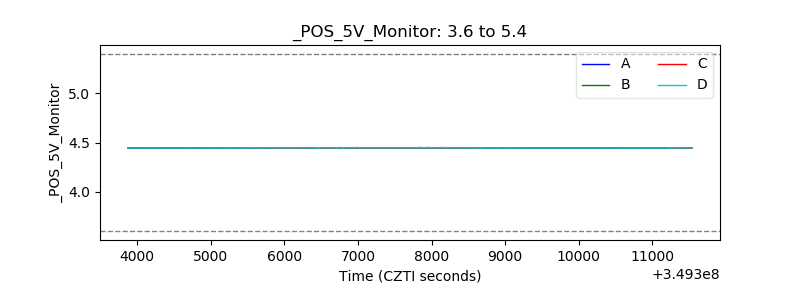 |
| _ROLL_ROT | 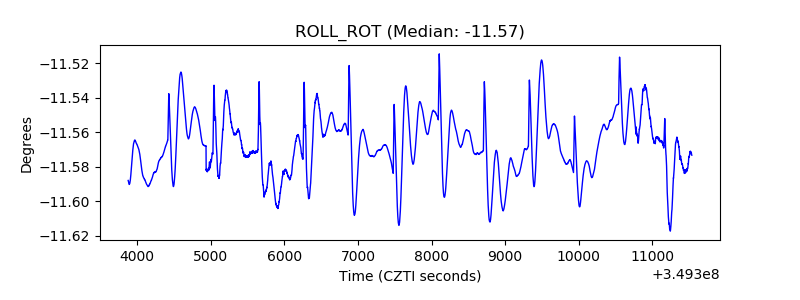 |
| _Roll_DEC | 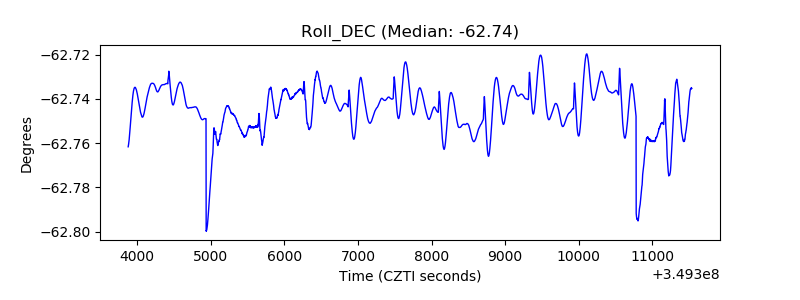 |
| _Roll_RA | 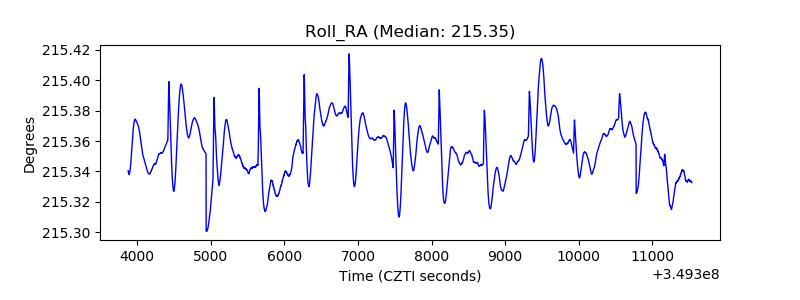 |
| Veto Counter | 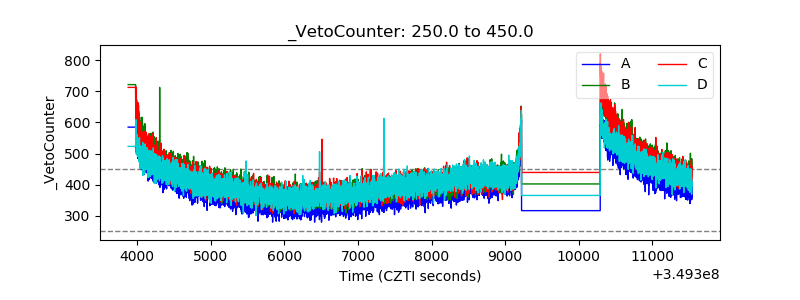 |