| Param | Original file | Final file |
|---|---|---|
| Filename | modeM0/AS1A10_121T01_9000004134_28817cztM0_level2.evt | modeM0/AS1A10_121T01_9000004134_28817cztM0_level2_quad_clean.evt |
| Size (bytes) | 740,983,680 | 117,290,880 |
| Size | 706.7 MB | 111.9 MB |
| Events in quadrant A | 3,560,732 | 803,711 |
| Events in quadrant B | 3,502,332 | 834,797 |
| Events in quadrant C | 4,528,637 | 778,304 |
| Events in quadrant D | 10,381,450 | 652,511 |
| Mode M9 | |||
|---|---|---|---|
| Quadrant | BADHDUFLAG | Total packets | Discarded packets |
| A | 0 | 22 | 0 |
| B | 0 | 22 | 0 |
| C | 0 | 22 | 0 |
| D | 0 | 22 | 0 |
| Mode M0 | |||
|---|---|---|---|
| Quadrant | BADHDUFLAG | Total packets | Discarded packets |
| A | 0 | 14968 | 2 |
| B | 0 | 14803 | 2 |
| C | 0 | 18282 | 2 |
| D | 0 | 35766 | 2 |
| Mode SS | |||
|---|---|---|---|
| Quadrant | BADHDUFLAG | Total packets | Discarded packets |
| A | 0 | 144 | 0 |
| B | 0 | 144 | 0 |
| C | 0 | 144 | 0 |
| D | 0 | 144 | 0 |
| Quadrant | Total seconds | Saturated seconds | Saturation percentage |
|---|---|---|---|
| A | 6915 | 47 | 0.679682% |
| B | 6916 | 68 | 0.983227% |
| C | 6916 | 246 | 3.556969% |
| D | 6916 | 2159 | 31.217467% |
Noise dominated data is calculated using 1-second bins in cleaned event files. If a bin has >2000 counts, and if more than 50% of those come from <1% of pixels, then it is considered to be noise-dominated and hence unusable.
| Quadrant | # 1 sec bins | Bins with >0 counts | Bins with >2000 counts | High rate bins dominated by noise | Noise dominated (total time) | Noise dominated (detector-on time) | Marked lightcurve |
|---|---|---|---|---|---|---|---|
| A | 9160 | 6915 | 7 | 7 | 0.08% | 0.10% | 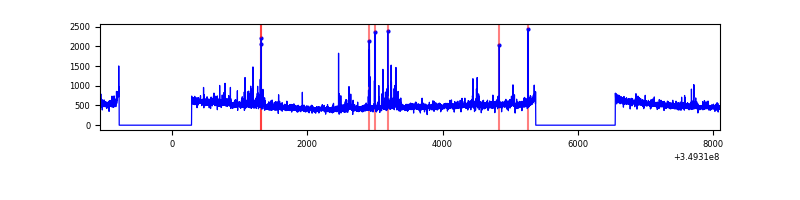 |
| B | 9161 | 6916 | 4 | 4 | 0.04% | 0.06% | 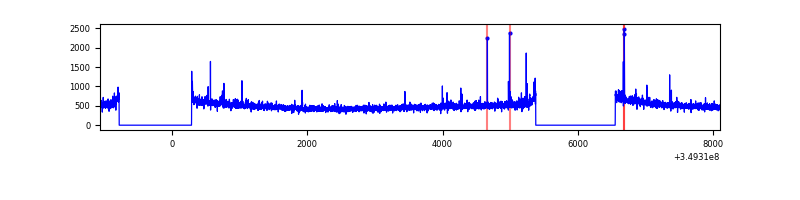 |
| C | 9161 | 6916 | 1 | 1 | 0.01% | 0.01% | 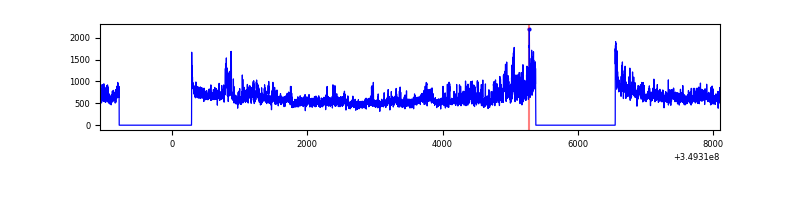 |
| D | 9161 | 6916 | 1906 | 1906 | 20.81% | 27.56% | 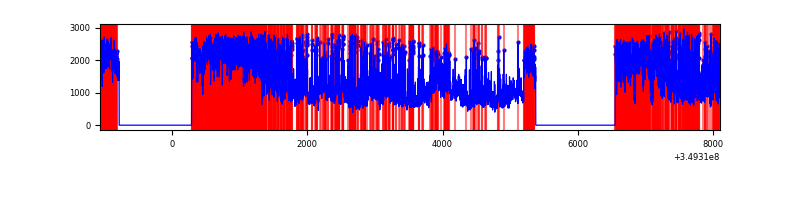 |
Top three noisy pixels from each quadrant. If the there are fewer than three noisy pixels in the level2.evt file, extra rows are filled as -1
| Pixel properties | Quadrant properties | ||||||
|---|---|---|---|---|---|---|---|
| Quadrant | DetID | PixID | Counts | Sigma | Mean | Median | Sigma |
| A | 14 | 235 | 168500 | 970.2 | 867 | 851 | 172.8 |
| A | 14 | 239 | 20973 | 116.45 | 867 | 851 | 172.8 |
| A | 13 | 254 | 13665 | 74.16 | 867 | 851 | 172.8 |
| B | 5 | 172 | 31137 | 184.84 | 876 | 855 | 163.8 |
| B | 12 | 111 | 19319 | 112.71 | 876 | 855 | 163.8 |
| B | 11 | 111 | 16941 | 98.19 | 876 | 855 | 163.8 |
| C | 3 | 233 | 1023884 | 5267.89 | 838 | 843 | 194.2 |
| C | 14 | 238 | 173740 | 890.29 | 838 | 843 | 194.2 |
| C | 14 | 254 | 57627 | 292.4 | 838 | 843 | 194.2 |
| D | 8 | 195 | 5182139 | 28798.48 | 758 | 739 | 179.9 |
| D | 1 | 52 | 1134823 | 6303.3 | 758 | 739 | 179.9 |
| D | 13 | 104 | 954623 | 5301.74 | 758 | 739 | 179.9 |
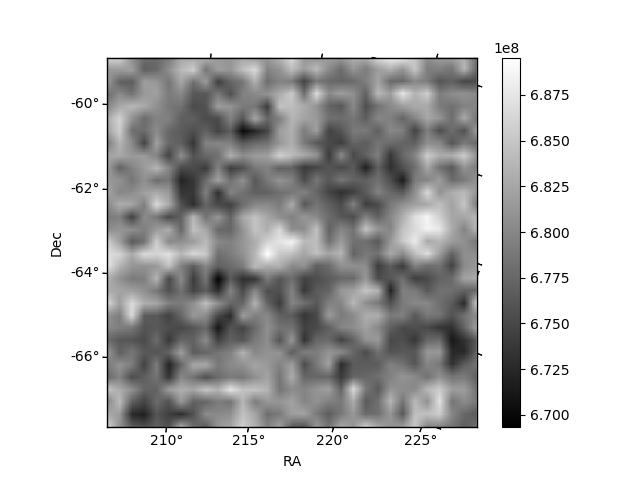
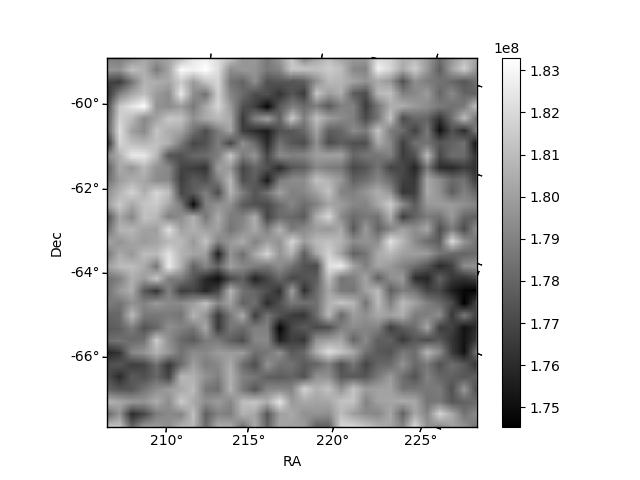
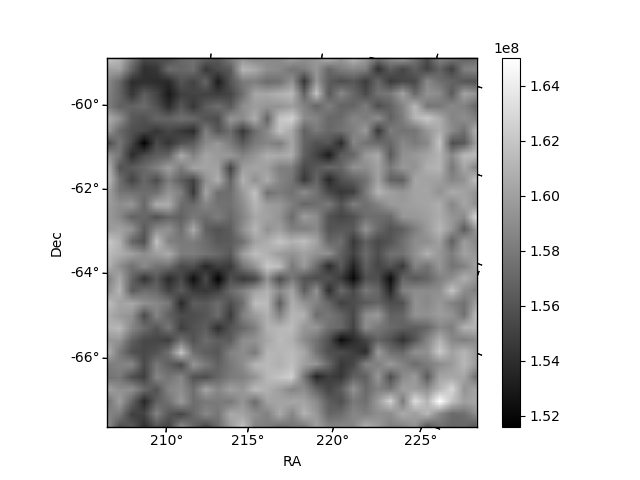
Histogram calculated using DETX and DETY for each event in the final _common_clean file
| Quadrant A | 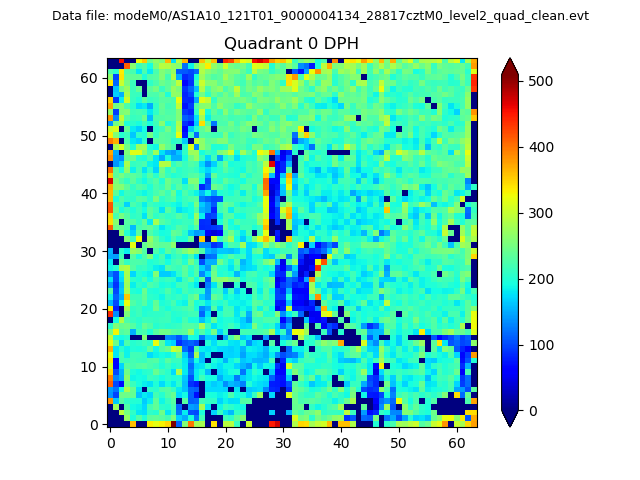 |
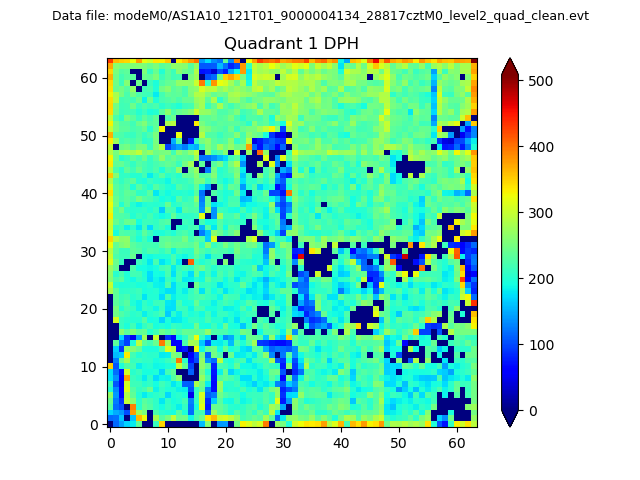 |
Quadrant B |
|---|---|---|---|
| Quadrant D | 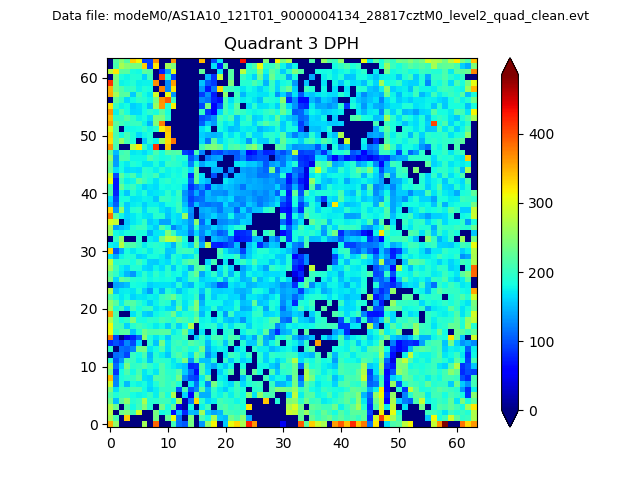 |
 |
Quadrant C |
| Plot type | Count rate plots | Images |
|---|---|---|
| Comparison with Poisson distribution Blue bars denote a histogram of data divided into 1 sec bins. Red curve is a Poisson curve with rate = median count rate of data. |
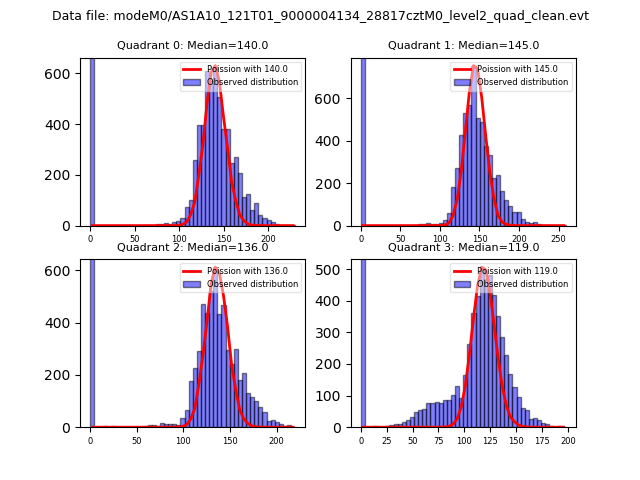 |
 |
| Quadrant-wise count rates Data is divided into 100 sec bins |
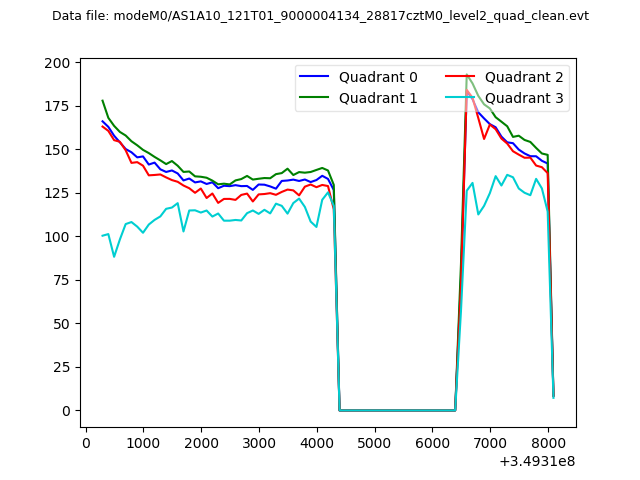 |
|
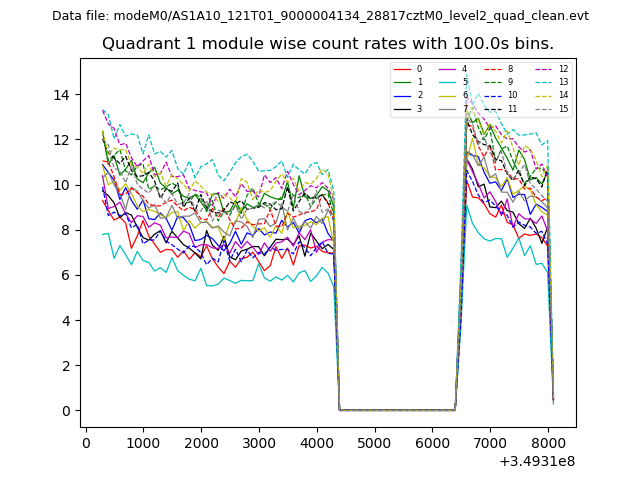
| Module-wise count rates for Quadrant A Data is divided into 100 sec bins |
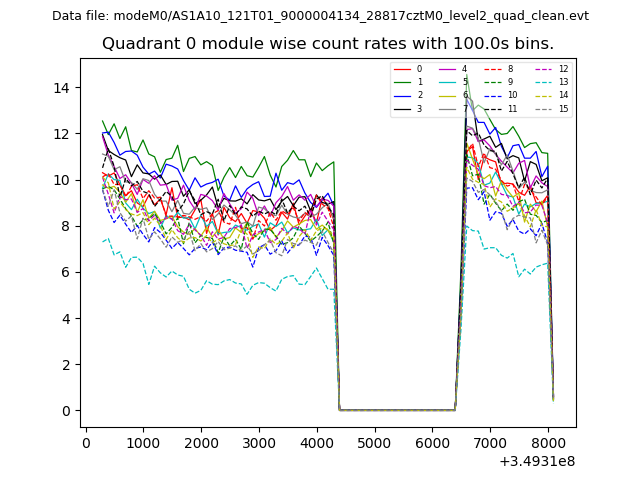 |
 |
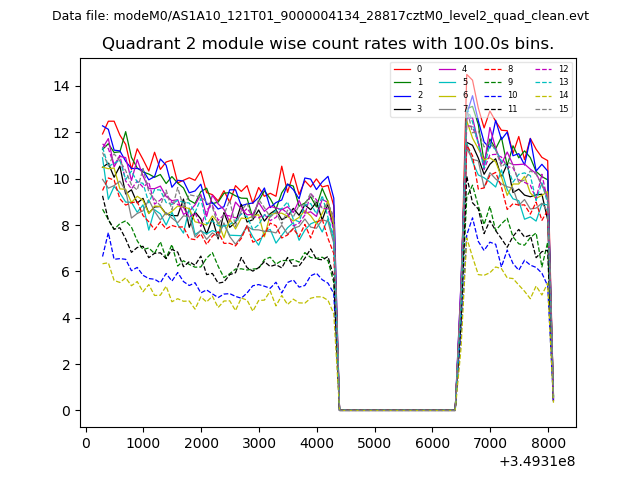
| Module-wise count rates for Quadrant B Data is divided into 100 sec bins |
 |
 |
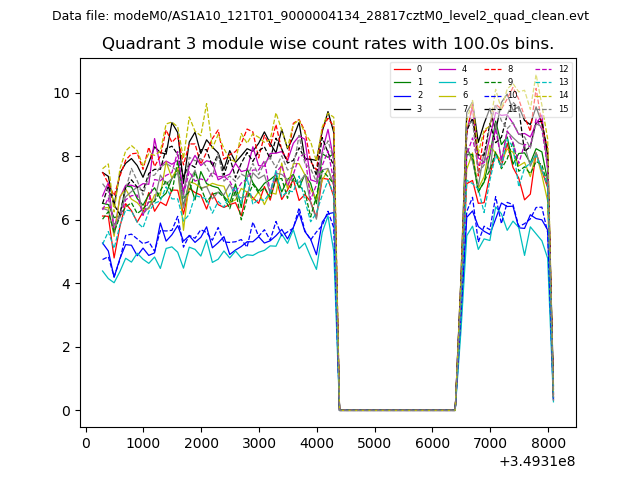
| Module-wise count rates for Quadrant C Data is divided into 100 sec bins |
 |
 |
| Module-wise count rates for Quadrant D Data is divided into 100 sec bins |
 |
 |
| Parameter | Plot |
|---|---|
| CZT HV Monitor | 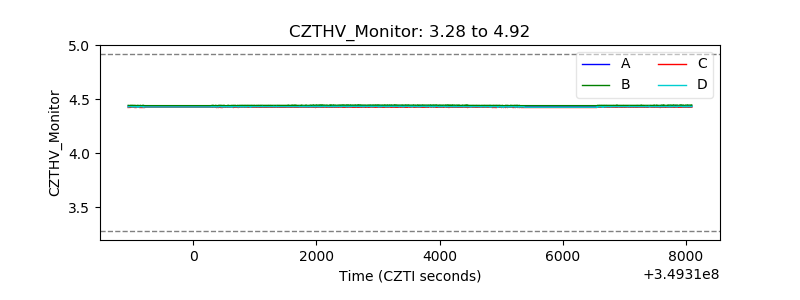 |
| D_VDD | 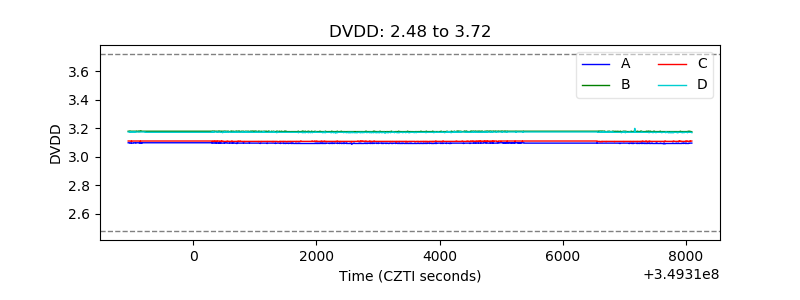 |
| Temperature 1 | 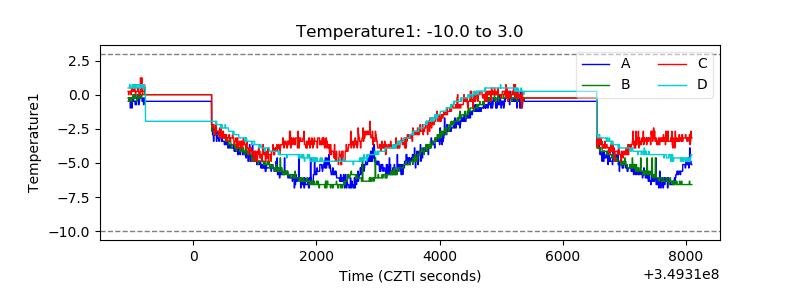 |
| Veto HV Monitor | 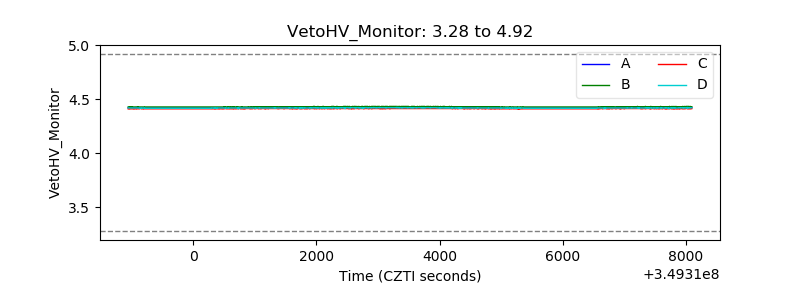 |
| Veto LLD | 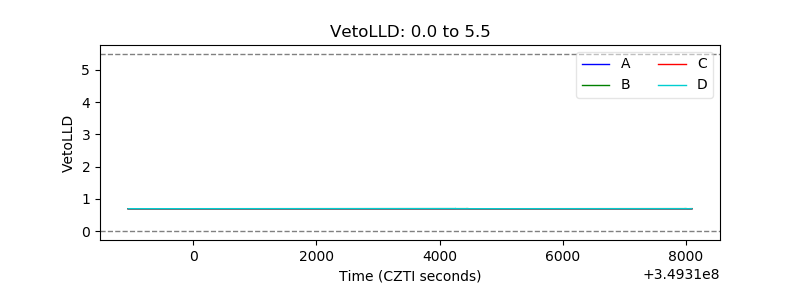 |
| Alpha Counter | 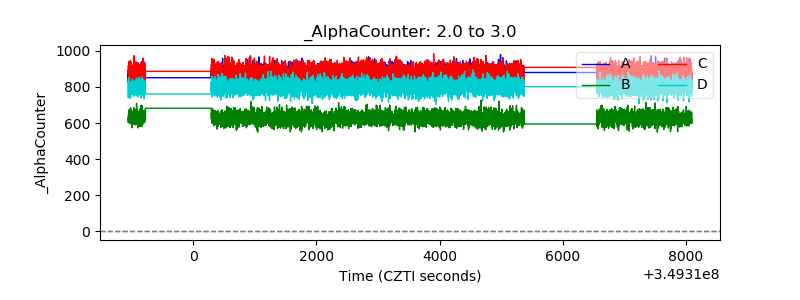 |
| _CPM_Rate | 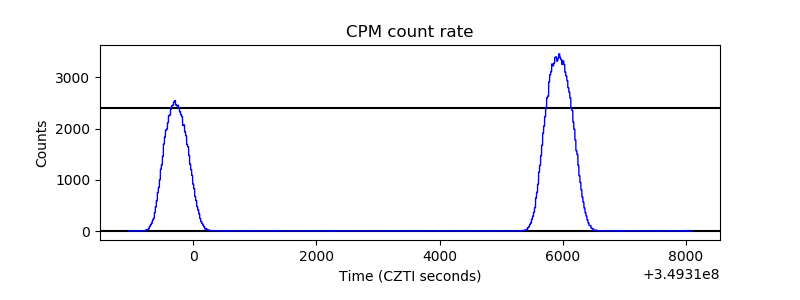 |
| CZT Counter | 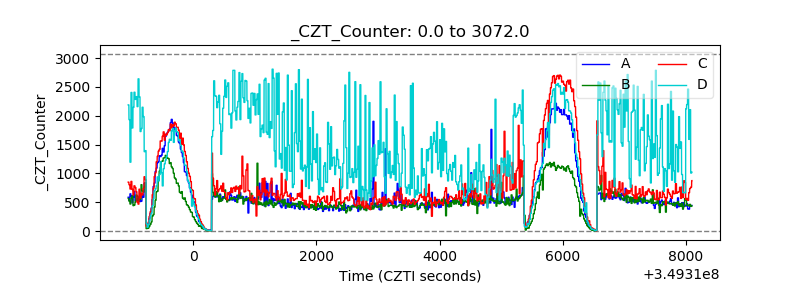 |
| +2.5 Volts monitor |  |
| +5 Volts monitor | 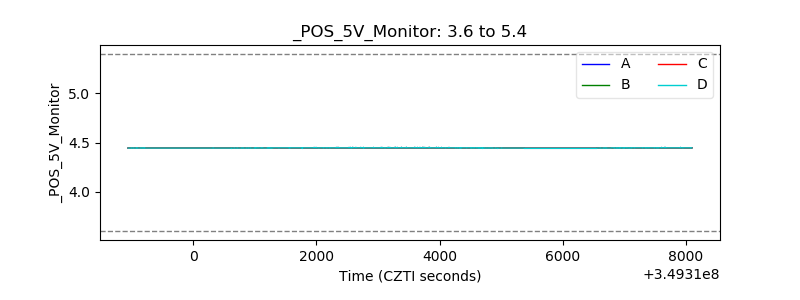 |
| _ROLL_ROT | 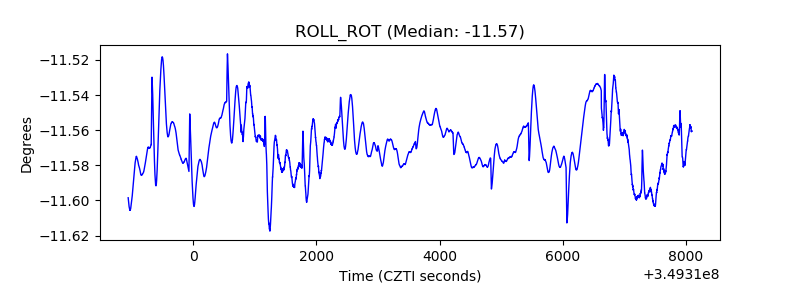 |
| _Roll_DEC | 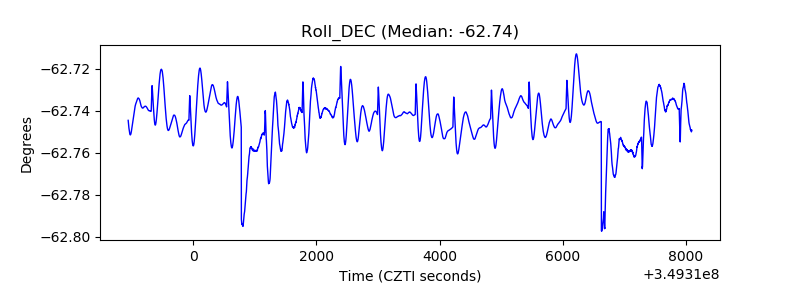 |
| _Roll_RA | 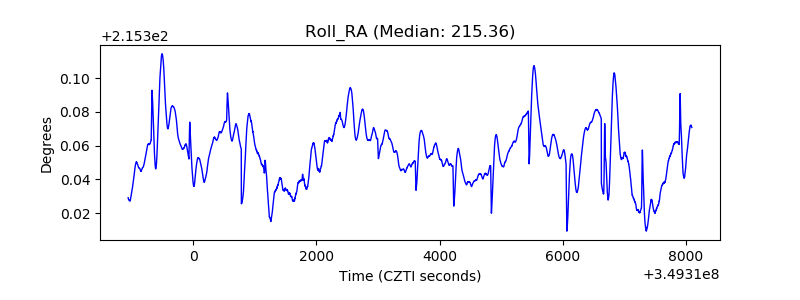 |
| Veto Counter | 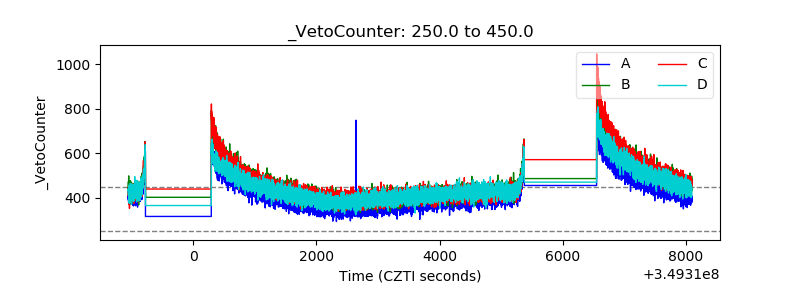 |