| Param | Original file | Final file |
|---|---|---|
| Filename | modeM0/AS1A10_121T01_9000004134_28819cztM0_level2.evt | modeM0/AS1A10_121T01_9000004134_28819cztM0_level2_quad_clean.evt |
| Size (bytes) | 644,641,920 | 109,811,520 |
| Size | 614.8 MB | 104.7 MB |
| Events in quadrant A | 3,055,204 | 741,952 |
| Events in quadrant B | 3,232,874 | 779,031 |
| Events in quadrant C | 3,815,411 | 739,707 |
| Events in quadrant D | 9,013,177 | 644,999 |
| Mode M9 | |||
|---|---|---|---|
| Quadrant | BADHDUFLAG | Total packets | Discarded packets |
| A | 0 | 13 | 0 |
| B | 0 | 13 | 0 |
| C | 0 | 13 | 0 |
| D | 0 | 13 | 0 |
| Mode M0 | |||
|---|---|---|---|
| Quadrant | BADHDUFLAG | Total packets | Discarded packets |
| A | 0 | 12607 | 1 |
| B | 0 | 13193 | 1 |
| C | 0 | 15464 | 1 |
| D | 0 | 31033 | 1 |
| Mode SS | |||
|---|---|---|---|
| Quadrant | BADHDUFLAG | Total packets | Discarded packets |
| A | 0 | 122 | 0 |
| B | 0 | 122 | 0 |
| C | 0 | 122 | 0 |
| D | 0 | 122 | 0 |
| Quadrant | Total seconds | Saturated seconds | Saturation percentage |
|---|---|---|---|
| A | 6011 | 21 | 0.349360% |
| B | 6012 | 44 | 0.731870% |
| C | 6012 | 127 | 2.112442% |
| D | 6011 | 1860 | 30.943271% |
Noise dominated data is calculated using 1-second bins in cleaned event files. If a bin has >2000 counts, and if more than 50% of those come from <1% of pixels, then it is considered to be noise-dominated and hence unusable.
| Quadrant | # 1 sec bins | Bins with >0 counts | Bins with >2000 counts | High rate bins dominated by noise | Noise dominated (total time) | Noise dominated (detector-on time) | Marked lightcurve |
|---|---|---|---|---|---|---|---|
| A | 7346 | 6012 | 2 | 2 | 0.03% | 0.03% | 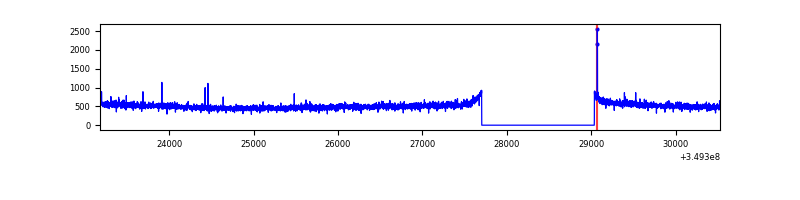 |
| B | 7347 | 6012 | 1 | 1 | 0.01% | 0.02% | 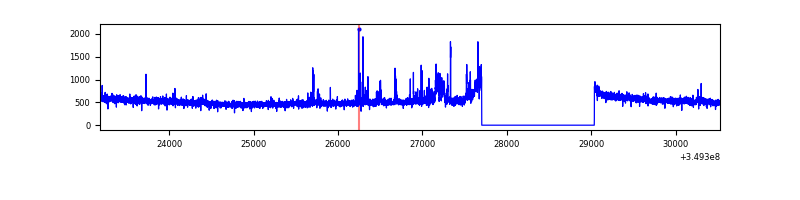 |
| C | 7347 | 6012 | 0 | 0 | 0.00% | 0.00% | 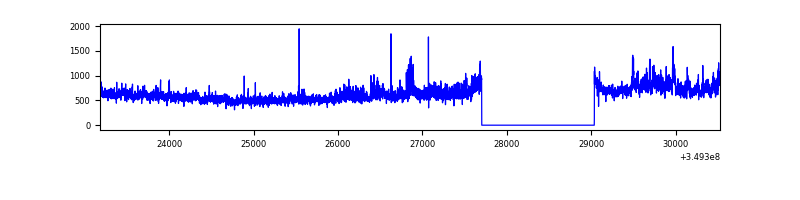 |
| D | 7346 | 6011 | 1862 | 1862 | 25.35% | 30.98% | 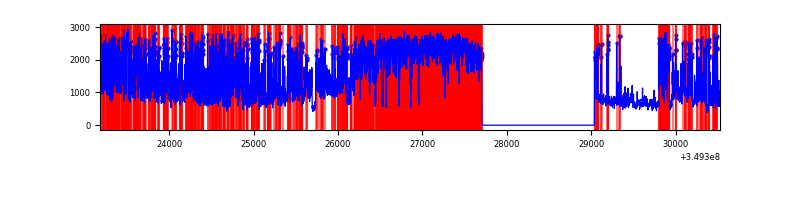 |
Top three noisy pixels from each quadrant. If the there are fewer than three noisy pixels in the level2.evt file, extra rows are filled as -1
| Pixel properties | Quadrant properties | ||||||
|---|---|---|---|---|---|---|---|
| Quadrant | DetID | PixID | Counts | Sigma | Mean | Median | Sigma |
| A | 13 | 254 | 12115 | 73.26 | 783 | 771 | 154.8 |
| A | 13 | 170 | 8194 | 47.94 | 783 | 771 | 154.8 |
| A | 3 | 137 | 6672 | 38.11 | 783 | 771 | 154.8 |
| B | 10 | 245 | 66414 | 451.99 | 793 | 775 | 145.2 |
| B | 5 | 172 | 19413 | 128.34 | 793 | 775 | 145.2 |
| B | 12 | 111 | 16296 | 106.88 | 793 | 775 | 145.2 |
| C | 3 | 233 | 604561 | 3373.67 | 778 | 786 | 179.0 |
| C | 14 | 238 | 137058 | 761.44 | 778 | 786 | 179.0 |
| C | 1 | 16 | 18625 | 99.68 | 778 | 786 | 179.0 |
| D | 8 | 195 | 5283826 | 31377.33 | 703 | 685 | 168.4 |
| D | 1 | 52 | 639708 | 3795.25 | 703 | 685 | 168.4 |
| D | 7 | 80 | 273372 | 1619.53 | 703 | 685 | 168.4 |
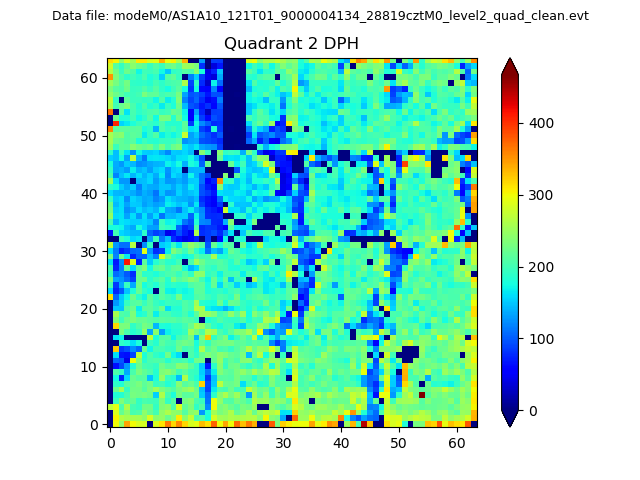
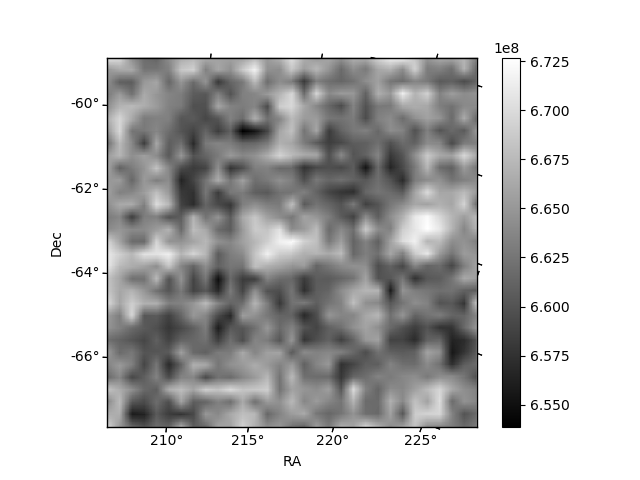
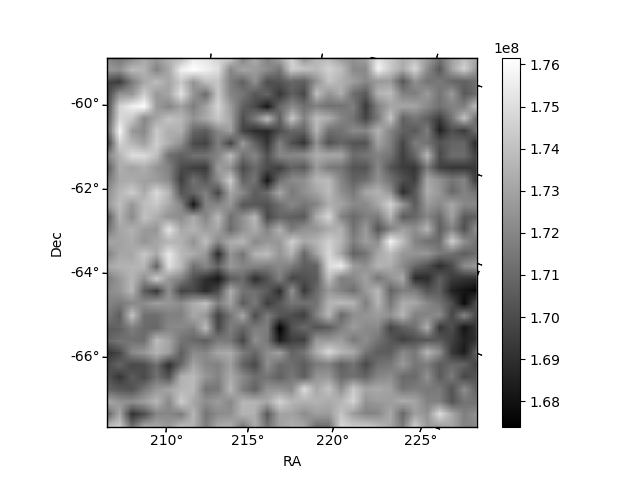
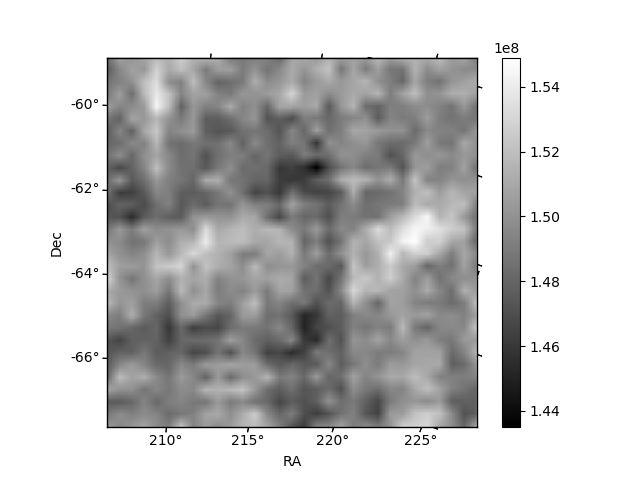
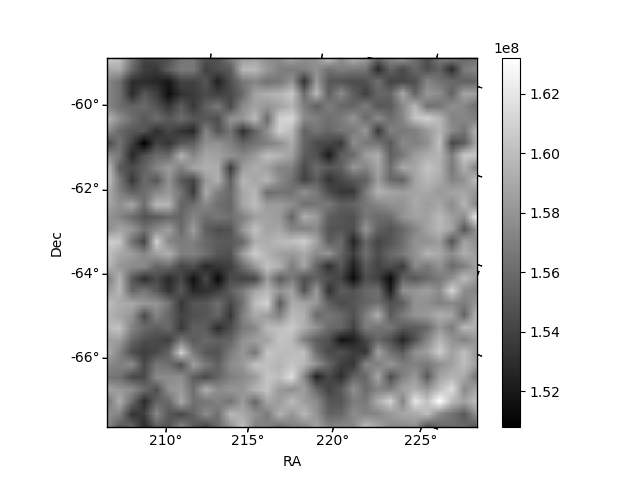
Histogram calculated using DETX and DETY for each event in the final _common_clean file
| Quadrant A | 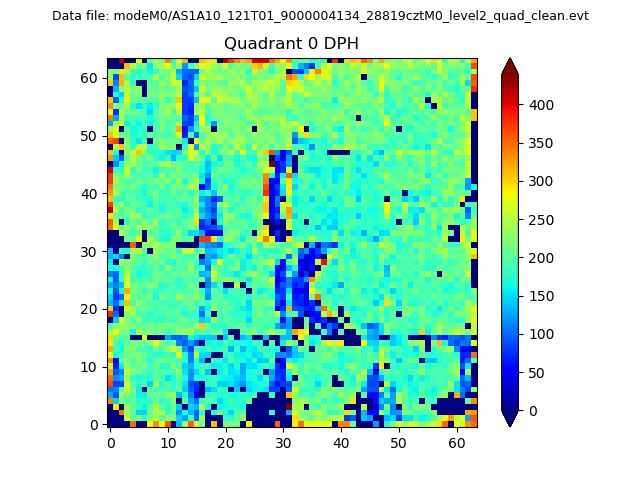 |
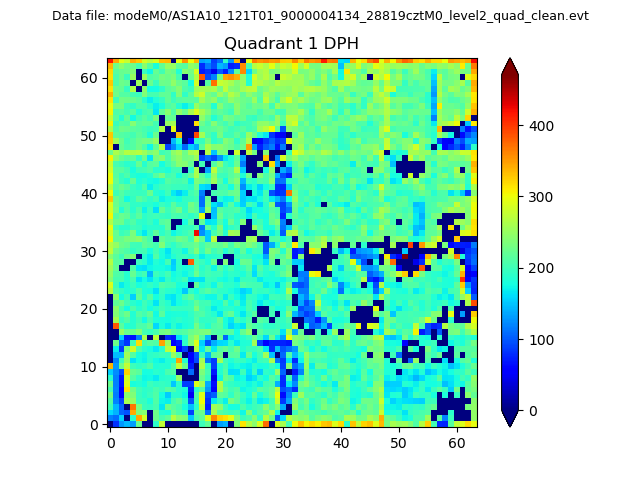 |
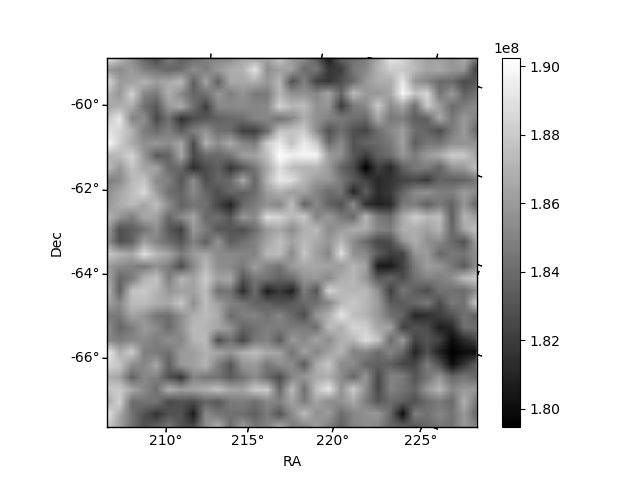
Quadrant B |
|---|---|---|---|
| Quadrant D | 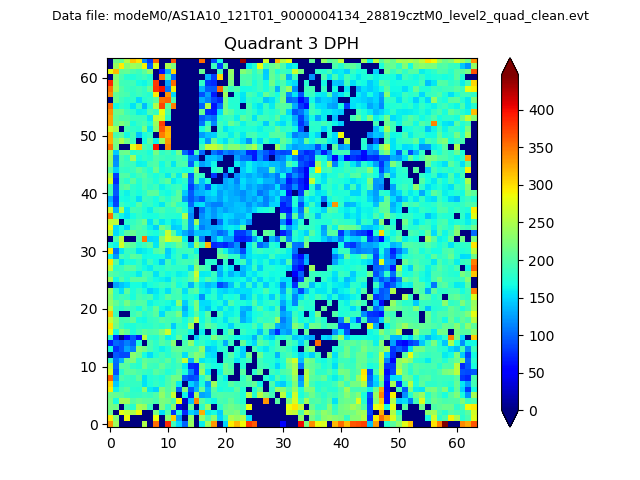 |
 |
Quadrant C |
| Plot type | Count rate plots | Images |
|---|---|---|
| Comparison with Poisson distribution Blue bars denote a histogram of data divided into 1 sec bins. Red curve is a Poisson curve with rate = median count rate of data. |
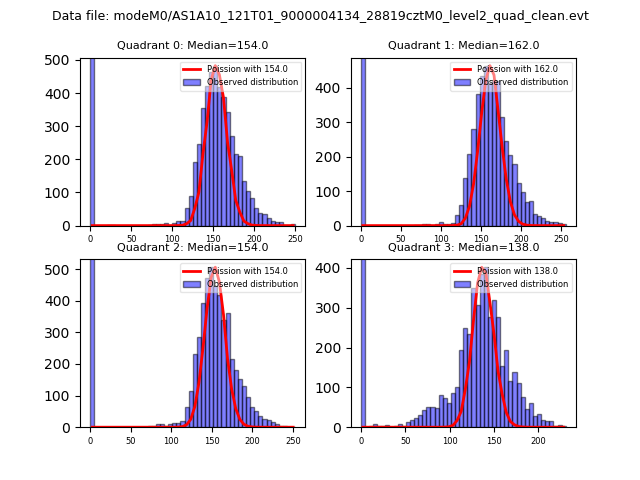 |
 |
| Quadrant-wise count rates Data is divided into 100 sec bins |
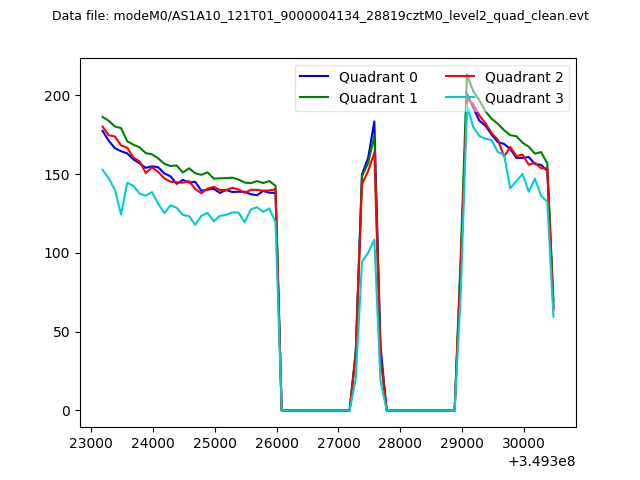 |
|
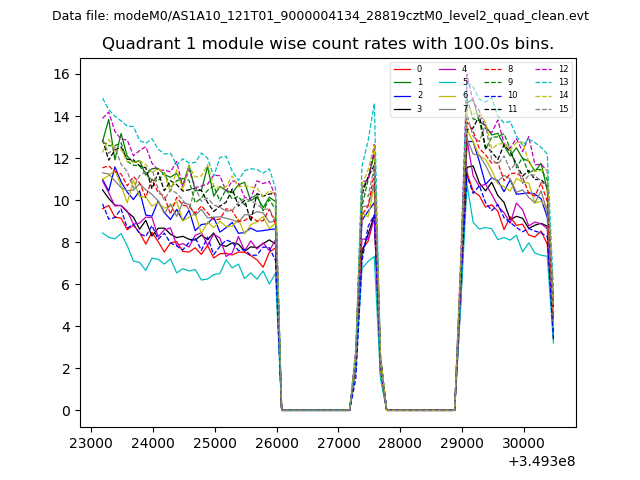
| Module-wise count rates for Quadrant A Data is divided into 100 sec bins |
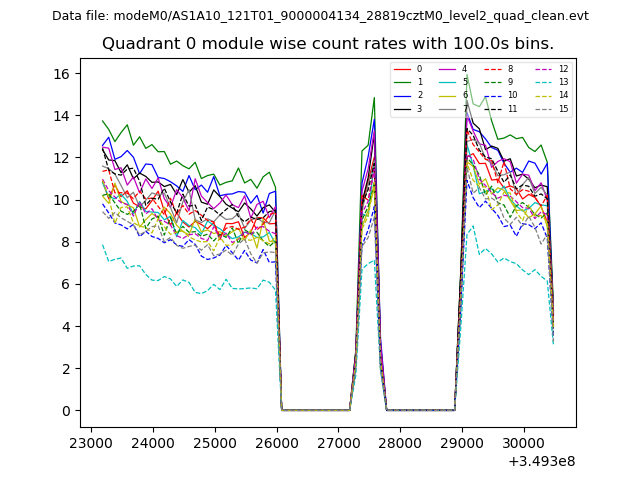 |
 |
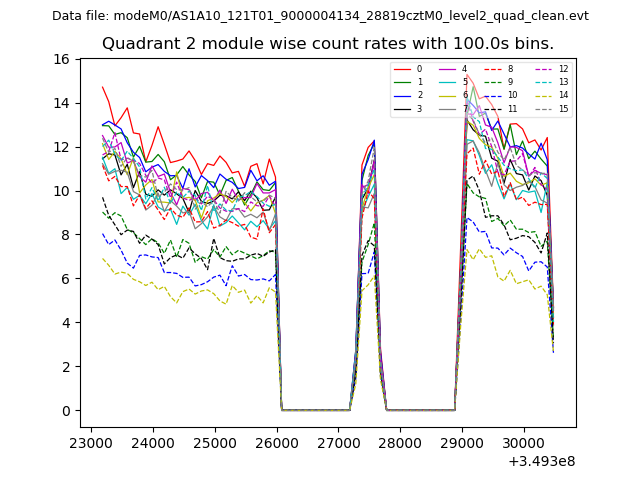
| Module-wise count rates for Quadrant B Data is divided into 100 sec bins |
 |
 |
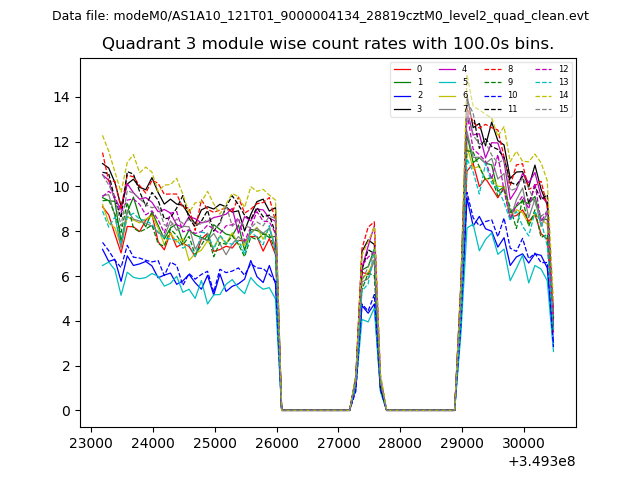
| Module-wise count rates for Quadrant C Data is divided into 100 sec bins |
 |
 |
| Module-wise count rates for Quadrant D Data is divided into 100 sec bins |
 |
 |
| Parameter | Plot |
|---|---|
| CZT HV Monitor | 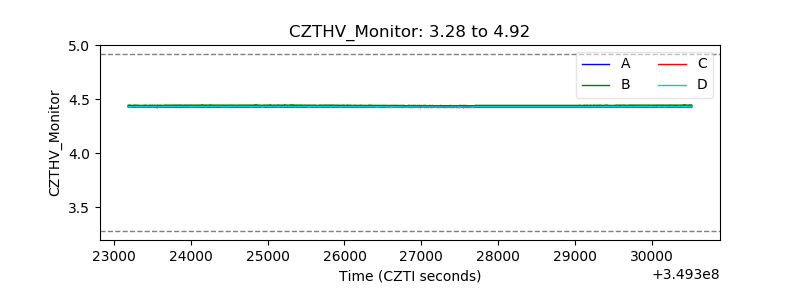 |
| D_VDD | 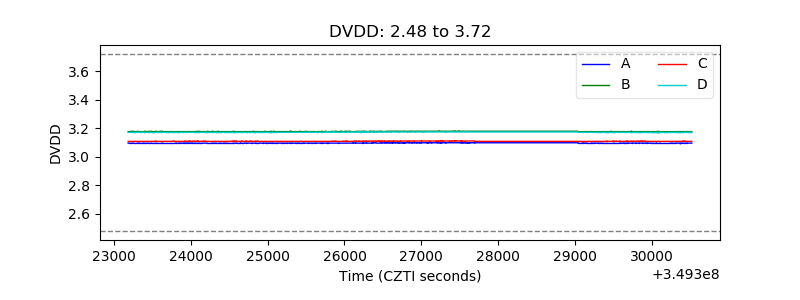 |
| Temperature 1 | 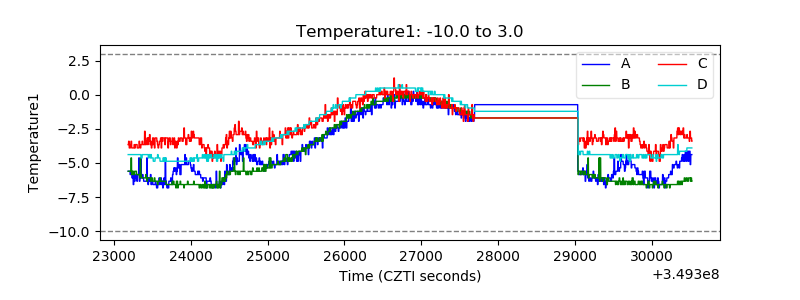 |
| Veto HV Monitor | 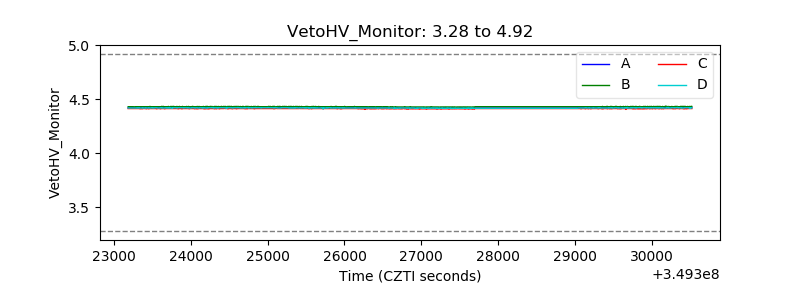 |
| Veto LLD | 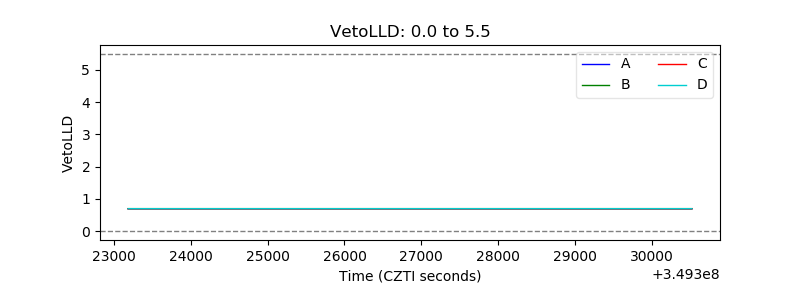 |
| Alpha Counter | 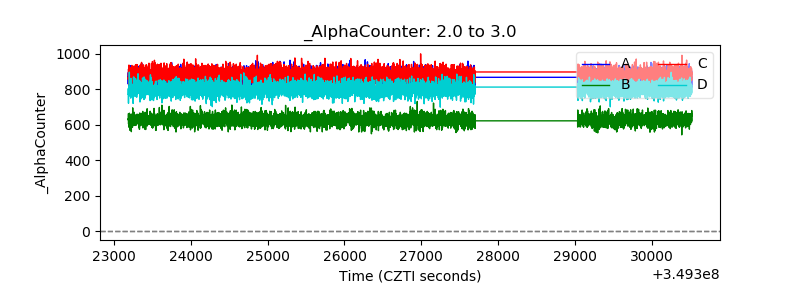 |
| _CPM_Rate | 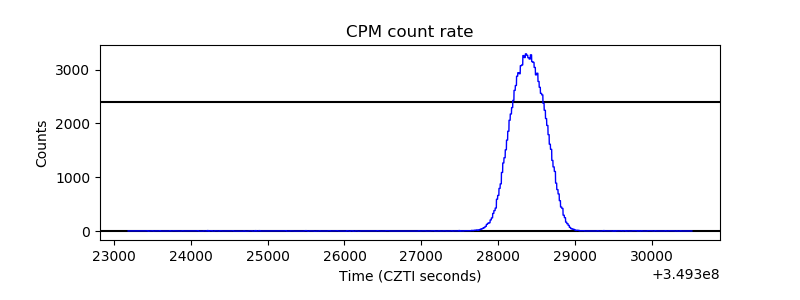 |
| CZT Counter |  |
| +2.5 Volts monitor |  |
| +5 Volts monitor |  |
| _ROLL_ROT | 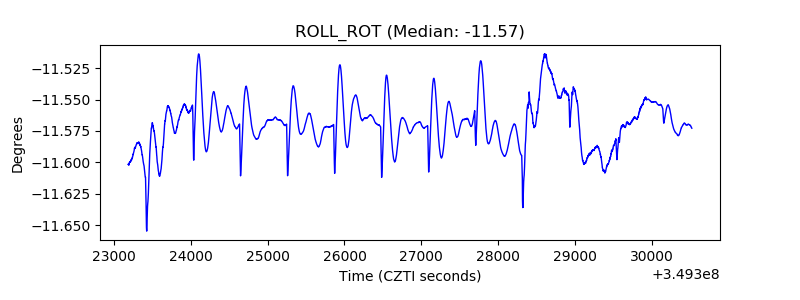 |
| _Roll_DEC | 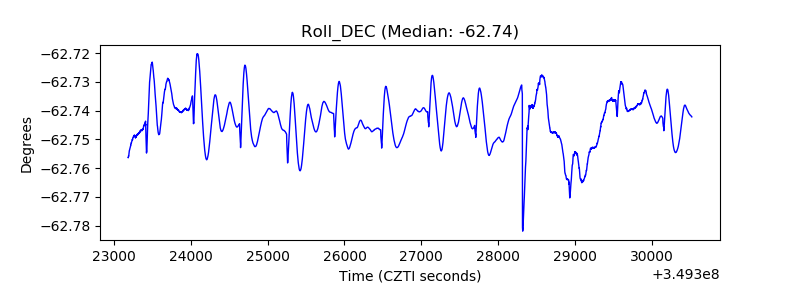 |
| _Roll_RA |  |
| Veto Counter | 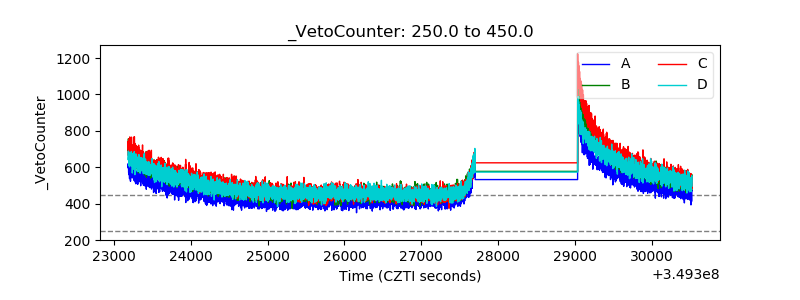 |