| Param | Original file | Final file |
|---|---|---|
| Filename | modeM0/AS1A10_121T01_9000004134_28820cztM0_level2.evt | modeM0/AS1A10_121T01_9000004134_28820cztM0_level2_quad_clean.evt |
| Size (bytes) | 657,472,320 | 106,102,080 |
| Size | 627.0 MB | 101.2 MB |
| Events in quadrant A | 2,973,329 | 718,258 |
| Events in quadrant B | 3,147,484 | 750,618 |
| Events in quadrant C | 4,385,441 | 709,403 |
| Events in quadrant D | 9,007,302 | 623,013 |
| Mode M9 | |||
|---|---|---|---|
| Quadrant | BADHDUFLAG | Total packets | Discarded packets |
| A | 0 | 14 | 0 |
| B | 0 | 14 | 0 |
| C | 0 | 14 | 0 |
| D | 0 | 14 | 0 |
| Mode M0 | |||
|---|---|---|---|
| Quadrant | BADHDUFLAG | Total packets | Discarded packets |
| A | 0 | 12237 | 1 |
| B | 0 | 12750 | 1 |
| C | 0 | 17278 | 1 |
| D | 0 | 30937 | 1 |
| Mode SS | |||
|---|---|---|---|
| Quadrant | BADHDUFLAG | Total packets | Discarded packets |
| A | 0 | 118 | 0 |
| B | 0 | 118 | 0 |
| C | 0 | 118 | 0 |
| D | 0 | 118 | 0 |
| Quadrant | Total seconds | Saturated seconds | Saturation percentage |
|---|---|---|---|
| A | 5896 | 27 | 0.457938% |
| B | 5896 | 65 | 1.102442% |
| C | 5896 | 238 | 4.036635% |
| D | 5897 | 1968 | 33.372901% |
Noise dominated data is calculated using 1-second bins in cleaned event files. If a bin has >2000 counts, and if more than 50% of those come from <1% of pixels, then it is considered to be noise-dominated and hence unusable.
| Quadrant | # 1 sec bins | Bins with >0 counts | Bins with >2000 counts | High rate bins dominated by noise | Noise dominated (total time) | Noise dominated (detector-on time) | Marked lightcurve |
|---|---|---|---|---|---|---|---|
| A | 7226 | 5896 | 0 | 0 | 0.00% | 0.00% | 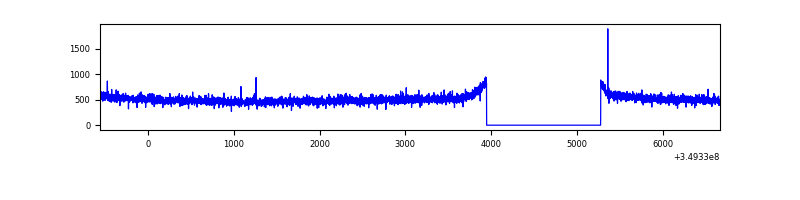 |
| B | 7226 | 5896 | 5 | 5 | 0.07% | 0.08% | 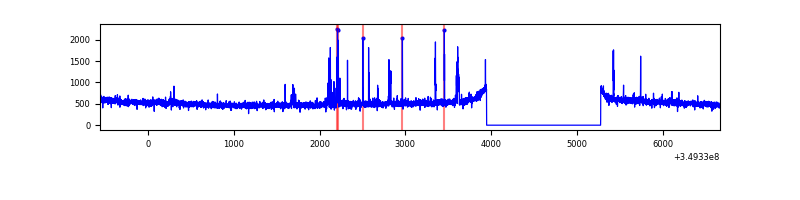 |
| C | 7226 | 5896 | 1 | 1 | 0.01% | 0.02% | 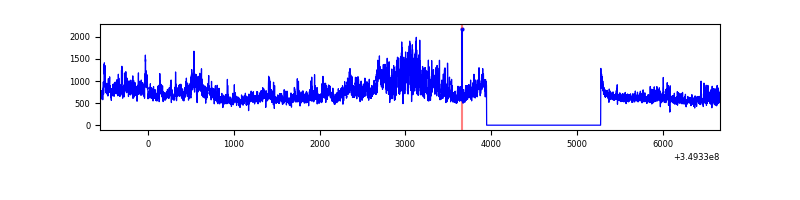 |
| D | 7227 | 5897 | 1962 | 1962 | 27.15% | 33.27% | 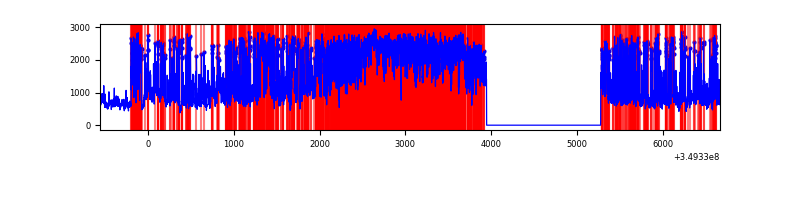 |
Top three noisy pixels from each quadrant. If the there are fewer than three noisy pixels in the level2.evt file, extra rows are filled as -1
| Pixel properties | Quadrant properties | ||||||
|---|---|---|---|---|---|---|---|
| Quadrant | DetID | PixID | Counts | Sigma | Mean | Median | Sigma |
| A | 13 | 254 | 11795 | 72.22 | 767 | 754 | 152.9 |
| A | 0 | 226 | 6596 | 38.21 | 767 | 754 | 152.9 |
| A | 3 | 137 | 6376 | 36.77 | 767 | 754 | 152.9 |
| B | 10 | 245 | 46196 | 319.14 | 774 | 757 | 142.4 |
| B | 0 | 156 | 31884 | 218.62 | 774 | 757 | 142.4 |
| B | 10 | 246 | 20429 | 138.17 | 774 | 757 | 142.4 |
| C | 3 | 233 | 1202214 | 6927.81 | 757 | 764 | 173.4 |
| C | 14 | 238 | 163874 | 940.52 | 757 | 764 | 173.4 |
| C | 14 | 254 | 61003 | 347.35 | 757 | 764 | 173.4 |
| D | 8 | 195 | 5328277 | 32676.42 | 693 | 676 | 163.0 |
| D | 1 | 52 | 541678 | 3318.19 | 693 | 676 | 163.0 |
| D | 7 | 80 | 309021 | 1891.21 | 693 | 676 | 163.0 |
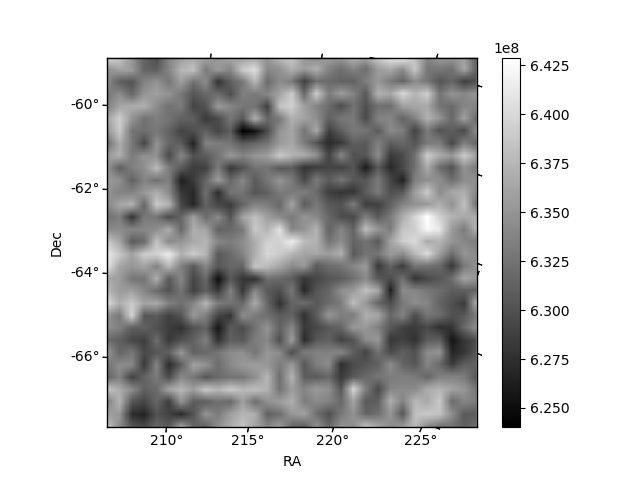
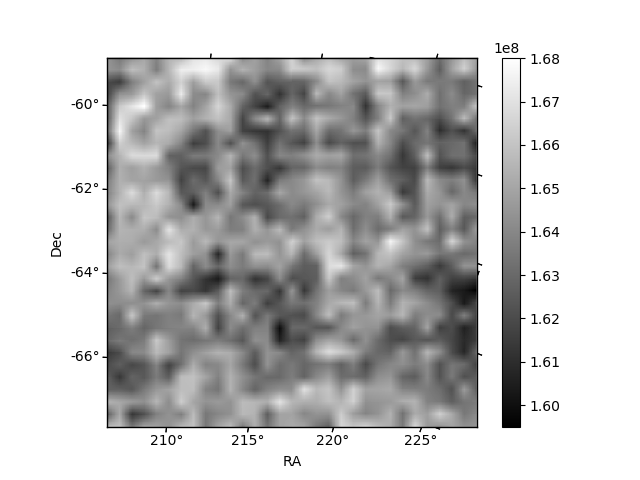
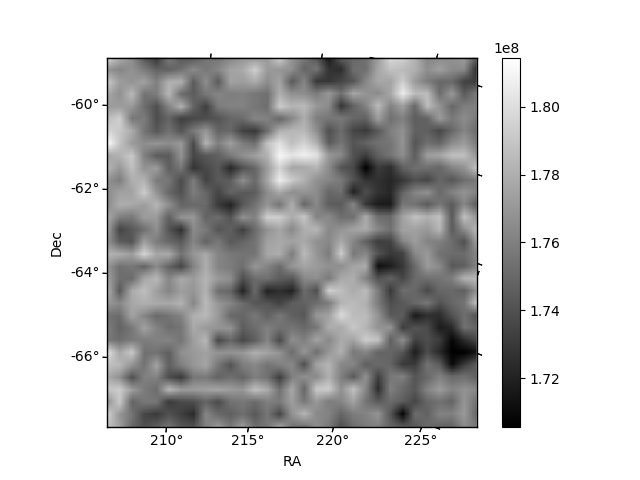
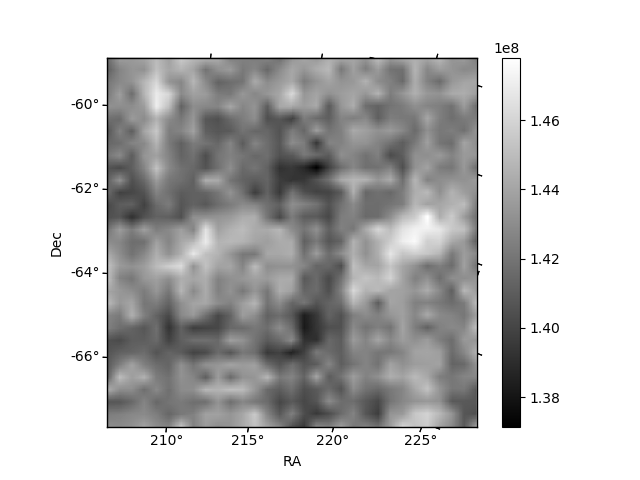
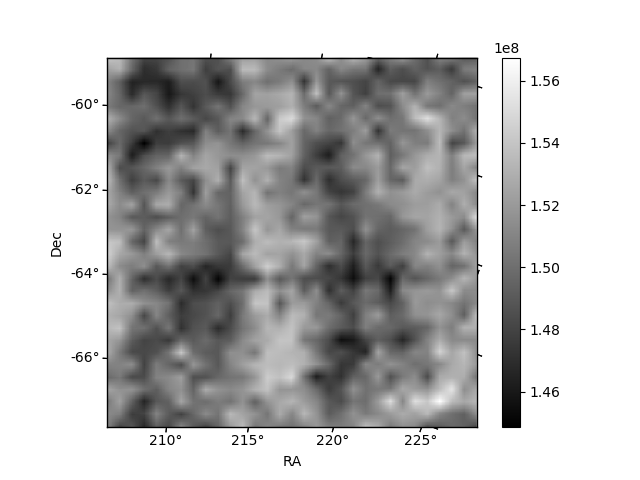
Histogram calculated using DETX and DETY for each event in the final _common_clean file
| Quadrant A | 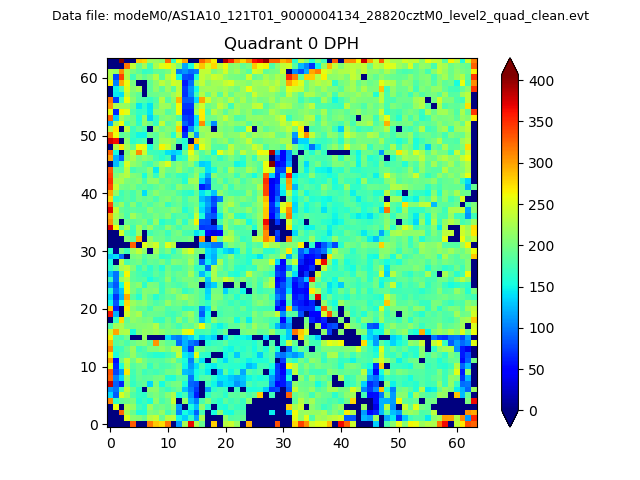 |
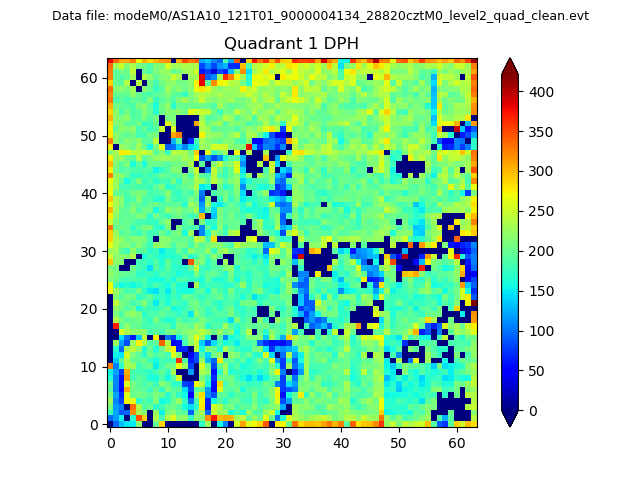 |
Quadrant B |
|---|---|---|---|
| Quadrant D | 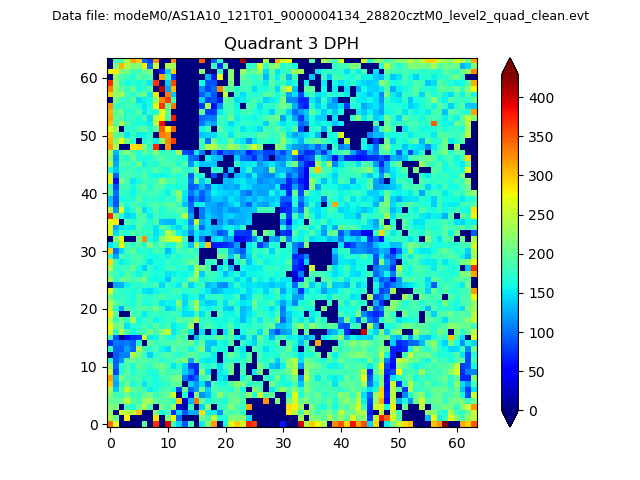 |
 |
Quadrant C |
| Plot type | Count rate plots | Images |
|---|---|---|
| Comparison with Poisson distribution Blue bars denote a histogram of data divided into 1 sec bins. Red curve is a Poisson curve with rate = median count rate of data. |
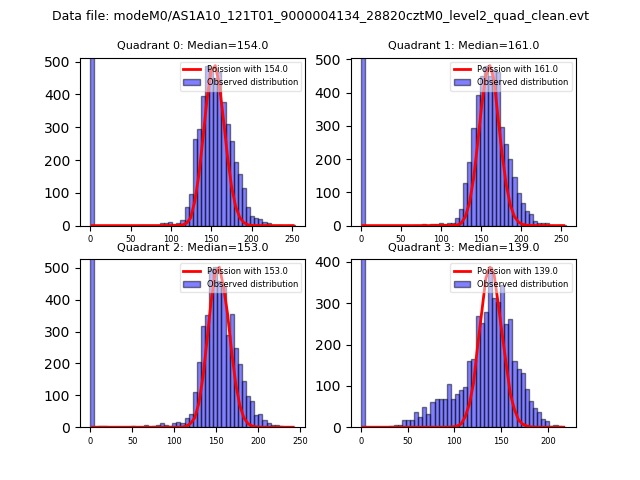 |
 |
| Quadrant-wise count rates Data is divided into 100 sec bins |
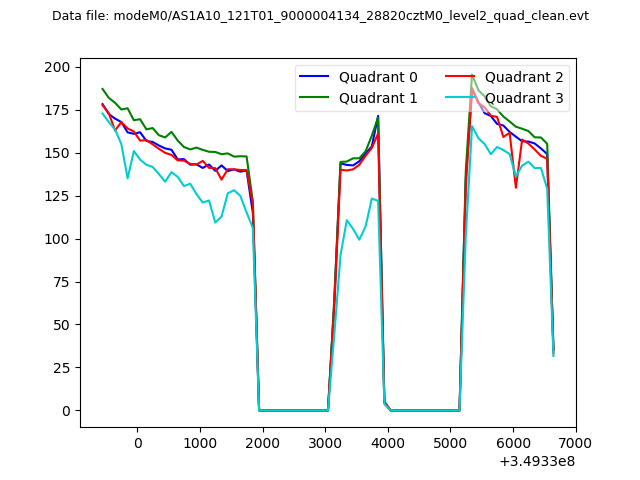 |
|
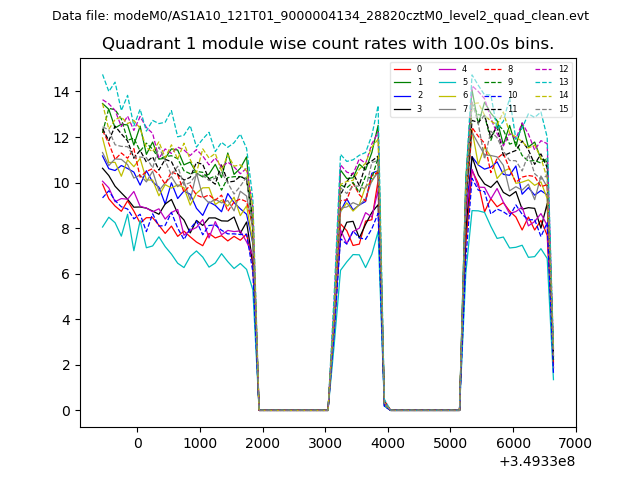
| Module-wise count rates for Quadrant A Data is divided into 100 sec bins |
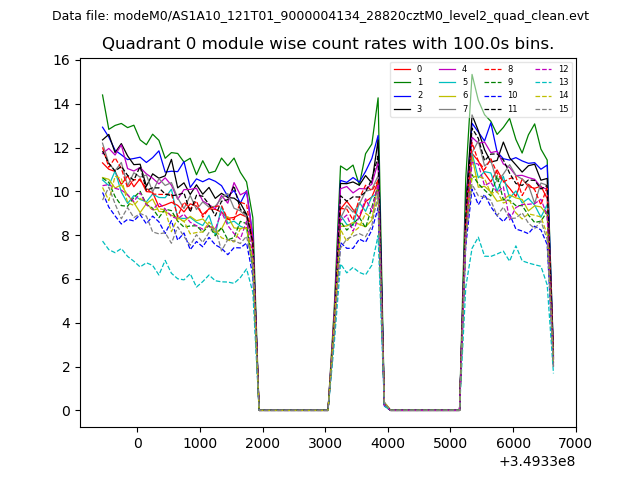 |
 |
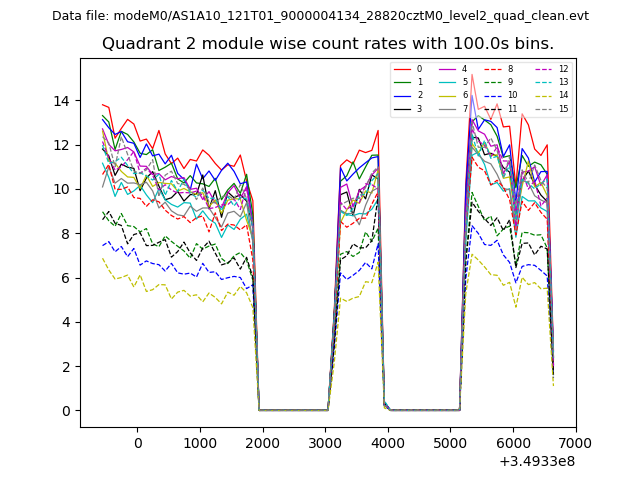
| Module-wise count rates for Quadrant B Data is divided into 100 sec bins |
 |
 |
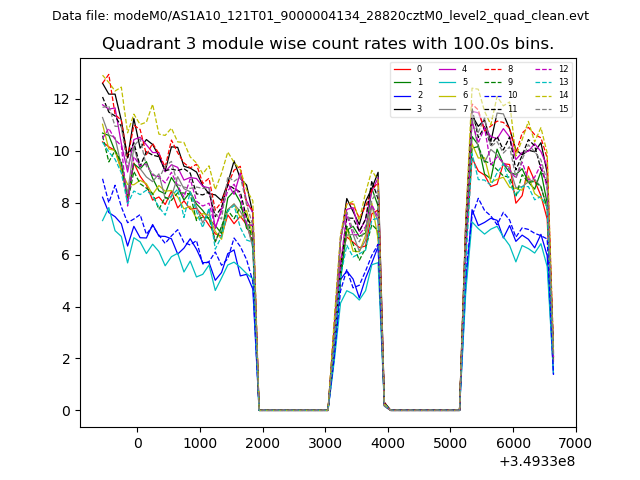
| Module-wise count rates for Quadrant C Data is divided into 100 sec bins |
 |
 |
| Module-wise count rates for Quadrant D Data is divided into 100 sec bins |
 |
 |
| Parameter | Plot |
|---|---|
| CZT HV Monitor | 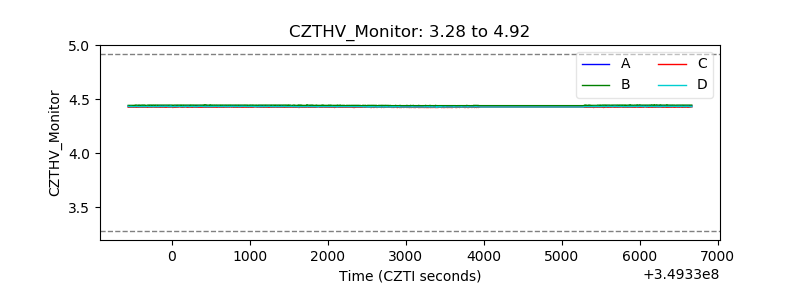 |
| D_VDD | 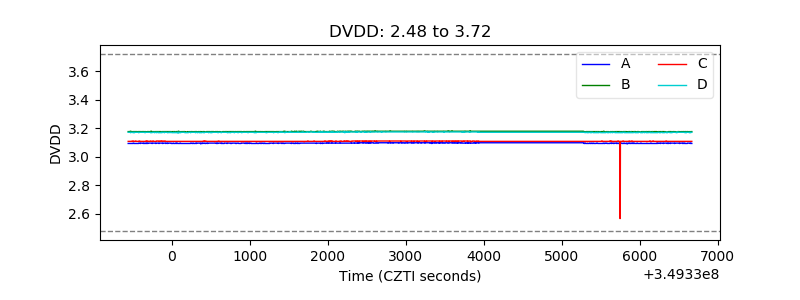 |
| Temperature 1 | 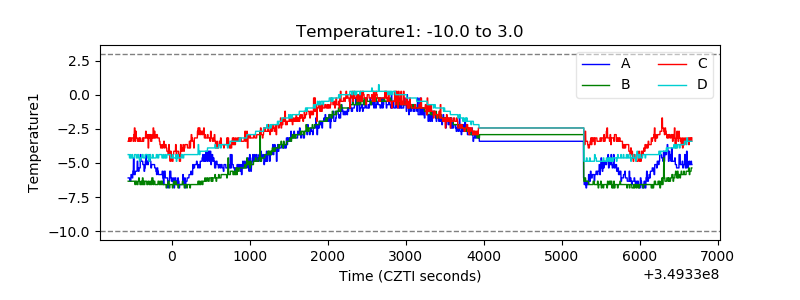 |
| Veto HV Monitor | 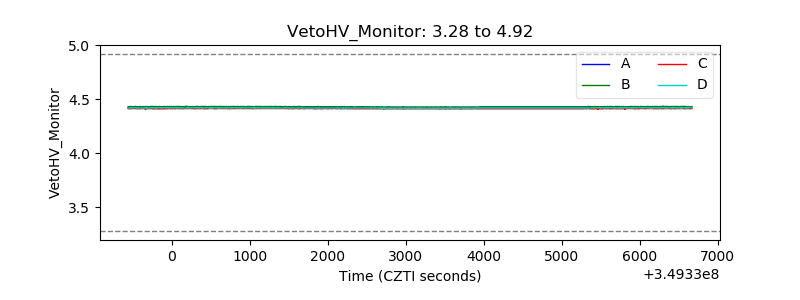 |
| Veto LLD | 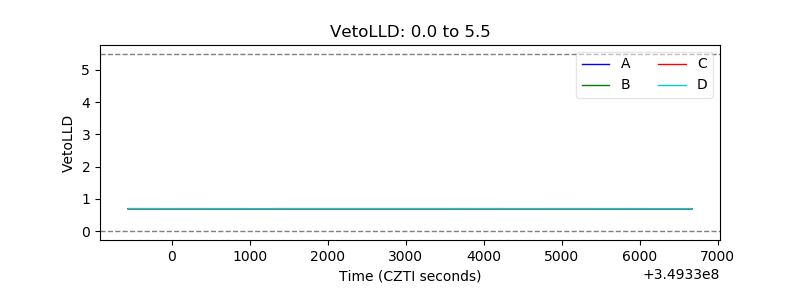 |
| Alpha Counter | 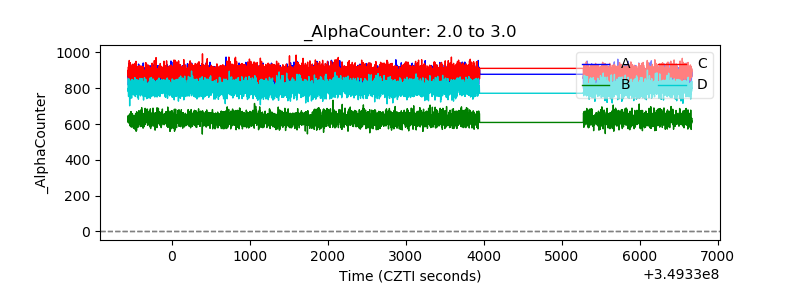 |
| _CPM_Rate | 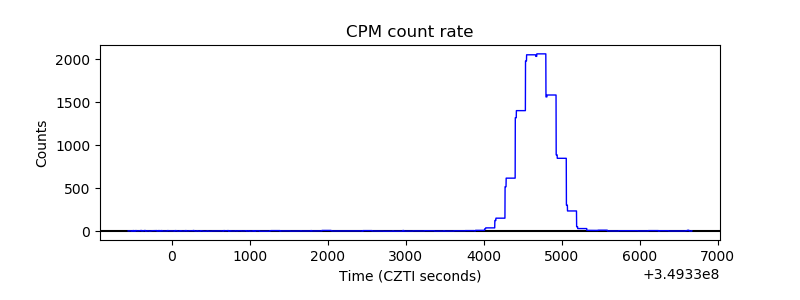 |
| CZT Counter | 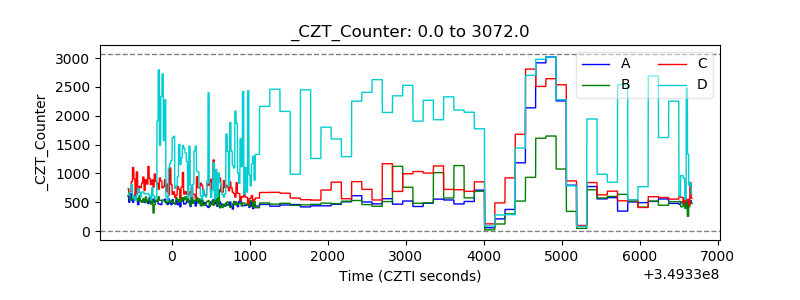 |
| +2.5 Volts monitor |  |
| +5 Volts monitor | 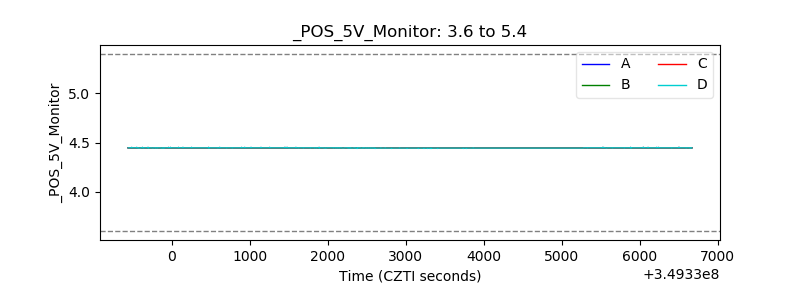 |
| _ROLL_ROT | 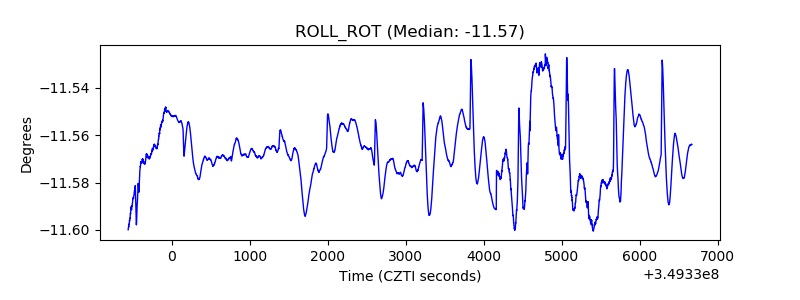 |
| _Roll_DEC | 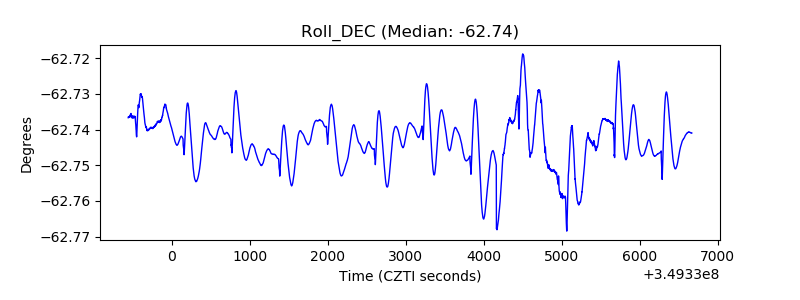 |
| _Roll_RA | 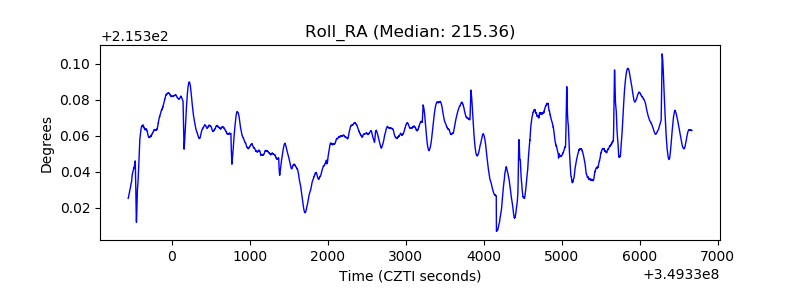 |
| Veto Counter | 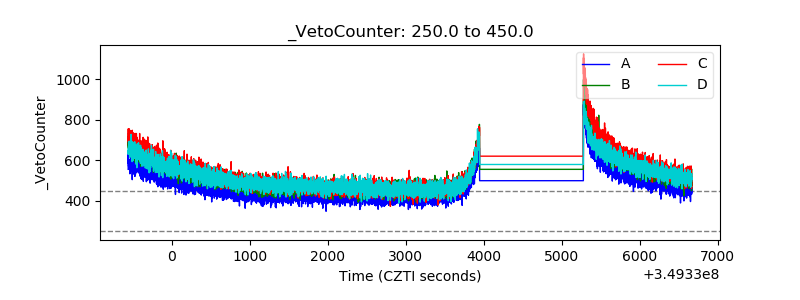 |