| Param | Original file | Final file |
|---|---|---|
| Filename | modeM0/AS1A10_121T01_9000004134_28822cztM0_level2.evt | modeM0/AS1A10_121T01_9000004134_28822cztM0_level2_quad_clean.evt |
| Size (bytes) | 575,138,880 | 98,320,320 |
| Size | 548.5 MB | 93.8 MB |
| Events in quadrant A | 2,908,344 | 661,852 |
| Events in quadrant B | 2,967,234 | 677,158 |
| Events in quadrant C | 3,873,054 | 640,164 |
| Events in quadrant D | 7,263,260 | 578,664 |
| Mode M9 | |||
|---|---|---|---|
| Quadrant | BADHDUFLAG | Total packets | Discarded packets |
| A | 0 | 9 | 0 |
| B | 0 | 9 | 0 |
| C | 0 | 9 | 0 |
| D | 0 | 9 | 0 |
| Mode M0 | |||
|---|---|---|---|
| Quadrant | BADHDUFLAG | Total packets | Discarded packets |
| A | 0 | 12353 | 1 |
| B | 0 | 12503 | 1 |
| C | 0 | 15487 | 1 |
| D | 0 | 25810 | 1 |
| Mode SS | |||
|---|---|---|---|
| Quadrant | BADHDUFLAG | Total packets | Discarded packets |
| A | 0 | 122 | 0 |
| B | 0 | 122 | 0 |
| C | 0 | 122 | 0 |
| D | 0 | 122 | 0 |
| Quadrant | Total seconds | Saturated seconds | Saturation percentage |
|---|---|---|---|
| A | 6002 | 75 | 1.249583% |
| B | 6003 | 78 | 1.299350% |
| C | 6003 | 259 | 4.314509% |
| D | 6003 | 977 | 16.275196% |
Noise dominated data is calculated using 1-second bins in cleaned event files. If a bin has >2000 counts, and if more than 50% of those come from <1% of pixels, then it is considered to be noise-dominated and hence unusable.
| Quadrant | # 1 sec bins | Bins with >0 counts | Bins with >2000 counts | High rate bins dominated by noise | Noise dominated (total time) | Noise dominated (detector-on time) | Marked lightcurve |
|---|---|---|---|---|---|---|---|
| A | 6907 | 6002 | 0 | 0 | 0.00% | 0.00% | 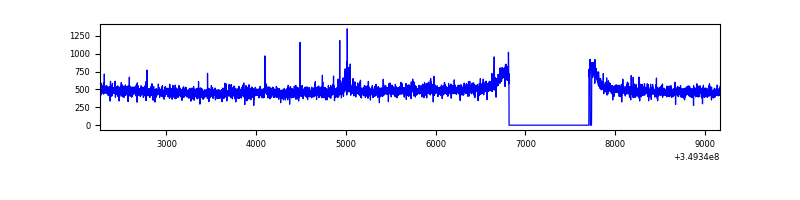 |
| B | 6908 | 6003 | 5 | 5 | 0.07% | 0.08% | 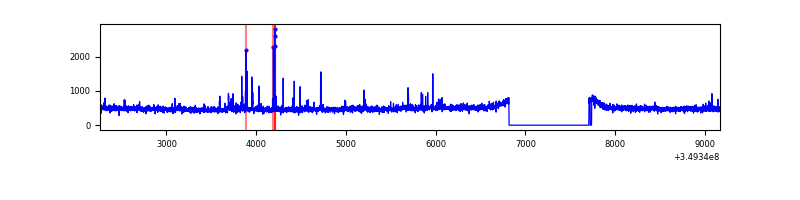 |
| C | 6908 | 6003 | 0 | 0 | 0.00% | 0.00% | 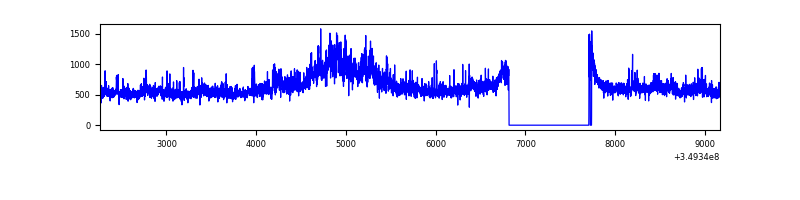 |
| D | 6908 | 6003 | 942 | 942 | 13.64% | 15.69% | 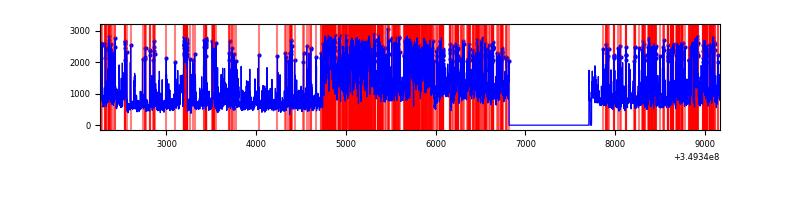 |
Top three noisy pixels from each quadrant. If the there are fewer than three noisy pixels in the level2.evt file, extra rows are filled as -1
| Pixel properties | Quadrant properties | ||||||
|---|---|---|---|---|---|---|---|
| Quadrant | DetID | PixID | Counts | Sigma | Mean | Median | Sigma |
| A | 14 | 239 | 18217 | 117.35 | 743 | 729 | 149.0 |
| A | 14 | 235 | 17447 | 112.18 | 743 | 729 | 149.0 |
| A | 13 | 254 | 11538 | 72.53 | 743 | 729 | 149.0 |
| B | 0 | 156 | 26750 | 190.91 | 737 | 719 | 136.4 |
| B | 15 | 219 | 17739 | 124.82 | 737 | 719 | 136.4 |
| B | 12 | 111 | 16171 | 113.32 | 737 | 719 | 136.4 |
| C | 3 | 233 | 830313 | 5037.29 | 714 | 718 | 164.7 |
| C | 14 | 238 | 154523 | 933.9 | 714 | 718 | 164.7 |
| C | 14 | 254 | 60576 | 363.46 | 714 | 718 | 164.7 |
| D | 8 | 195 | 2259625 | 13543.85 | 694 | 675 | 166.8 |
| D | 1 | 52 | 2049295 | 12282.79 | 694 | 675 | 166.8 |
| D | 7 | 80 | 113545 | 676.73 | 694 | 675 | 166.8 |
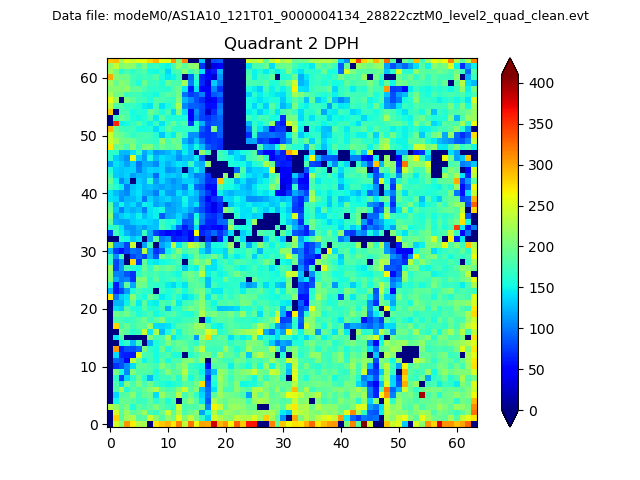
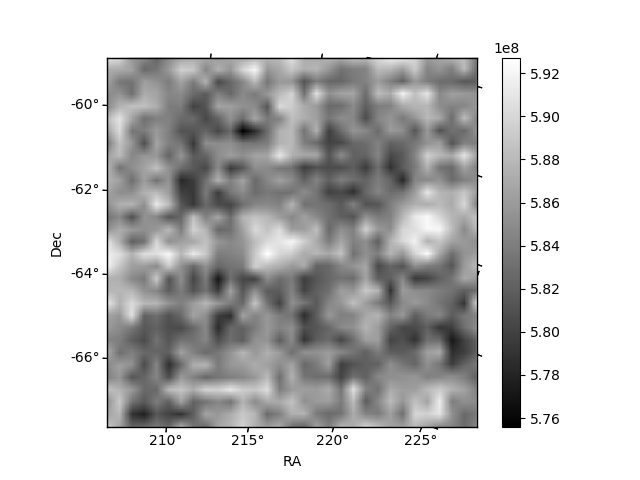
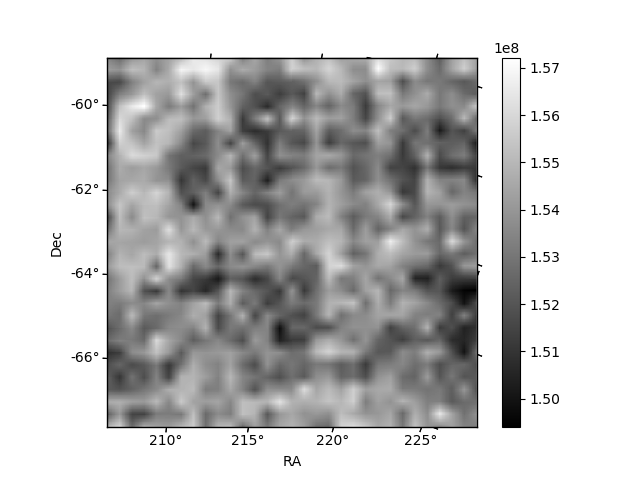
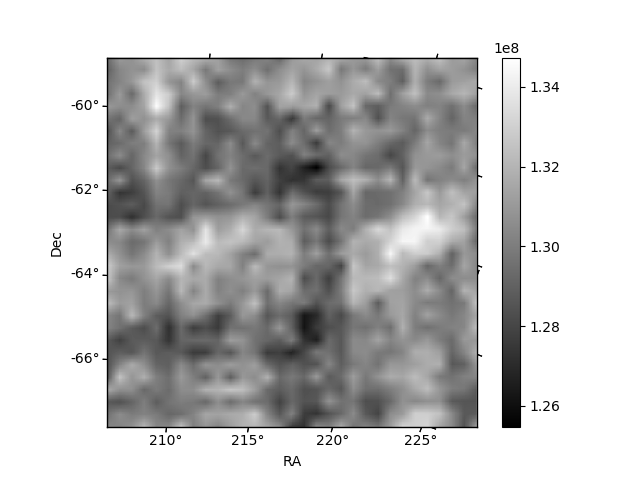
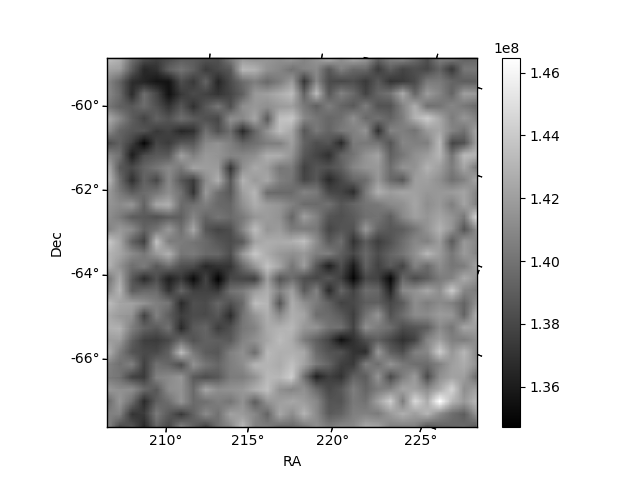
Histogram calculated using DETX and DETY for each event in the final _common_clean file
| Quadrant A | 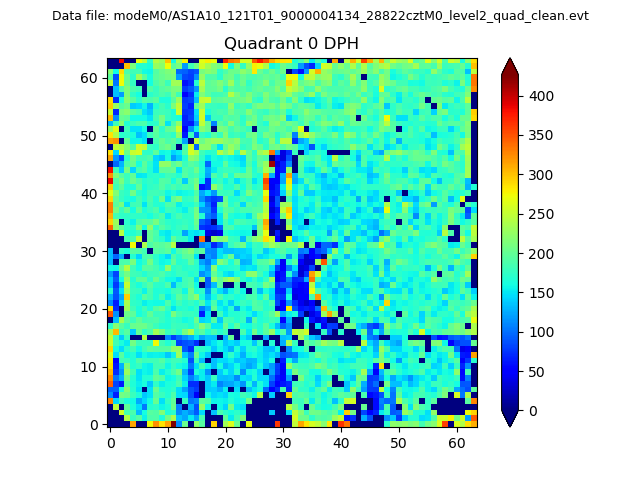 |
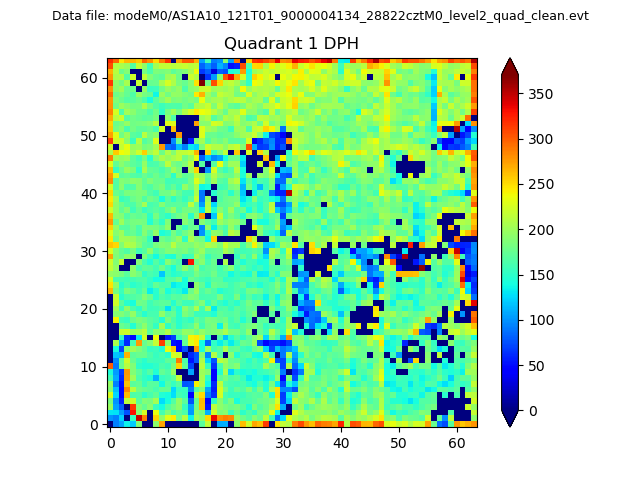 |
Quadrant B |
|---|---|---|---|
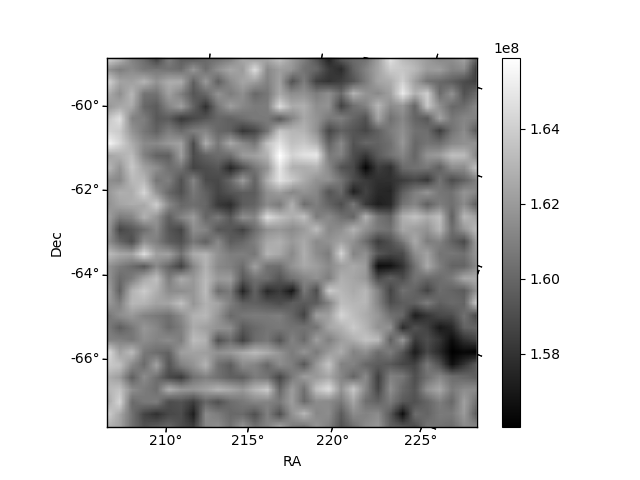
| Quadrant D | 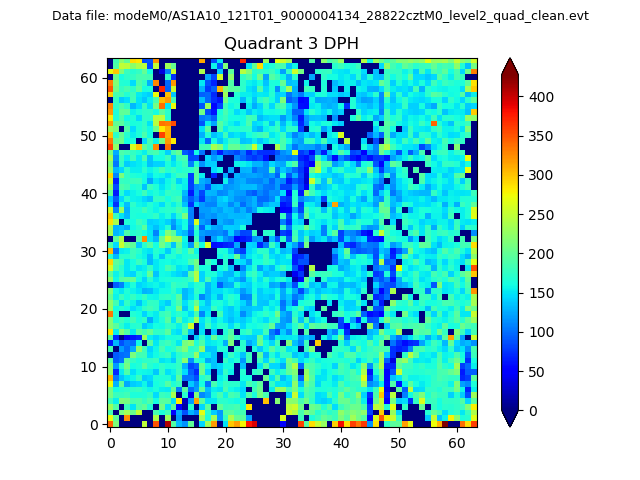 |
 |
Quadrant C |
| Plot type | Count rate plots | Images |
|---|---|---|
| Comparison with Poisson distribution Blue bars denote a histogram of data divided into 1 sec bins. Red curve is a Poisson curve with rate = median count rate of data. |
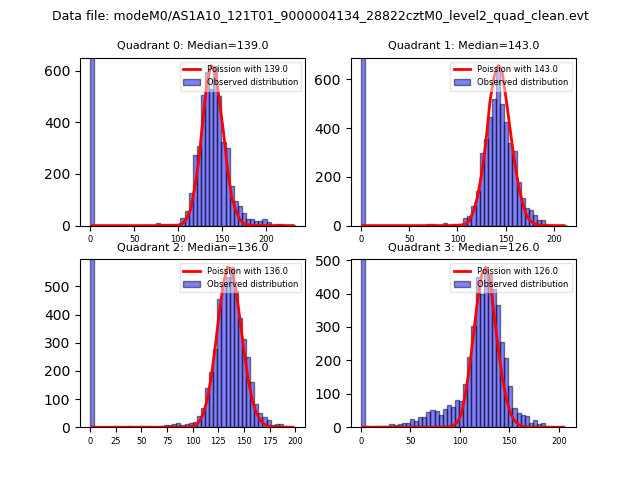 |
 |
| Quadrant-wise count rates Data is divided into 100 sec bins |
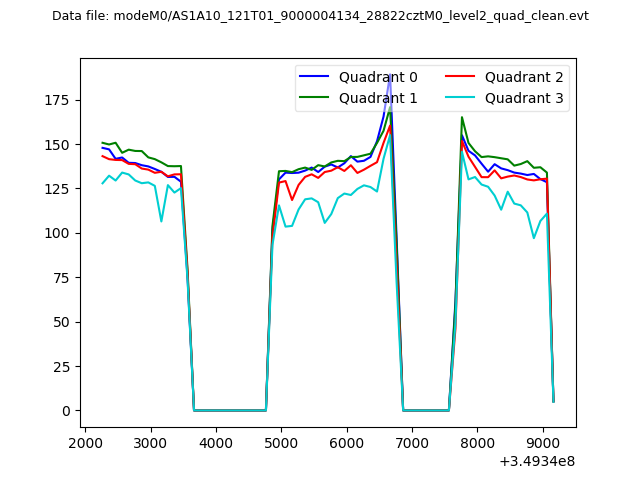 |
|
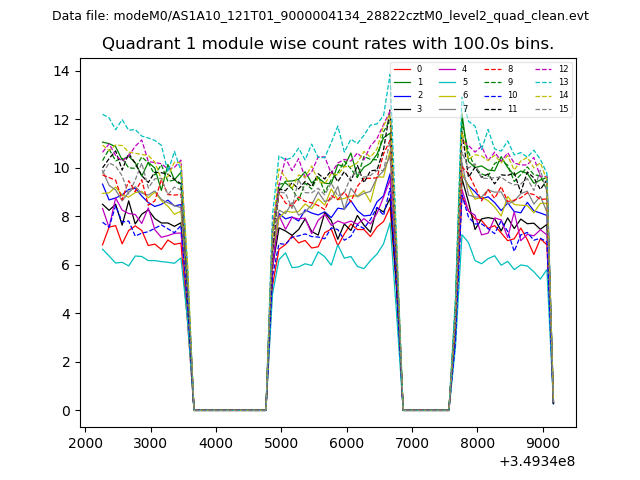
| Module-wise count rates for Quadrant A Data is divided into 100 sec bins |
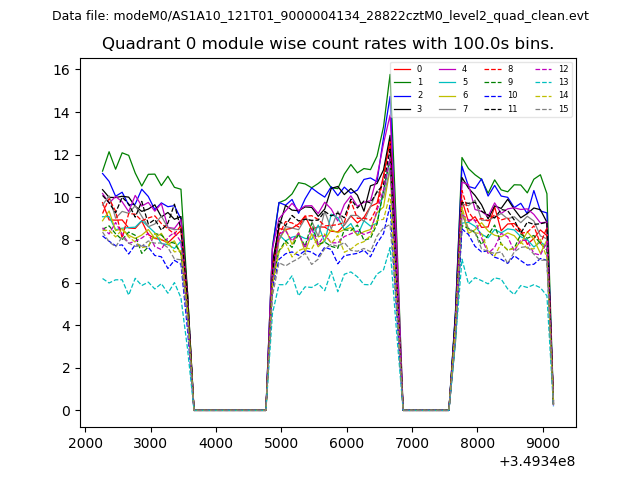 |
 |
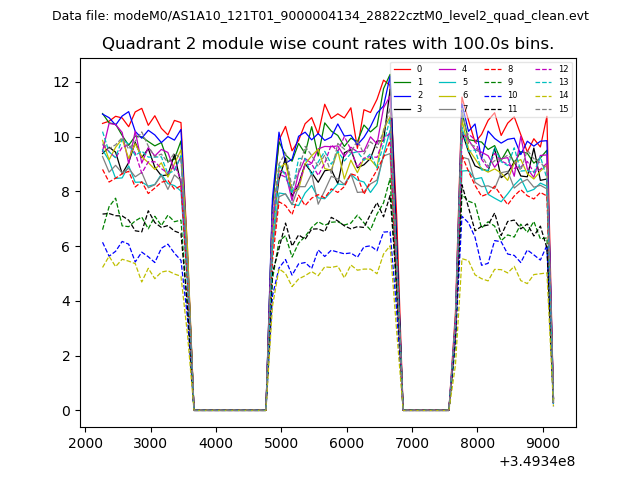
| Module-wise count rates for Quadrant B Data is divided into 100 sec bins |
 |
 |
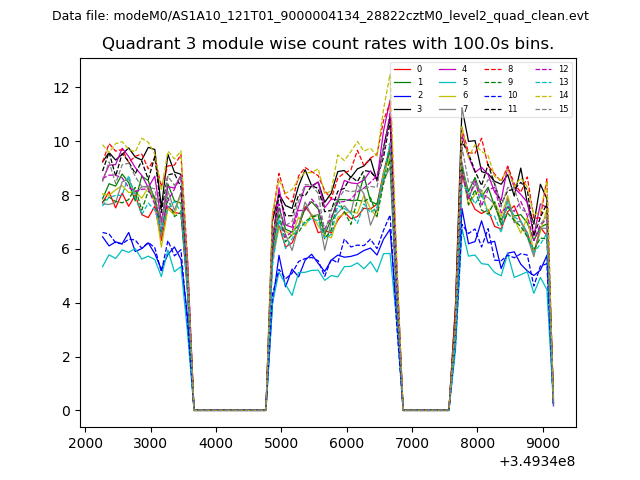
| Module-wise count rates for Quadrant C Data is divided into 100 sec bins |
 |
 |
| Module-wise count rates for Quadrant D Data is divided into 100 sec bins |
 |
 |
| Parameter | Plot |
|---|---|
| CZT HV Monitor | 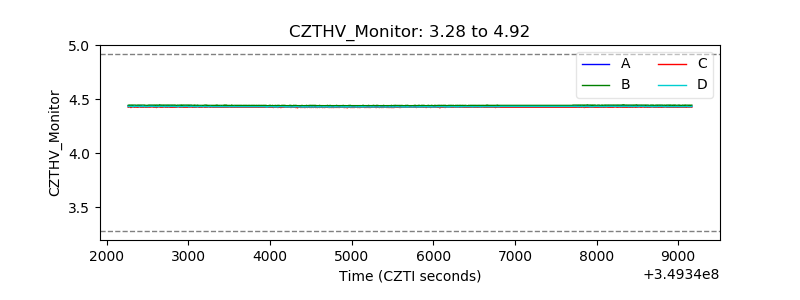 |
| D_VDD | 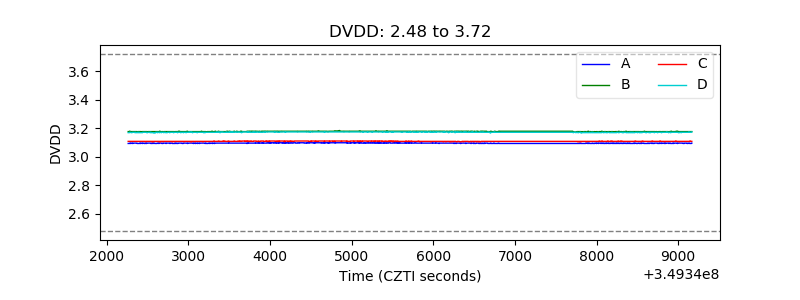 |
| Temperature 1 | 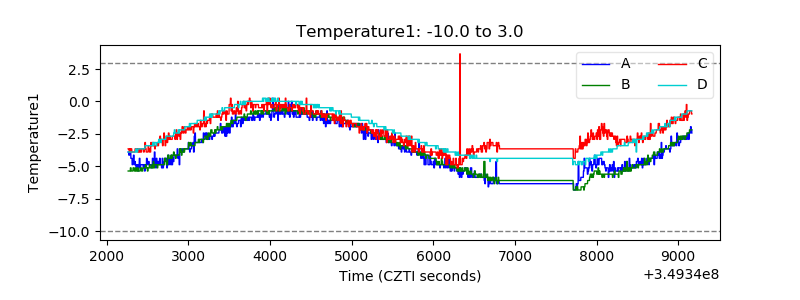 |
| Veto HV Monitor | 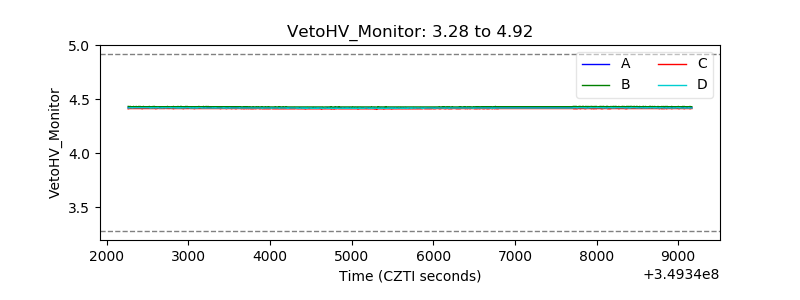 |
| Veto LLD | 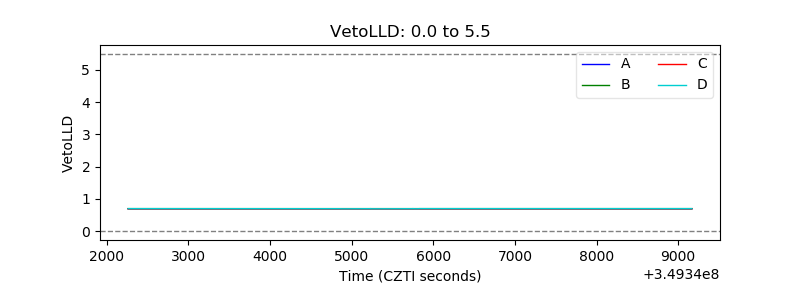 |
| Alpha Counter | 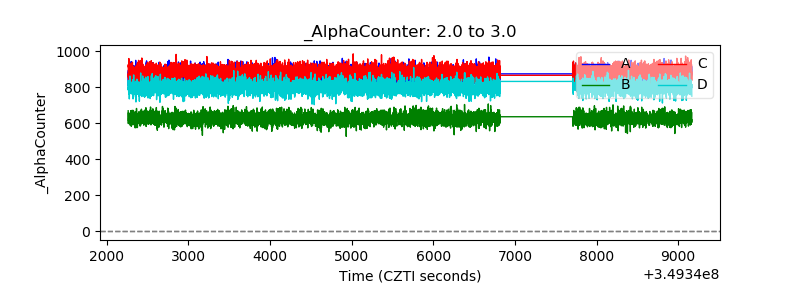 |
| _CPM_Rate | 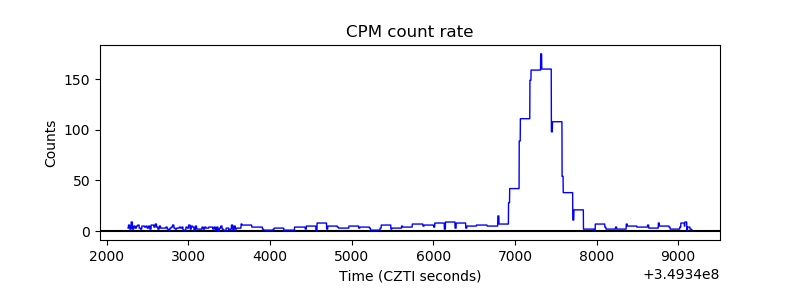 |
| CZT Counter | 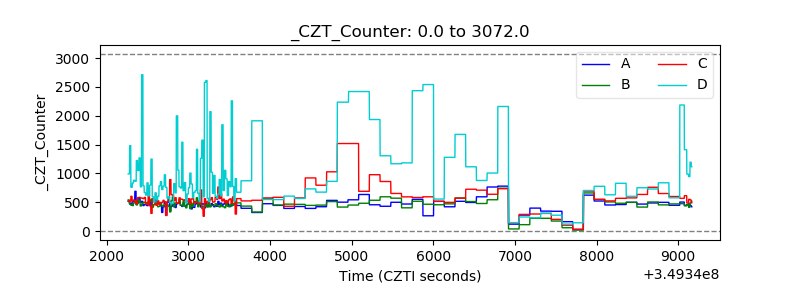 |
| +2.5 Volts monitor | 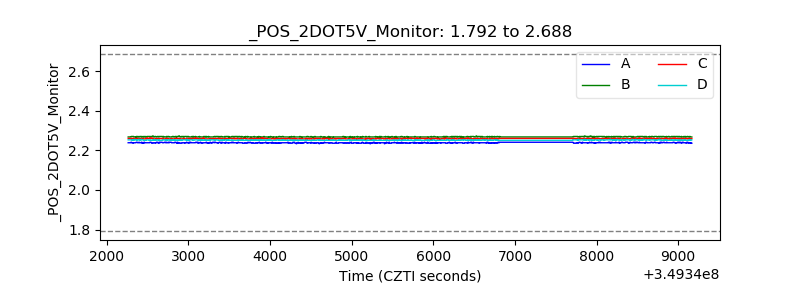 |
| +5 Volts monitor |  |
| _ROLL_ROT | 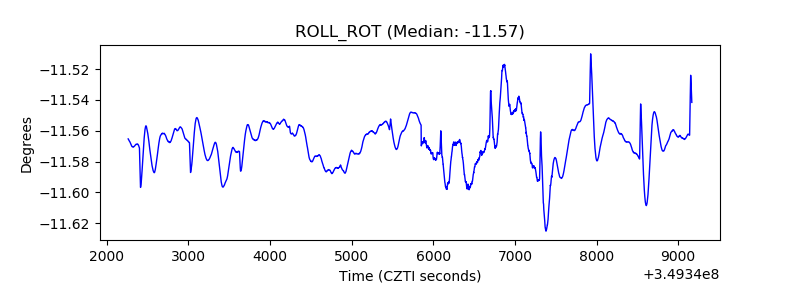 |
| _Roll_DEC | 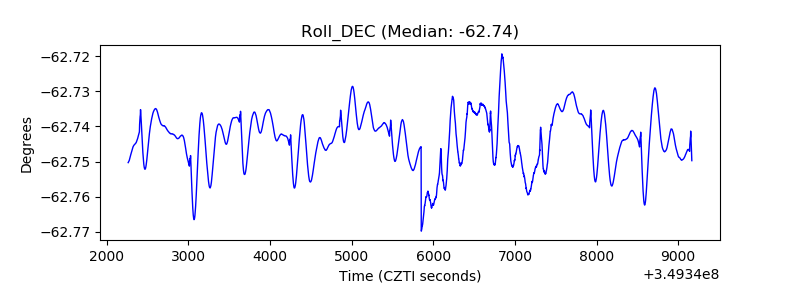 |
| _Roll_RA | 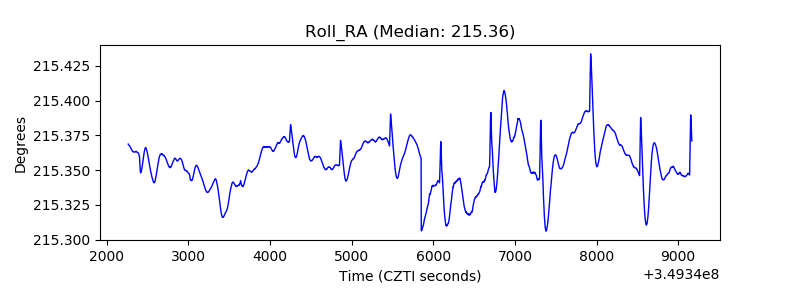 |
| Veto Counter | 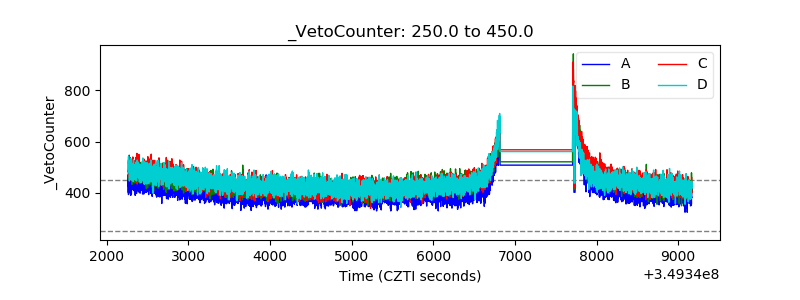 |