| Param | Original file | Final file |
|---|---|---|
| Filename | modeM0/AS1A10_121T01_9000004134_28823cztM0_level2.evt | modeM0/AS1A10_121T01_9000004134_28823cztM0_level2_quad_clean.evt |
| Size (bytes) | 800,717,760 | 108,126,720 |
| Size | 763.6 MB | 103.1 MB |
| Events in quadrant A | 3,322,422 | 741,143 |
| Events in quadrant B | 3,407,286 | 759,108 |
| Events in quadrant C | 4,594,631 | 720,709 |
| Events in quadrant D | 12,453,748 | 565,976 |
| Mode M9 | |||
|---|---|---|---|
| Quadrant | BADHDUFLAG | Total packets | Discarded packets |
| A | 0 | 4 | 0 |
| B | 0 | 4 | 0 |
| C | 0 | 4 | 0 |
| D | 0 | 4 | 0 |
| Mode M0 | |||
|---|---|---|---|
| Quadrant | BADHDUFLAG | Total packets | Discarded packets |
| A | 0 | 14374 | 1 |
| B | 0 | 14527 | 1 |
| C | 0 | 18360 | 1 |
| D | 0 | 41839 | 1 |
| Mode SS | |||
|---|---|---|---|
| Quadrant | BADHDUFLAG | Total packets | Discarded packets |
| A | 0 | 142 | 0 |
| B | 0 | 142 | 0 |
| C | 0 | 142 | 0 |
| D | 0 | 142 | 0 |
| Quadrant | Total seconds | Saturated seconds | Saturation percentage |
|---|---|---|---|
| A | 6979 | 189 | 2.708124% |
| B | 6979 | 211 | 3.023356% |
| C | 6979 | 305 | 4.370254% |
| D | 6979 | 3288 | 47.112767% |
Noise dominated data is calculated using 1-second bins in cleaned event files. If a bin has >2000 counts, and if more than 50% of those come from <1% of pixels, then it is considered to be noise-dominated and hence unusable.
| Quadrant | # 1 sec bins | Bins with >0 counts | Bins with >2000 counts | High rate bins dominated by noise | Noise dominated (total time) | Noise dominated (detector-on time) | Marked lightcurve |
|---|---|---|---|---|---|---|---|
| A | 7389 | 6979 | 0 | 0 | 0.00% | 0.00% | 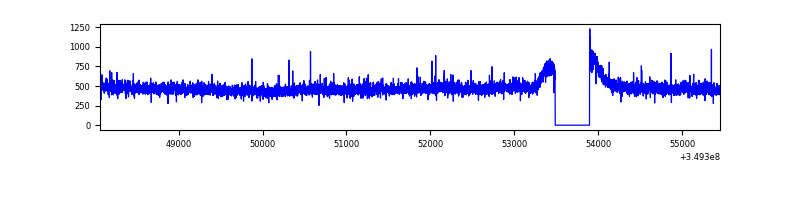 |
| B | 7389 | 6979 | 2 | 2 | 0.03% | 0.03% | 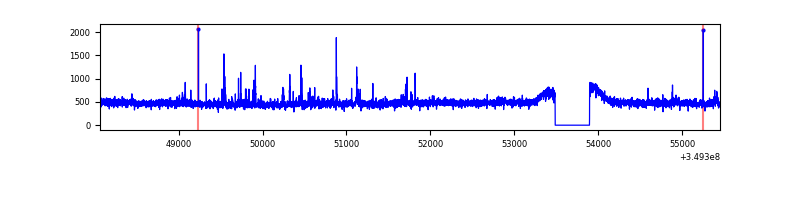 |
| C | 7389 | 6979 | 3 | 3 | 0.04% | 0.04% | 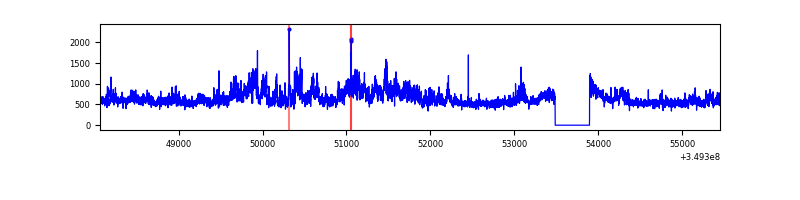 |
| D | 7389 | 6979 | 3093 | 3093 | 41.86% | 44.32% | 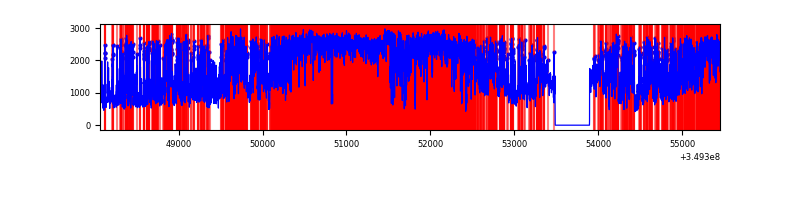 |
Top three noisy pixels from each quadrant. If the there are fewer than three noisy pixels in the level2.evt file, extra rows are filled as -1
| Pixel properties | Quadrant properties | ||||||
|---|---|---|---|---|---|---|---|
| Quadrant | DetID | PixID | Counts | Sigma | Mean | Median | Sigma |
| A | 13 | 254 | 13653 | 74.3 | 854 | 836 | 172.5 |
| A | 14 | 235 | 12624 | 68.33 | 854 | 836 | 172.5 |
| A | 3 | 137 | 8056 | 41.85 | 854 | 836 | 172.5 |
| B | 15 | 219 | 23258 | 141.16 | 847 | 825 | 158.9 |
| B | 12 | 111 | 18850 | 113.42 | 847 | 825 | 158.9 |
| B | 0 | 156 | 17613 | 105.64 | 847 | 825 | 158.9 |
| C | 3 | 233 | 1168825 | 6137.76 | 822 | 826 | 190.3 |
| C | 14 | 238 | 150751 | 787.85 | 822 | 826 | 190.3 |
| C | 14 | 254 | 28345 | 144.61 | 822 | 826 | 190.3 |
| D | 8 | 195 | 6906353 | 41340.96 | 704 | 686 | 167.0 |
| D | 1 | 52 | 2458170 | 14711.79 | 704 | 686 | 167.0 |
| D | 13 | 104 | 213460 | 1273.78 | 704 | 686 | 167.0 |
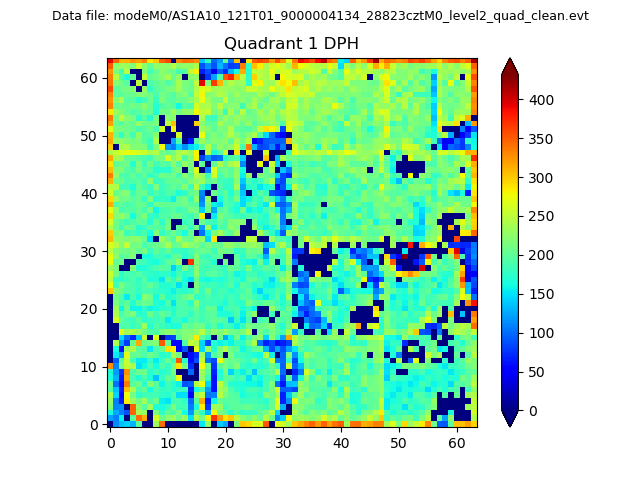
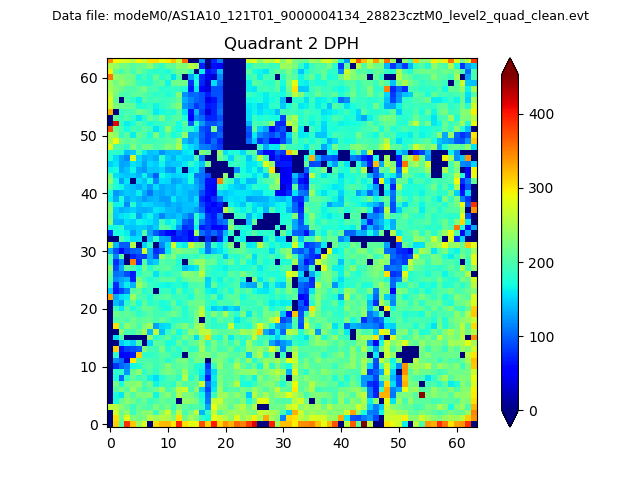
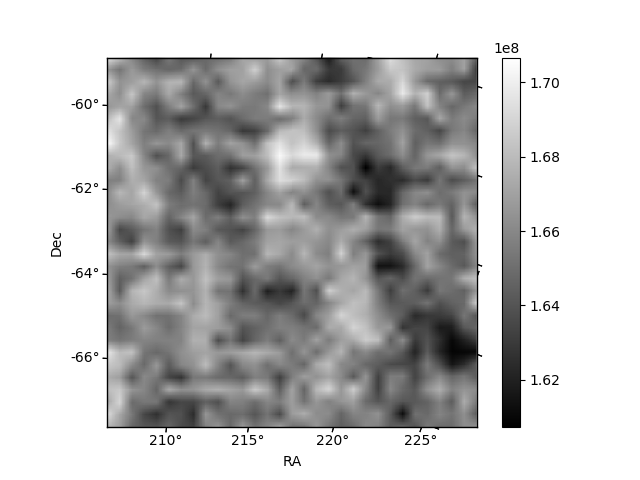
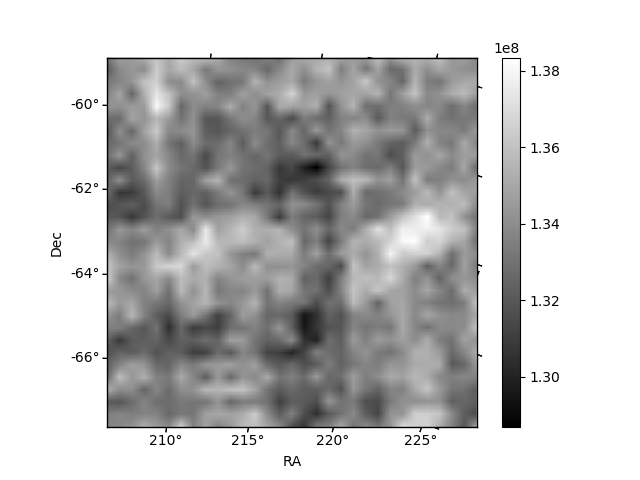
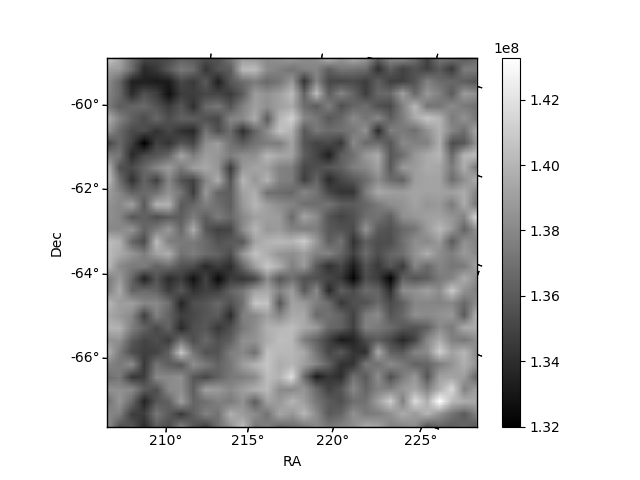
Histogram calculated using DETX and DETY for each event in the final _common_clean file
| Quadrant A |  |
 |
Quadrant B |
|---|---|---|---|
| Quadrant D | 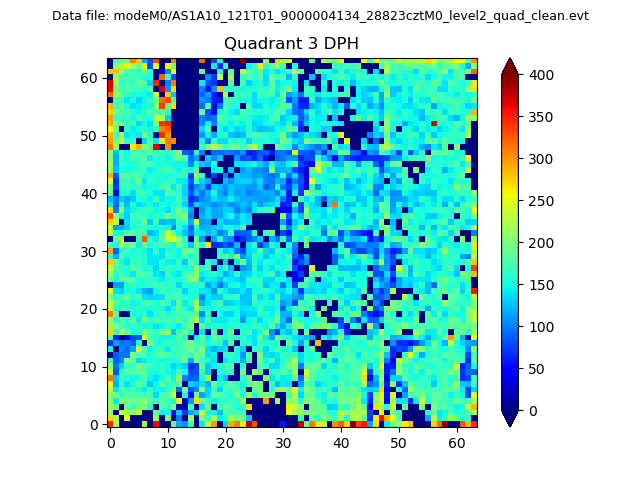 |
 |
Quadrant C |
| Plot type | Count rate plots | Images |
|---|---|---|
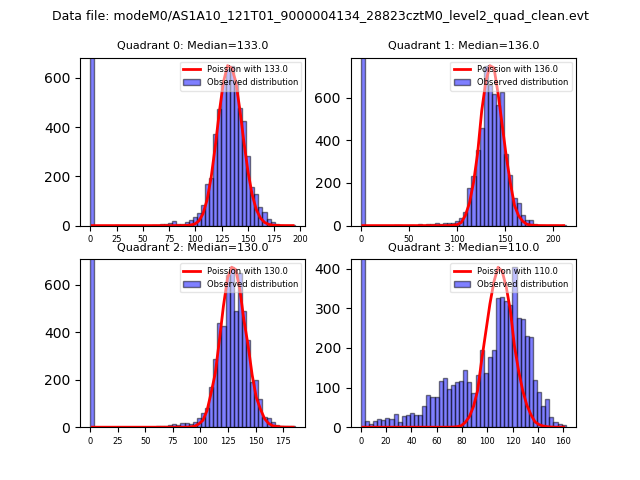
| Comparison with Poisson distribution Blue bars denote a histogram of data divided into 1 sec bins. Red curve is a Poisson curve with rate = median count rate of data. |
 |
 |
| Quadrant-wise count rates Data is divided into 100 sec bins |
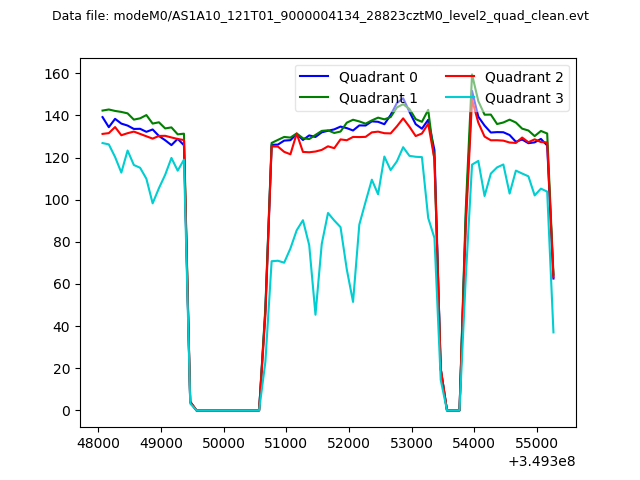 |
|
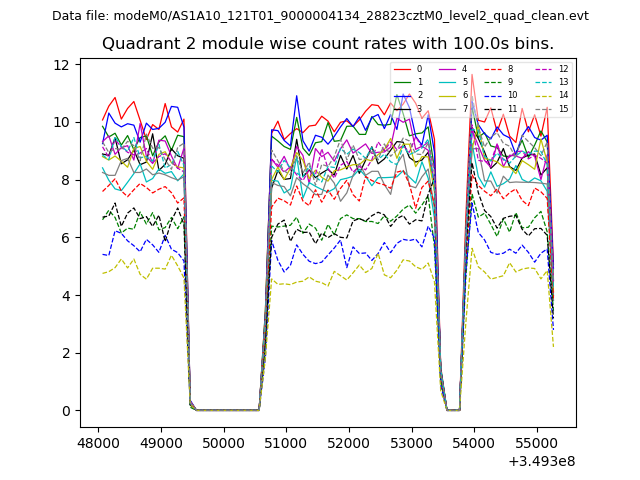
| Module-wise count rates for Quadrant A Data is divided into 100 sec bins |
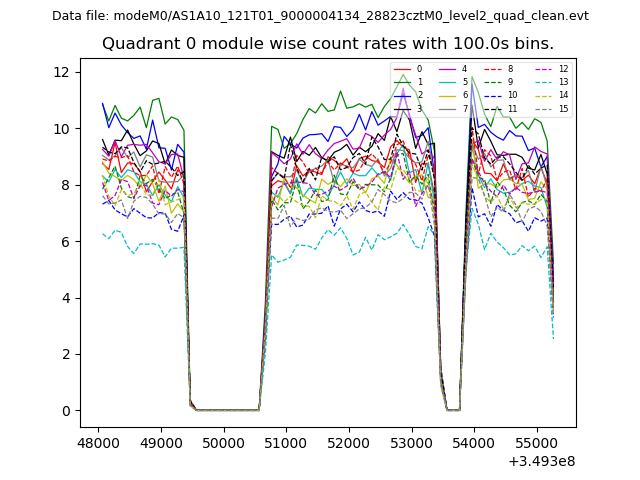 |
 |
| Module-wise count rates for Quadrant B Data is divided into 100 sec bins |
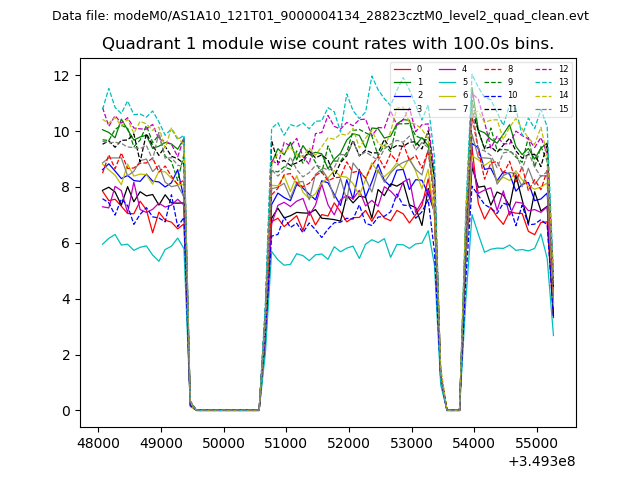 |
 |
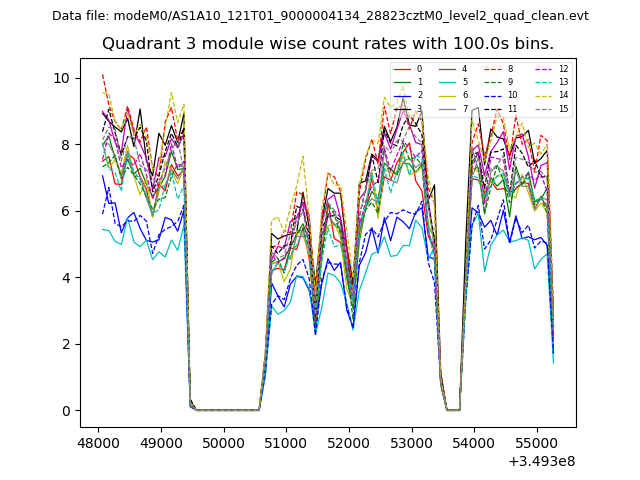
| Module-wise count rates for Quadrant C Data is divided into 100 sec bins |
 |
 |
| Module-wise count rates for Quadrant D Data is divided into 100 sec bins |
 |
 |
| Parameter | Plot |
|---|---|
| CZT HV Monitor | 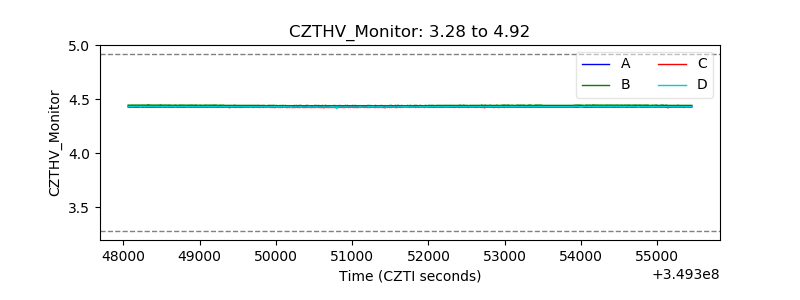 |
| D_VDD | 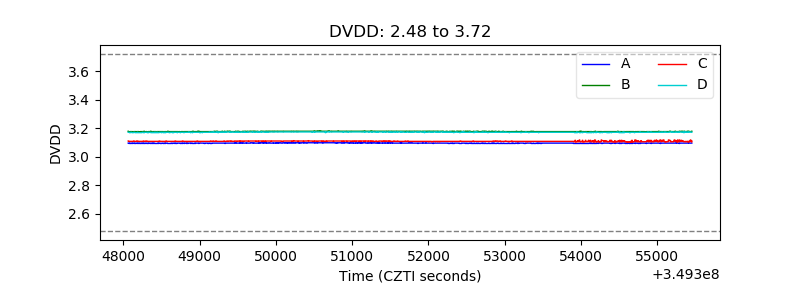 |
| Temperature 1 | 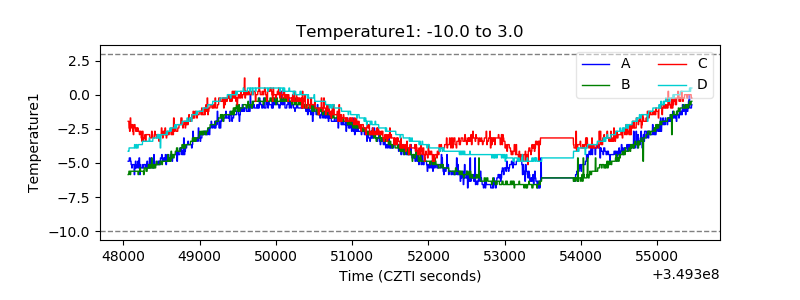 |
| Veto HV Monitor | 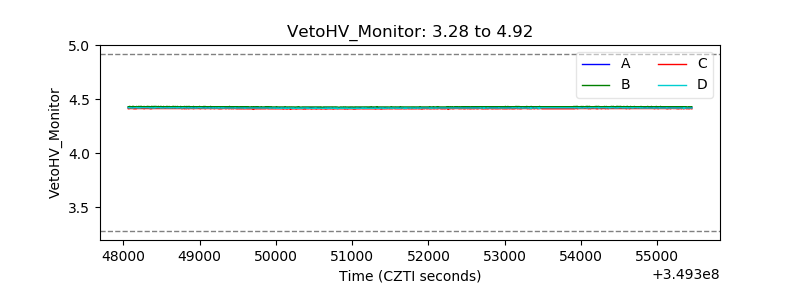 |
| Veto LLD | 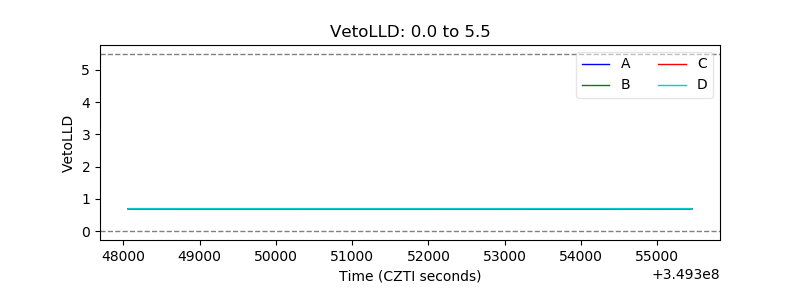 |
| Alpha Counter |  |
| _CPM_Rate | 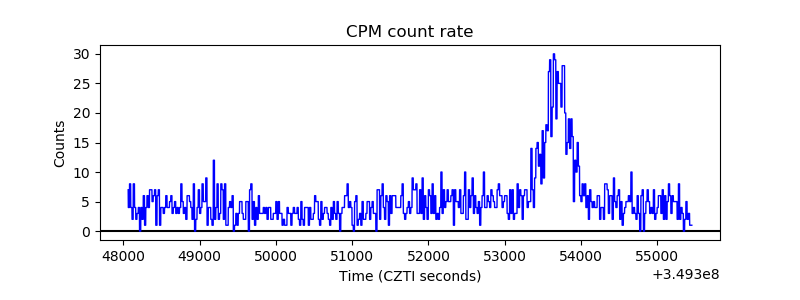 |
| CZT Counter | 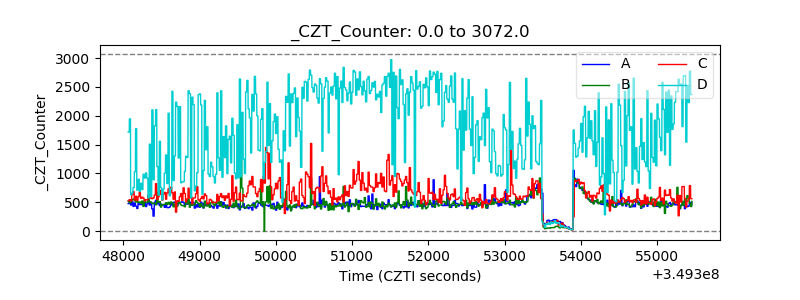 |
| +2.5 Volts monitor |  |
| +5 Volts monitor |  |
| _ROLL_ROT | 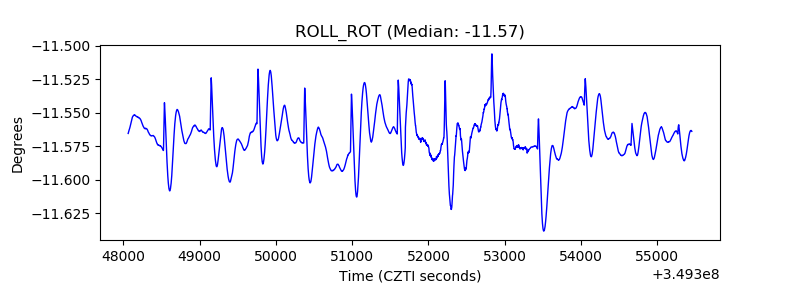 |
| _Roll_DEC | 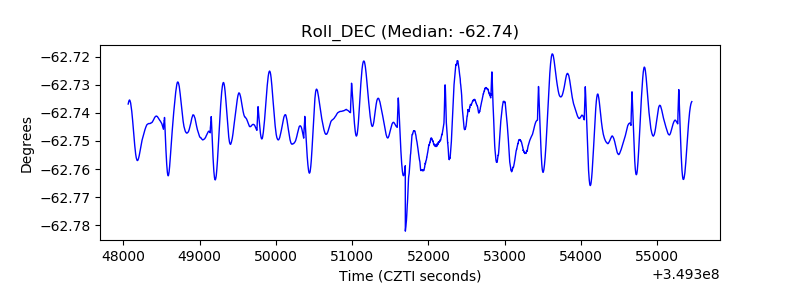 |
| _Roll_RA | 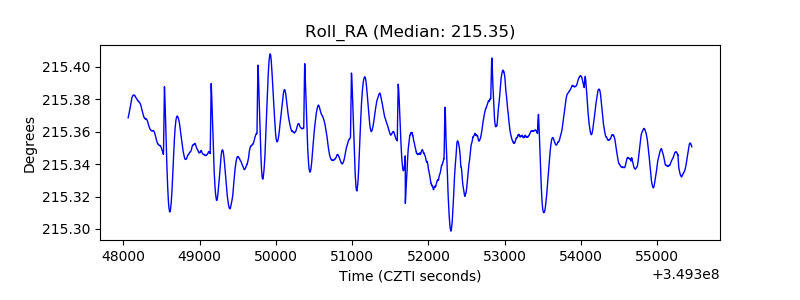 |
| Veto Counter | 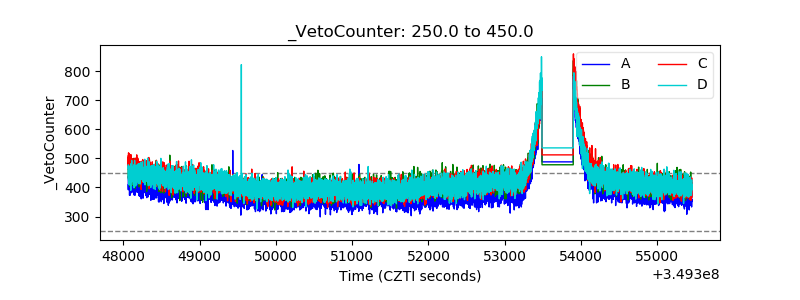 |