| Param | Original file | Final file |
|---|---|---|
| Filename | modeM0/AS1A10_121T01_9000004134_28824cztM0_level2.evt | modeM0/AS1A10_121T01_9000004134_28824cztM0_level2_quad_clean.evt |
| Size (bytes) | 791,046,720 | 97,776,000 |
| Size | 754.4 MB | 93.2 MB |
| Events in quadrant A | 3,509,337 | 650,709 |
| Events in quadrant B | 3,728,658 | 661,133 |
| Events in quadrant C | 4,715,788 | 626,530 |
| Events in quadrant D | 11,521,578 | 525,753 |
| Mode M0 | |||
|---|---|---|---|
| Quadrant | BADHDUFLAG | Total packets | Discarded packets |
| A | 0 | 15018 | 2 |
| B | 0 | 15594 | 2 |
| C | 0 | 18681 | 2 |
| D | 0 | 39198 | 2 |
| Mode SS | |||
|---|---|---|---|
| Quadrant | BADHDUFLAG | Total packets | Discarded packets |
| A | 0 | 144 | 0 |
| B | 0 | 144 | 0 |
| C | 0 | 144 | 0 |
| D | 0 | 144 | 0 |
| Quadrant | Total seconds | Saturated seconds | Saturation percentage |
|---|---|---|---|
| A | 7107 | 255 | 3.588012% |
| B | 7108 | 335 | 4.712999% |
| C | 7108 | 483 | 6.795160% |
| D | 7108 | 3300 | 46.426562% |
Noise dominated data is calculated using 1-second bins in cleaned event files. If a bin has >2000 counts, and if more than 50% of those come from <1% of pixels, then it is considered to be noise-dominated and hence unusable.
| Quadrant | # 1 sec bins | Bins with >0 counts | Bins with >2000 counts | High rate bins dominated by noise | Noise dominated (total time) | Noise dominated (detector-on time) | Marked lightcurve |
|---|---|---|---|---|---|---|---|
| A | 7177 | 7107 | 0 | 0 | 0.00% | 0.00% | 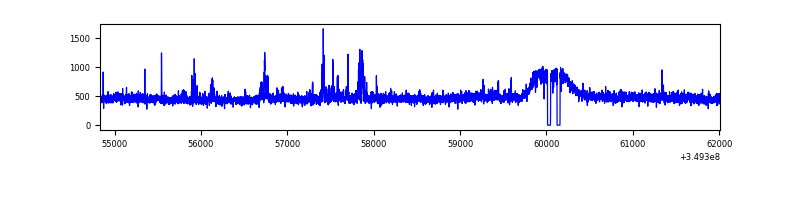 |
| B | 7178 | 7108 | 50 | 50 | 0.70% | 0.70% | 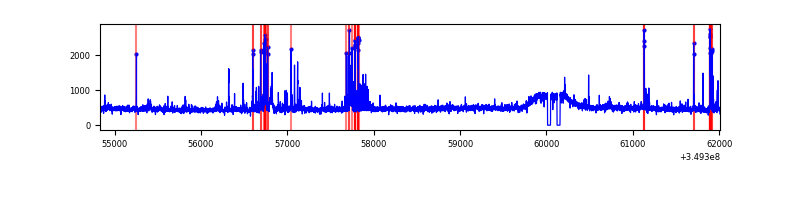 |
| C | 7178 | 7108 | 4 | 4 | 0.06% | 0.06% | 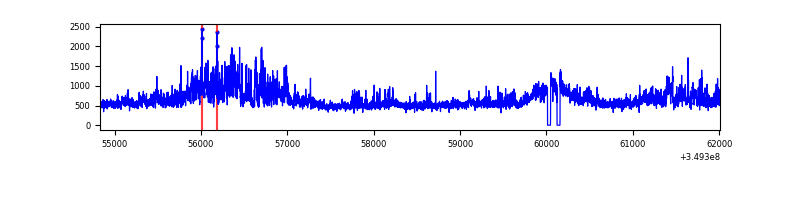 |
| D | 7178 | 7108 | 3161 | 3161 | 44.04% | 44.47% | 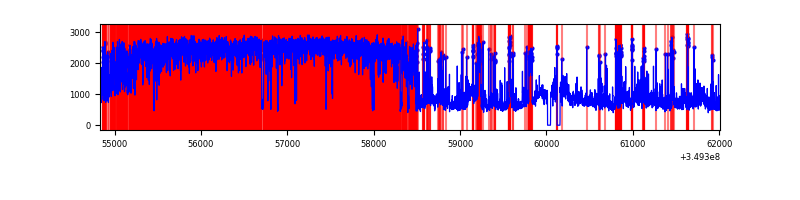 |
Top three noisy pixels from each quadrant. If the there are fewer than three noisy pixels in the level2.evt file, extra rows are filled as -1
| Pixel properties | Quadrant properties | ||||||
|---|---|---|---|---|---|---|---|
| Quadrant | DetID | PixID | Counts | Sigma | Mean | Median | Sigma |
| A | 14 | 235 | 119295 | 669.78 | 869 | 849 | 176.8 |
| A | 13 | 254 | 14716 | 78.41 | 869 | 849 | 176.8 |
| A | 14 | 239 | 11973 | 62.9 | 869 | 849 | 176.8 |
| B | 5 | 172 | 165839 | 1006.61 | 863 | 841 | 163.9 |
| B | 10 | 246 | 37236 | 222.03 | 863 | 841 | 163.9 |
| B | 15 | 33 | 34801 | 207.18 | 863 | 841 | 163.9 |
| C | 3 | 233 | 1173467 | 6021.75 | 827 | 830 | 194.7 |
| C | 14 | 238 | 186912 | 955.57 | 827 | 830 | 194.7 |
| C | 14 | 254 | 83830 | 426.22 | 827 | 830 | 194.7 |
| D | 8 | 195 | 6855275 | 38291.45 | 744 | 721 | 179.0 |
| D | 1 | 52 | 1349019 | 7531.97 | 744 | 721 | 179.0 |
| D | 13 | 104 | 284433 | 1584.89 | 744 | 721 | 179.0 |
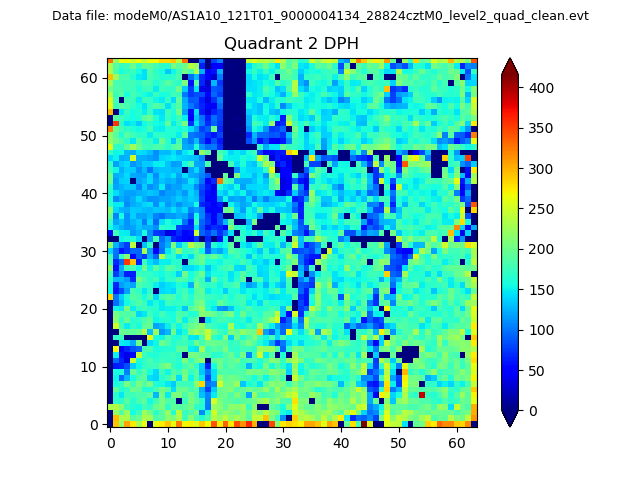
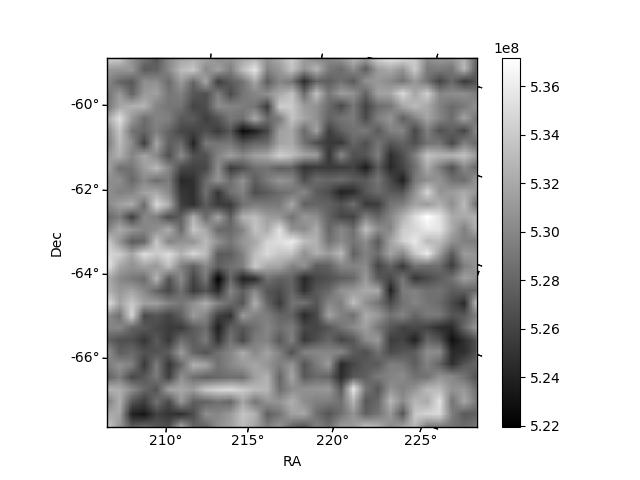
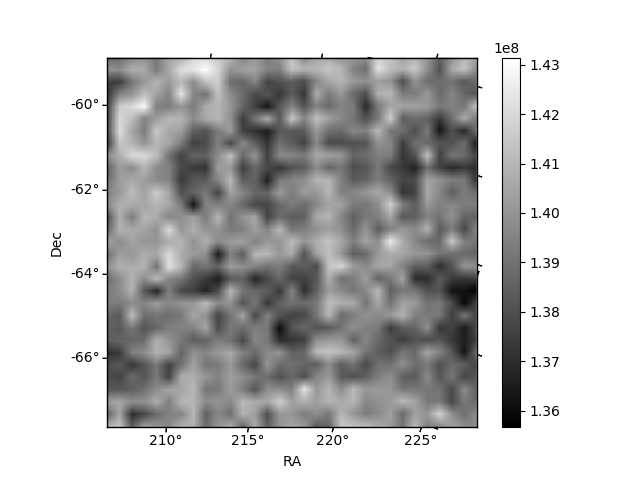
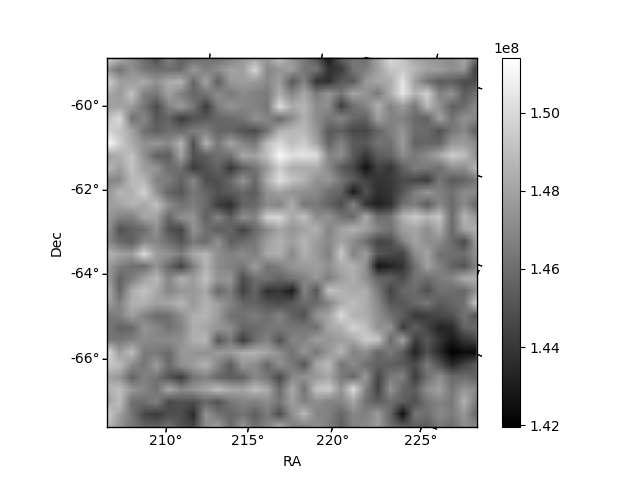
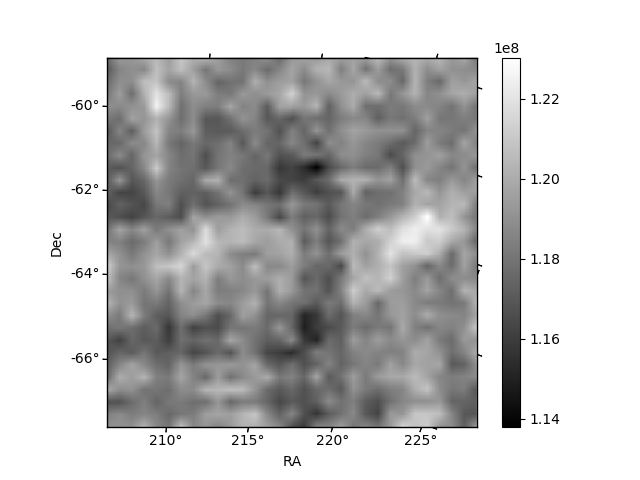
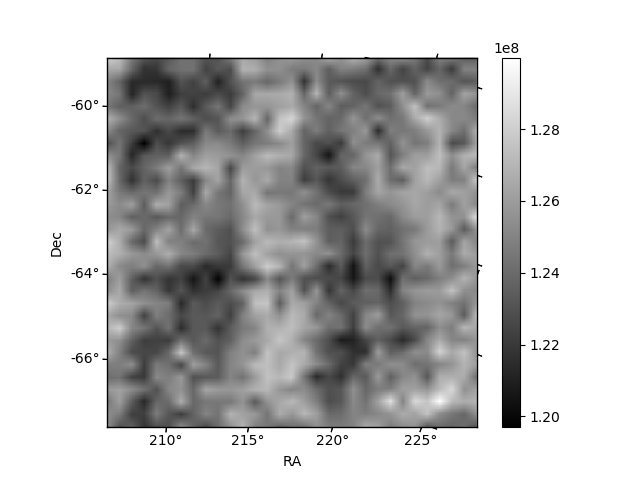
Histogram calculated using DETX and DETY for each event in the final _common_clean file
| Quadrant A | 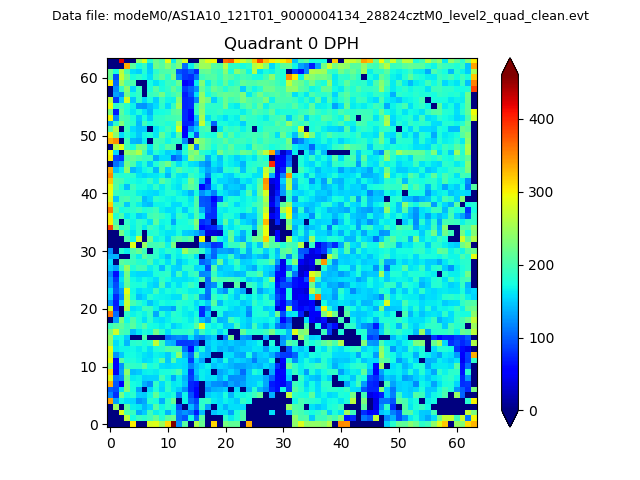 |
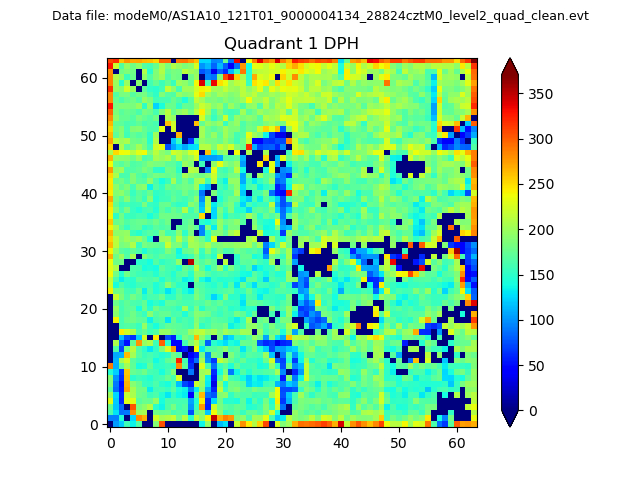 |
Quadrant B |
|---|---|---|---|
| Quadrant D | 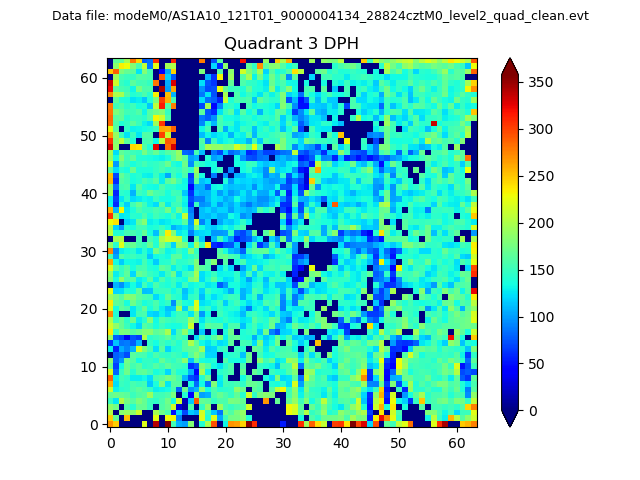 |
 |
Quadrant C |
| Plot type | Count rate plots | Images |
|---|---|---|
| Comparison with Poisson distribution Blue bars denote a histogram of data divided into 1 sec bins. Red curve is a Poisson curve with rate = median count rate of data. |
 |
 |
| Quadrant-wise count rates Data is divided into 100 sec bins |
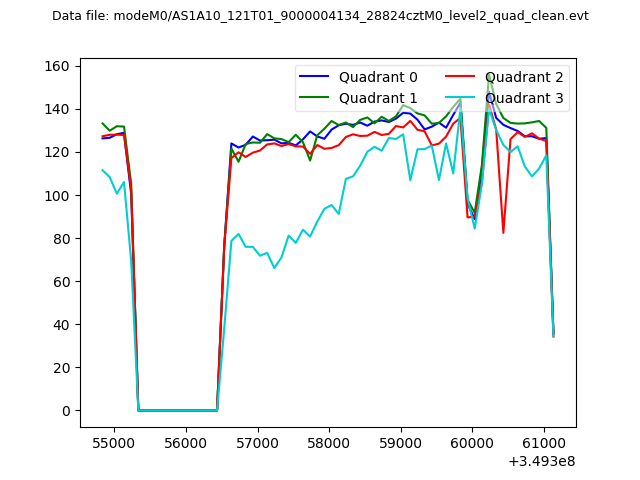 |
|
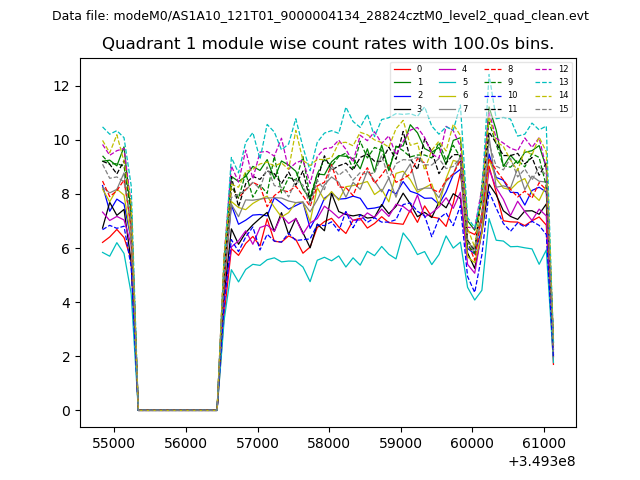
| Module-wise count rates for Quadrant A Data is divided into 100 sec bins |
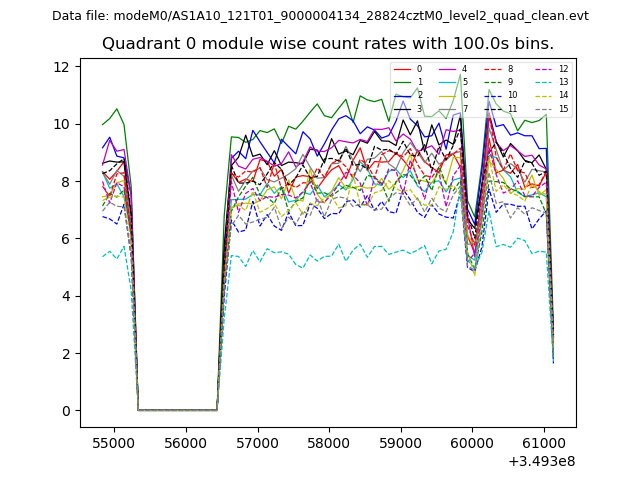 |
 |
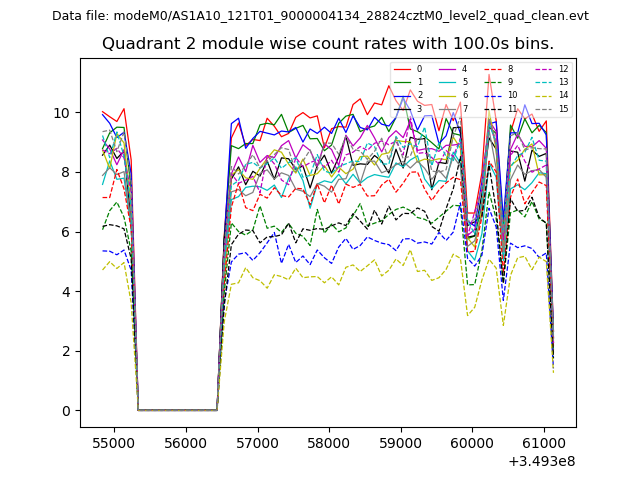
| Module-wise count rates for Quadrant B Data is divided into 100 sec bins |
 |
 |
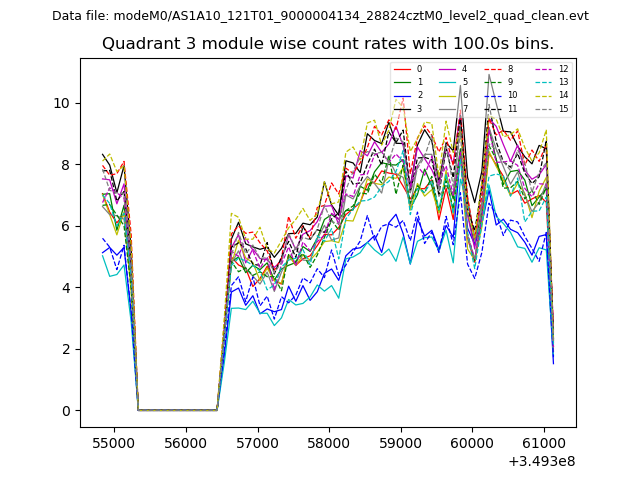
| Module-wise count rates for Quadrant C Data is divided into 100 sec bins |
 |
 |
| Module-wise count rates for Quadrant D Data is divided into 100 sec bins |
 |
 |
| Parameter | Plot |
|---|---|
| CZT HV Monitor |  |
| D_VDD | 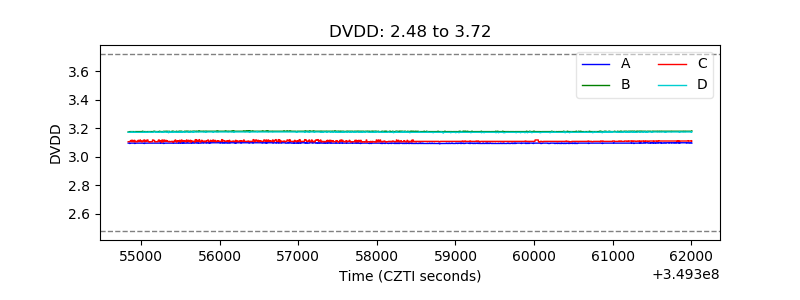 |
| Temperature 1 | 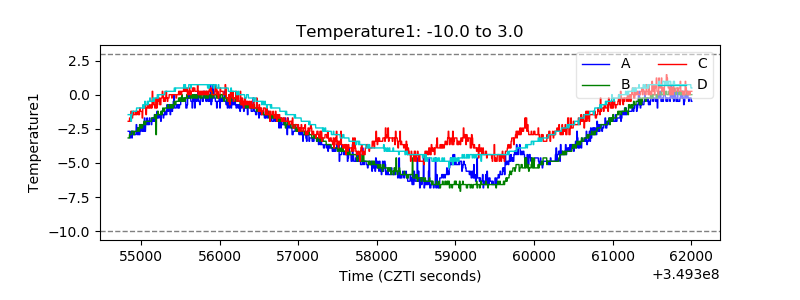 |
| Veto HV Monitor | 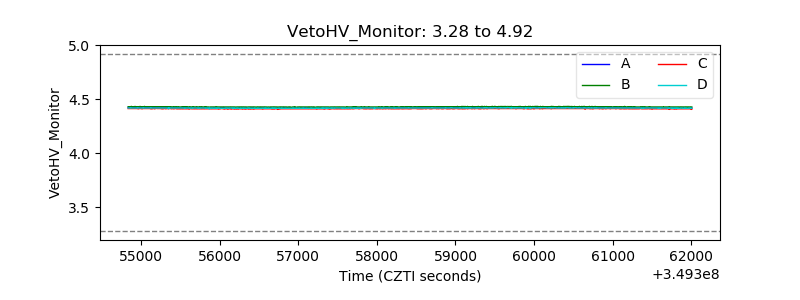 |
| Veto LLD | 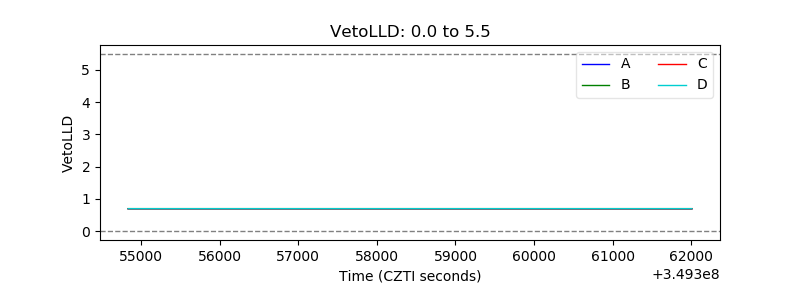 |
| Alpha Counter |  |
| _CPM_Rate | 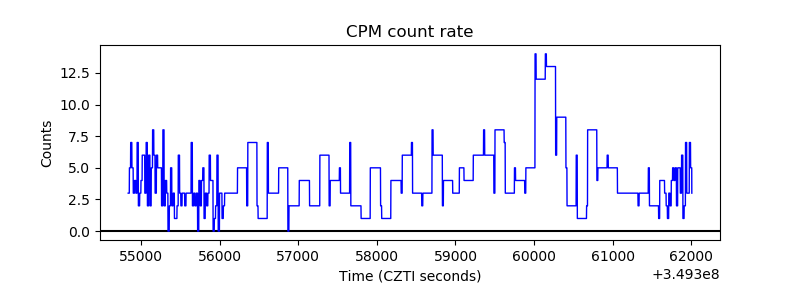 |
| CZT Counter | 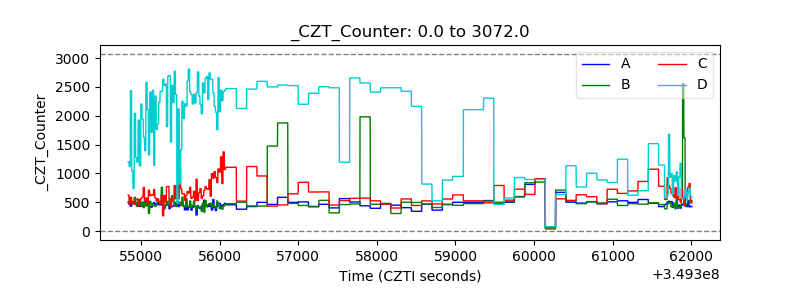 |
| +2.5 Volts monitor |  |
| +5 Volts monitor |  |
| _ROLL_ROT | 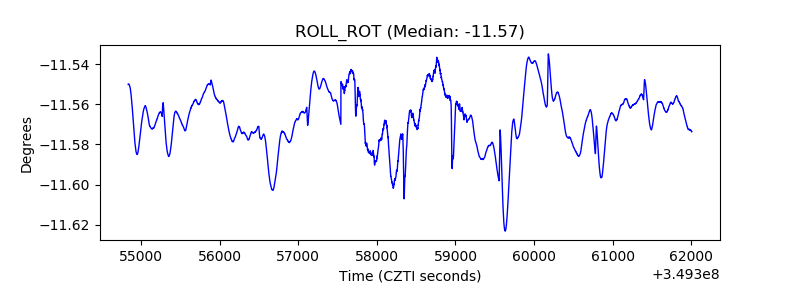 |
| _Roll_DEC | 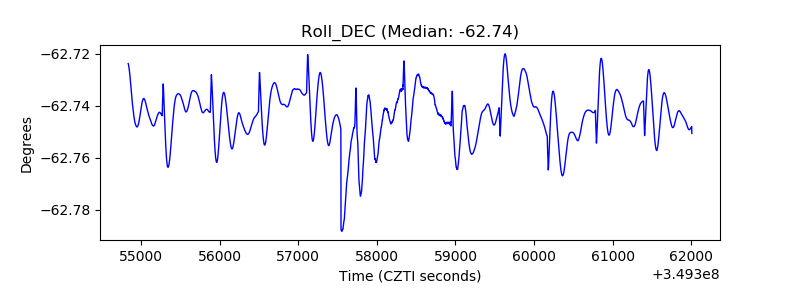 |
| _Roll_RA | 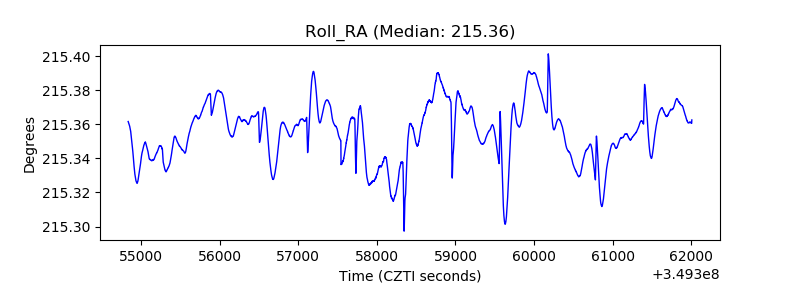 |
| Veto Counter | 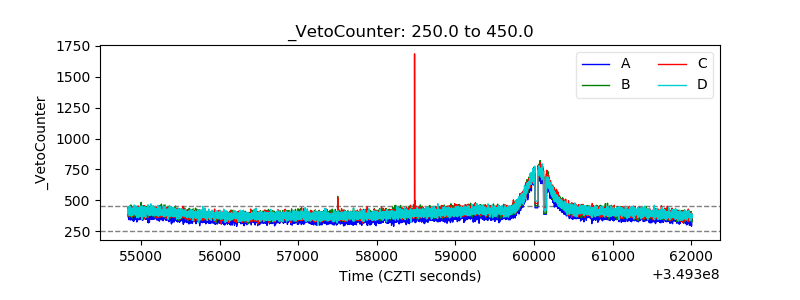 |