| Param | Original file | Final file |
|---|---|---|
| Filename | modeM0/AS1A10_121T01_9000004134_28825cztM0_level2.evt | modeM0/AS1A10_121T01_9000004134_28825cztM0_level2_quad_clean.evt |
| Size (bytes) | 816,883,200 | 90,771,840 |
| Size | 779.0 MB | 86.6 MB |
| Events in quadrant A | 3,513,806 | 603,721 |
| Events in quadrant B | 4,389,072 | 603,388 |
| Events in quadrant C | 4,540,470 | 580,359 |
| Events in quadrant D | 11,809,476 | 459,121 |
| Mode M9 | |||
|---|---|---|---|
| Quadrant | BADHDUFLAG | Total packets | Discarded packets |
| A | 0 | 2 | 0 |
| B | 0 | 2 | 0 |
| C | 0 | 2 | 0 |
| D | 0 | 2 | 0 |
| Mode M0 | |||
|---|---|---|---|
| Quadrant | BADHDUFLAG | Total packets | Discarded packets |
| A | 0 | 15017 | 1 |
| B | 0 | 17633 | 1 |
| C | 0 | 18188 | 2 |
| D | 0 | 40225 | 1 |
| Mode SS | |||
|---|---|---|---|
| Quadrant | BADHDUFLAG | Total packets | Discarded packets |
| A | 0 | 146 | 0 |
| B | 0 | 146 | 0 |
| C | 0 | 146 | 0 |
| D | 0 | 146 | 0 |
| Quadrant | Total seconds | Saturated seconds | Saturation percentage |
|---|---|---|---|
| A | 7192 | 157 | 2.182981% |
| B | 7193 | 494 | 6.867788% |
| C | 7192 | 373 | 5.186318% |
| D | 7192 | 3427 | 47.650167% |
Noise dominated data is calculated using 1-second bins in cleaned event files. If a bin has >2000 counts, and if more than 50% of those come from <1% of pixels, then it is considered to be noise-dominated and hence unusable.
| Quadrant | # 1 sec bins | Bins with >0 counts | Bins with >2000 counts | High rate bins dominated by noise | Noise dominated (total time) | Noise dominated (detector-on time) | Marked lightcurve |
|---|---|---|---|---|---|---|---|
| A | 7402 | 7192 | 11 | 11 | 0.15% | 0.15% | 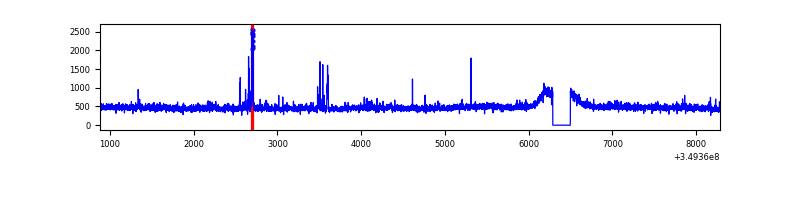 |
| B | 7403 | 7193 | 283 | 283 | 3.82% | 3.93% | 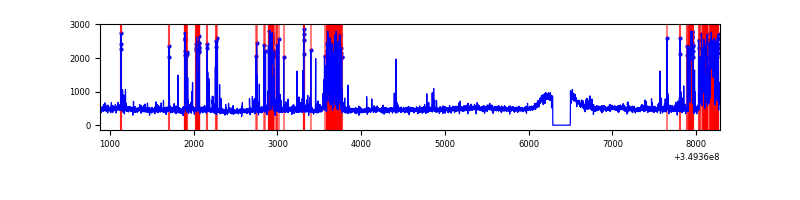 |
| C | 7402 | 7192 | 1 | 1 | 0.01% | 0.01% | 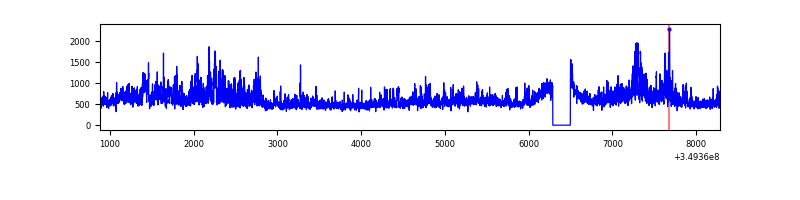 |
| D | 7402 | 7192 | 3242 | 3242 | 43.80% | 45.08% | 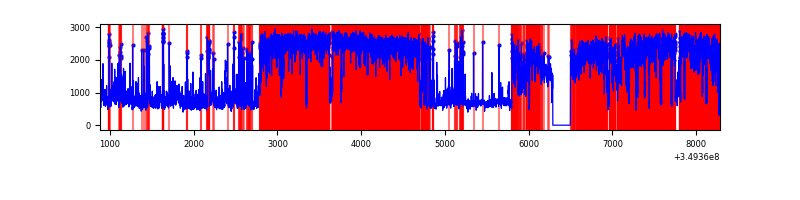 |
Top three noisy pixels from each quadrant. If the there are fewer than three noisy pixels in the level2.evt file, extra rows are filled as -1
| Pixel properties | Quadrant properties | ||||||
|---|---|---|---|---|---|---|---|
| Quadrant | DetID | PixID | Counts | Sigma | Mean | Median | Sigma |
| A | 14 | 235 | 65078 | 365.01 | 870 | 851 | 176.0 |
| A | 0 | 13 | 49860 | 278.52 | 870 | 851 | 176.0 |
| A | 13 | 254 | 14507 | 77.61 | 870 | 851 | 176.0 |
| B | 5 | 172 | 942994 | 5863.36 | 845 | 822 | 160.7 |
| B | 10 | 246 | 26644 | 160.7 | 845 | 822 | 160.7 |
| B | 5 | 255 | 24654 | 148.31 | 845 | 822 | 160.7 |
| C | 3 | 233 | 998476 | 5162.48 | 826 | 831 | 193.2 |
| C | 14 | 238 | 179747 | 925.83 | 826 | 831 | 193.2 |
| C | 14 | 254 | 72889 | 372.88 | 826 | 831 | 193.2 |
| D | 8 | 195 | 7467378 | 43197.07 | 724 | 702 | 172.9 |
| D | 1 | 52 | 986183 | 5701.32 | 724 | 702 | 172.9 |
| D | 7 | 38 | 217939 | 1256.78 | 724 | 702 | 172.9 |
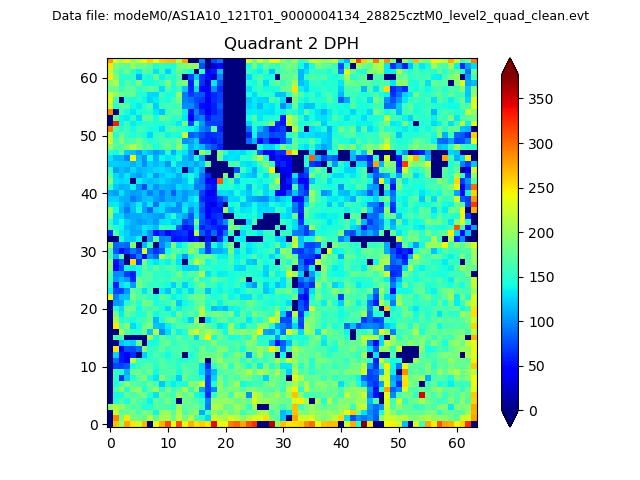
Histogram calculated using DETX and DETY for each event in the final _common_clean file
| Quadrant A | 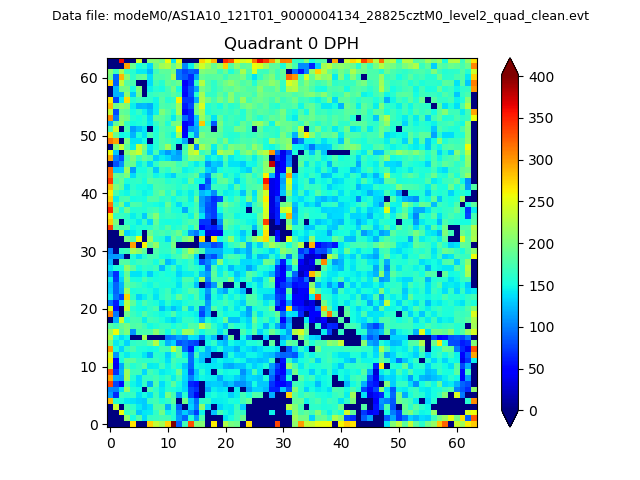 |
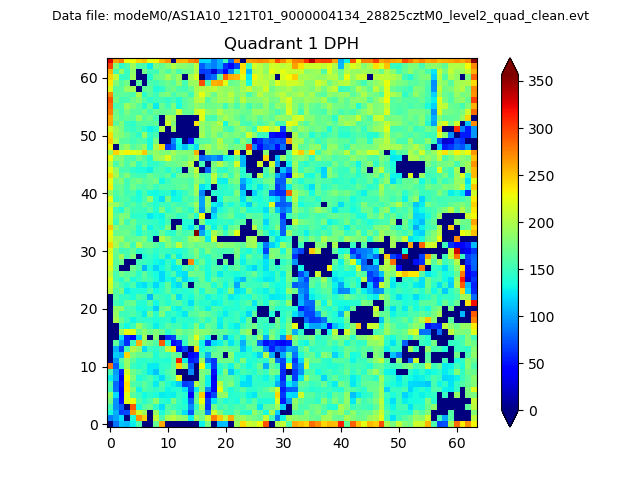 |
Quadrant B |
|---|---|---|---|
| Quadrant D | 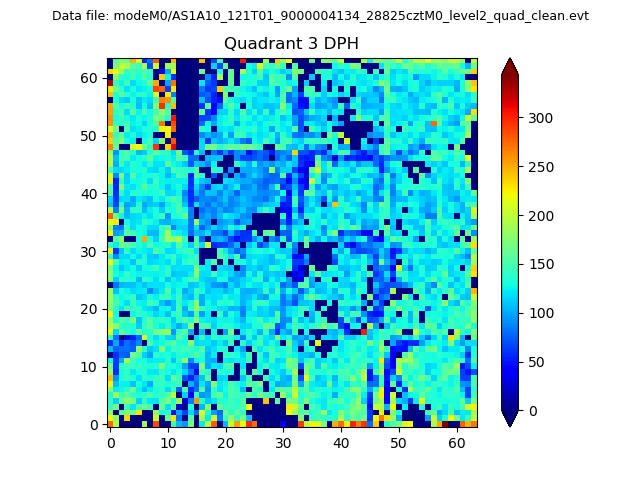 |
 |
Quadrant C |
| Plot type | Count rate plots | Images |
|---|---|---|
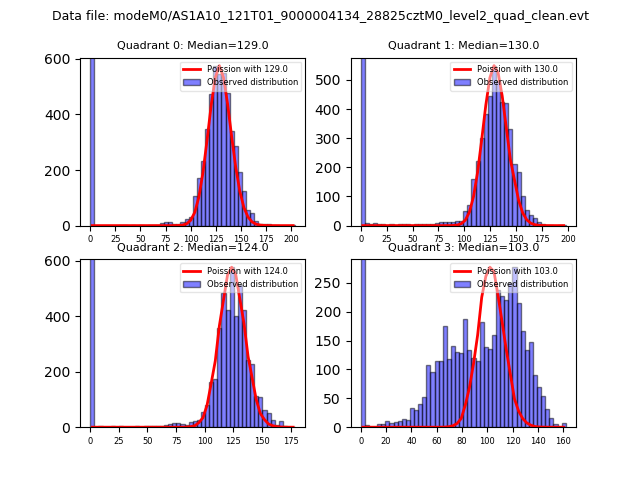
| Comparison with Poisson distribution Blue bars denote a histogram of data divided into 1 sec bins. Red curve is a Poisson curve with rate = median count rate of data. |
 |
 |
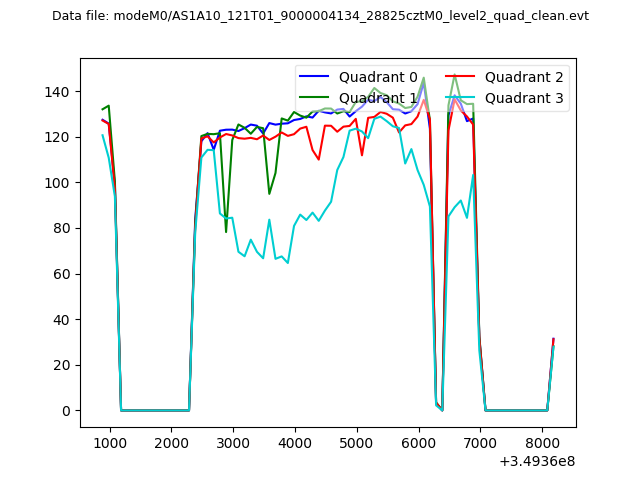
| Quadrant-wise count rates Data is divided into 100 sec bins |
 |
|
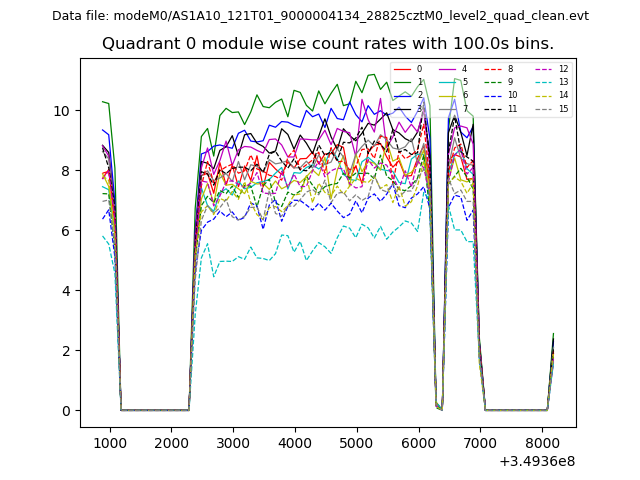
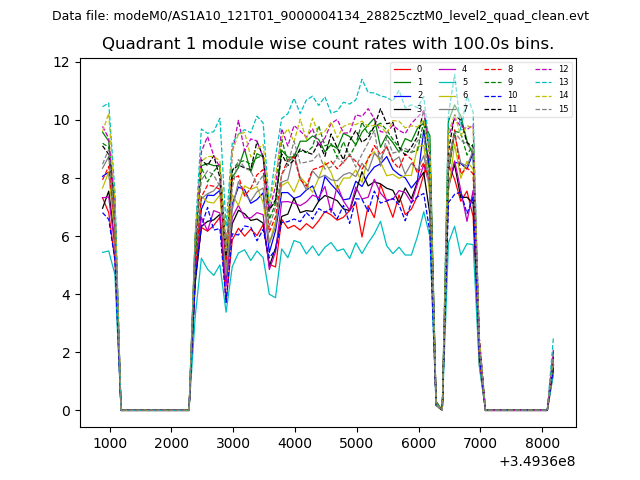
| Module-wise count rates for Quadrant A Data is divided into 100 sec bins |
 |
 |
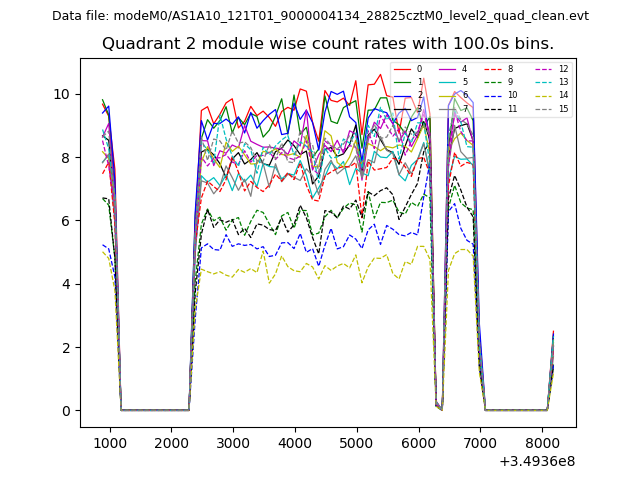
| Module-wise count rates for Quadrant B Data is divided into 100 sec bins |
 |
 |
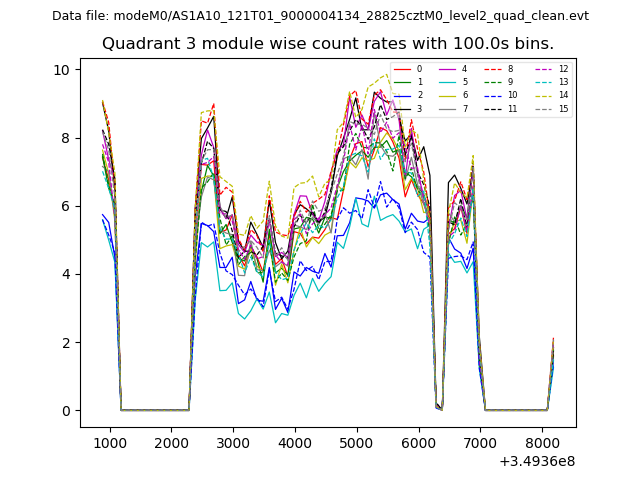
| Module-wise count rates for Quadrant C Data is divided into 100 sec bins |
 |
 |
| Module-wise count rates for Quadrant D Data is divided into 100 sec bins |
 |
 |
| Parameter | Plot |
|---|---|
| CZT HV Monitor |  |
| D_VDD | 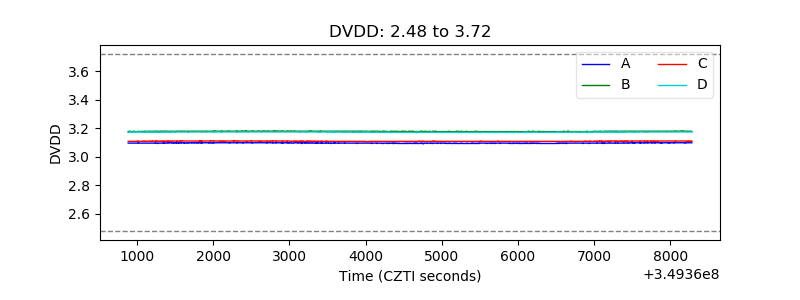 |
| Temperature 1 | 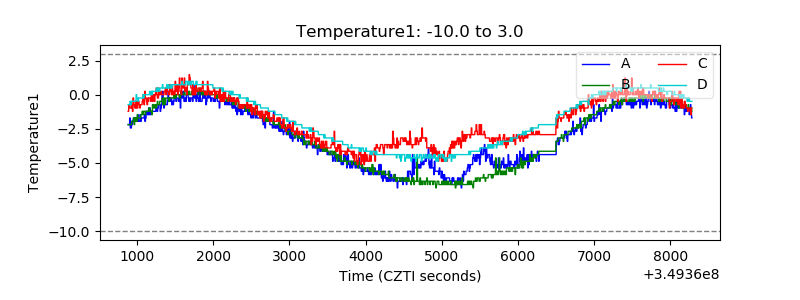 |
| Veto HV Monitor | 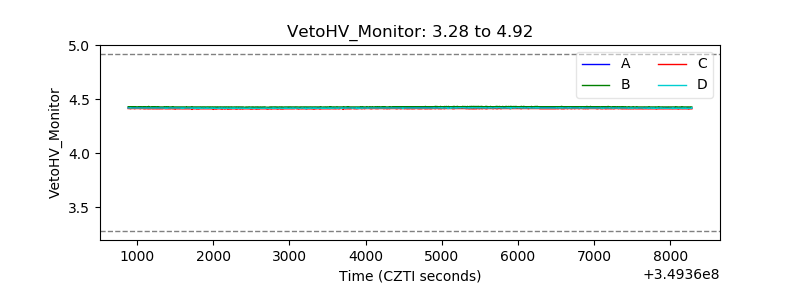 |
| Veto LLD | 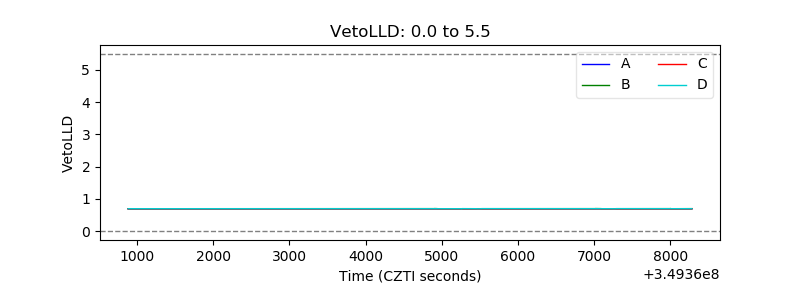 |
| Alpha Counter |  |
| _CPM_Rate | 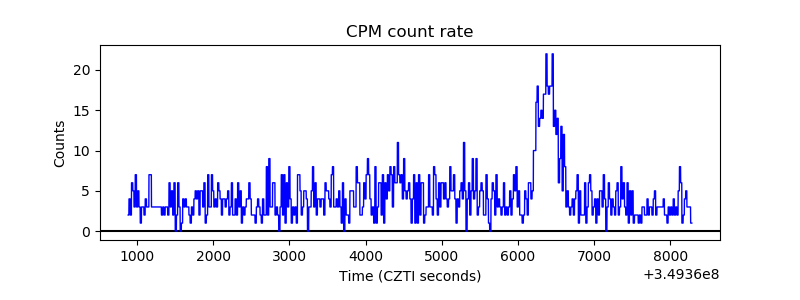 |
| CZT Counter | 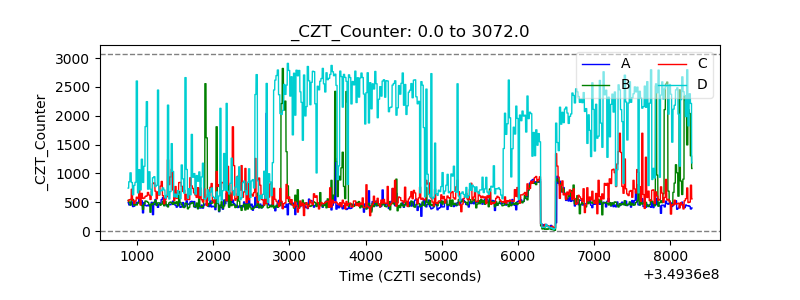 |
| +2.5 Volts monitor |  |
| +5 Volts monitor |  |
| _ROLL_ROT | 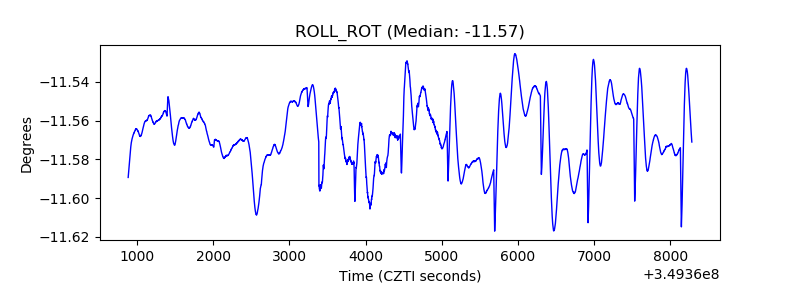 |
| _Roll_DEC | 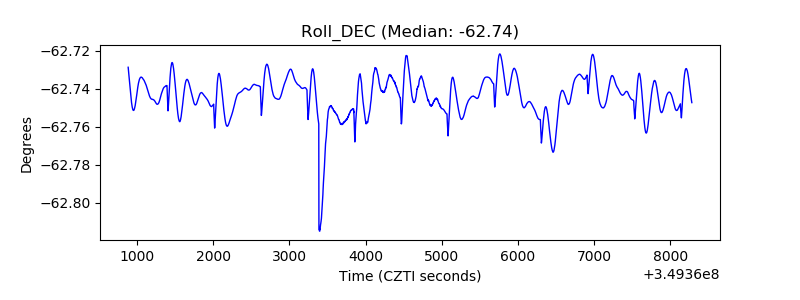 |
| _Roll_RA |  |
| Veto Counter | 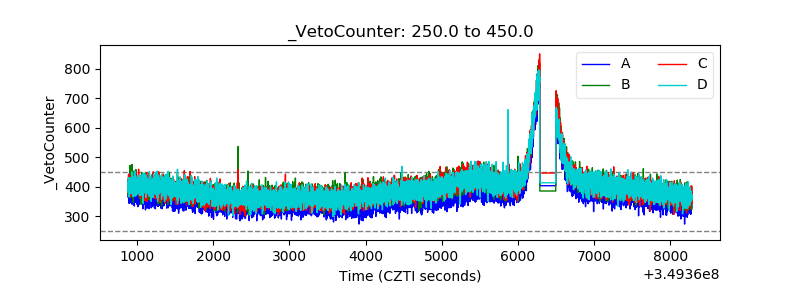 |