| Param | Original file | Final file |
|---|---|---|
| Filename | modeM0/AS1A10_121T01_9000004134_28828cztM0_level2.evt | modeM0/AS1A10_121T01_9000004134_28828cztM0_level2_quad_clean.evt |
| Size (bytes) | 2,216,721,600 | 259,493,760 |
| Size | 2.1 GB | 247.5 MB |
| Events in quadrant A | 8,786,368 | 1,813,982 |
| Events in quadrant B | 9,672,584 | 1,831,164 |
| Events in quadrant C | 10,426,319 | 1,746,174 |
| Events in quadrant D | 37,044,105 | 1,230,198 |
| Mode M9 | |||
|---|---|---|---|
| Quadrant | BADHDUFLAG | Total packets | Discarded packets |
| A | 0 | 18 | 0 |
| B | 0 | 18 | 0 |
| C | 0 | 18 | 0 |
| D | 0 | 18 | 0 |
| Mode M0 | |||
|---|---|---|---|
| Quadrant | BADHDUFLAG | Total packets | Discarded packets |
| A | 0 | 37767 | 3 |
| B | 0 | 40282 | 3 |
| C | 0 | 42592 | 3 |
| D | 0 | 122367 | 3 |
| Mode SS | |||
|---|---|---|---|
| Quadrant | BADHDUFLAG | Total packets | Discarded packets |
| A | 0 | 366 | 0 |
| B | 0 | 366 | 0 |
| C | 0 | 366 | 0 |
| D | 0 | 366 | 0 |
| Quadrant | Total seconds | Saturated seconds | Saturation percentage |
|---|---|---|---|
| A | 17893 | 177 | 0.989214% |
| B | 17894 | 539 | 3.012183% |
| C | 17894 | 548 | 3.062479% |
| D | 17894 | 11963 | 66.854812% |
Noise dominated data is calculated using 1-second bins in cleaned event files. If a bin has >2000 counts, and if more than 50% of those come from <1% of pixels, then it is considered to be noise-dominated and hence unusable.
| Quadrant | # 1 sec bins | Bins with >0 counts | Bins with >2000 counts | High rate bins dominated by noise | Noise dominated (total time) | Noise dominated (detector-on time) | Marked lightcurve |
|---|---|---|---|---|---|---|---|
| A | 19753 | 17893 | 11 | 11 | 0.06% | 0.06% | 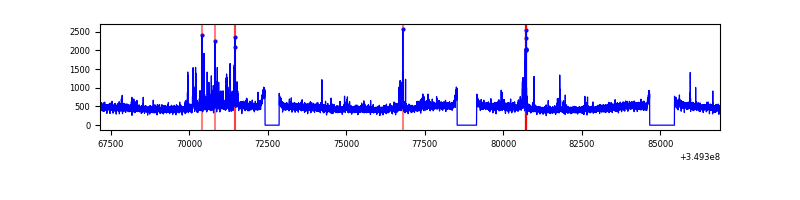 |
| B | 19754 | 17894 | 281 | 281 | 1.42% | 1.57% | 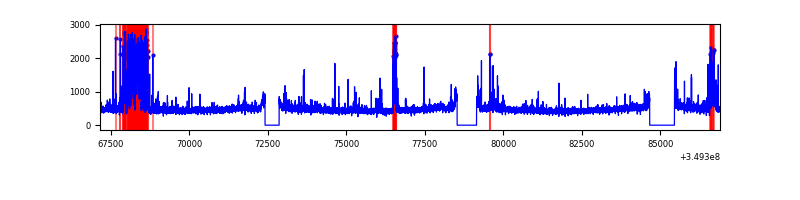 |
| C | 19754 | 17894 | 2 | 2 | 0.01% | 0.01% | 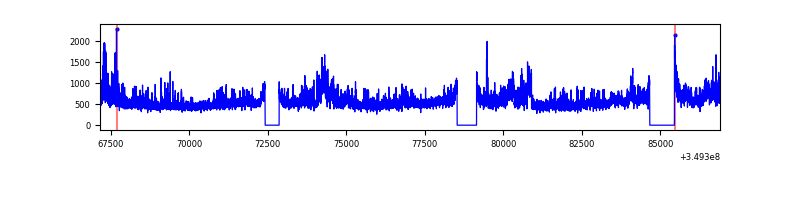 |
| D | 19753 | 17893 | 11674 | 11674 | 59.10% | 65.24% | 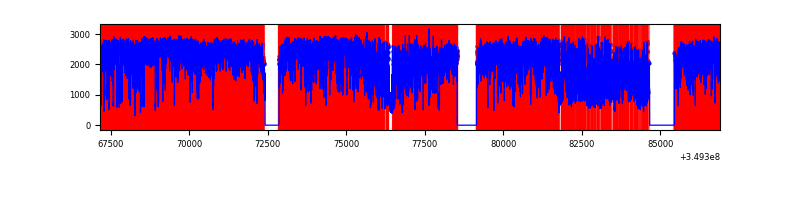 |
Top three noisy pixels from each quadrant. If the there are fewer than three noisy pixels in the level2.evt file, extra rows are filled as -1
| Pixel properties | Quadrant properties | ||||||
|---|---|---|---|---|---|---|---|
| Quadrant | DetID | PixID | Counts | Sigma | Mean | Median | Sigma |
| A | 14 | 235 | 511023 | 1195.22 | 2131 | 2082 | 425.8 |
| A | 13 | 254 | 36534 | 80.91 | 2131 | 2082 | 425.8 |
| A | 3 | 137 | 20274 | 42.72 | 2131 | 2082 | 425.8 |
| B | 5 | 172 | 880361 | 2221.32 | 2111 | 2060 | 395.4 |
| B | 5 | 255 | 165143 | 412.46 | 2111 | 2060 | 395.4 |
| B | 10 | 245 | 143228 | 357.03 | 2111 | 2060 | 395.4 |
| C | 3 | 233 | 1851454 | 3885.93 | 2036 | 2047 | 475.9 |
| C | 14 | 238 | 421214 | 880.74 | 2036 | 2047 | 475.9 |
| C | 14 | 254 | 143485 | 297.19 | 2036 | 2047 | 475.9 |
| D | 8 | 195 | 19558852 | 52371.61 | 1559 | 1515 | 373.4 |
| D | 1 | 52 | 9557885 | 25590.52 | 1559 | 1515 | 373.4 |
| D | 13 | 104 | 1526181 | 4082.83 | 1559 | 1515 | 373.4 |
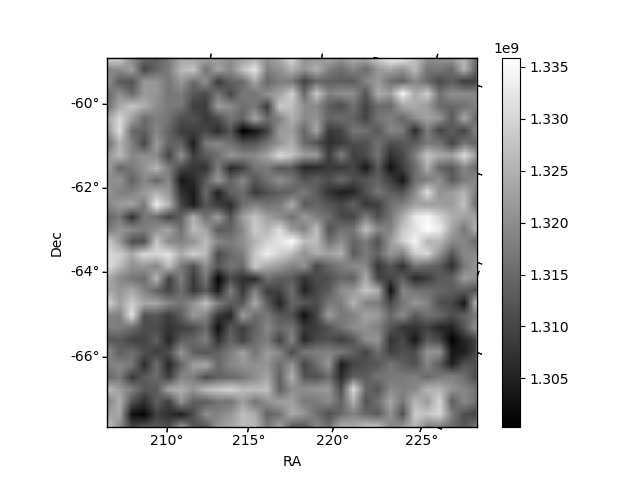
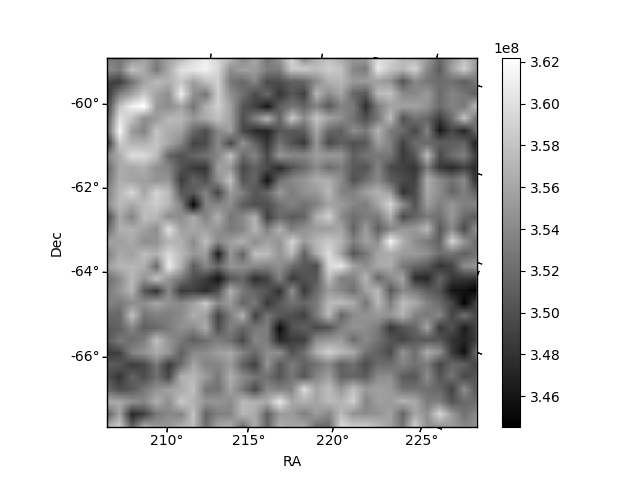
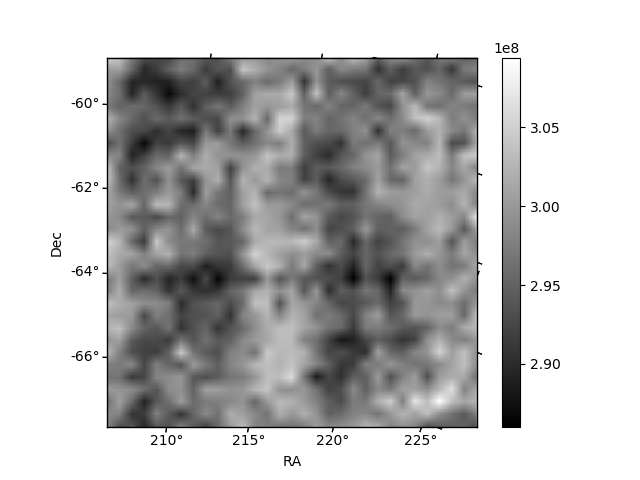
Histogram calculated using DETX and DETY for each event in the final _common_clean file
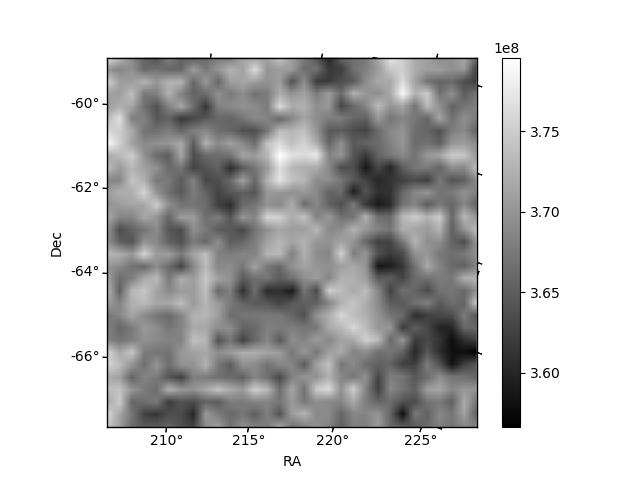
| Quadrant A | 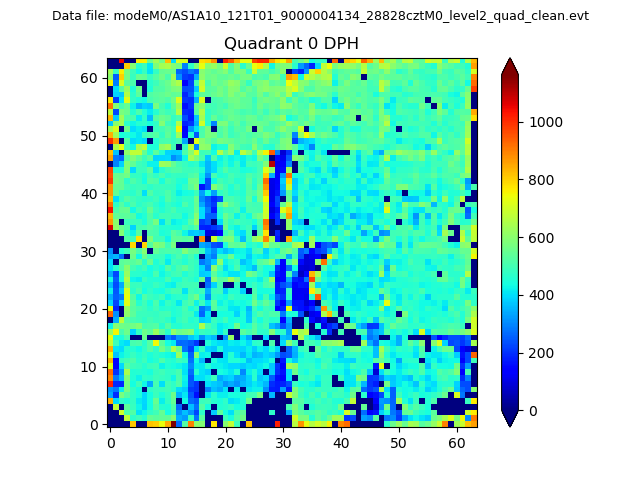 |
 |
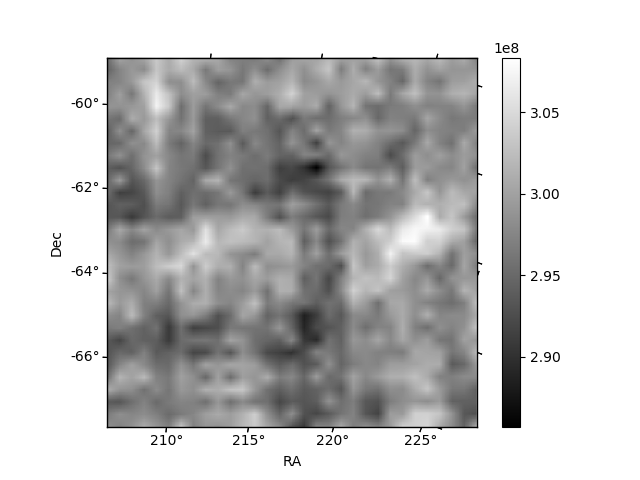
Quadrant B |
|---|---|---|---|
| Quadrant D | 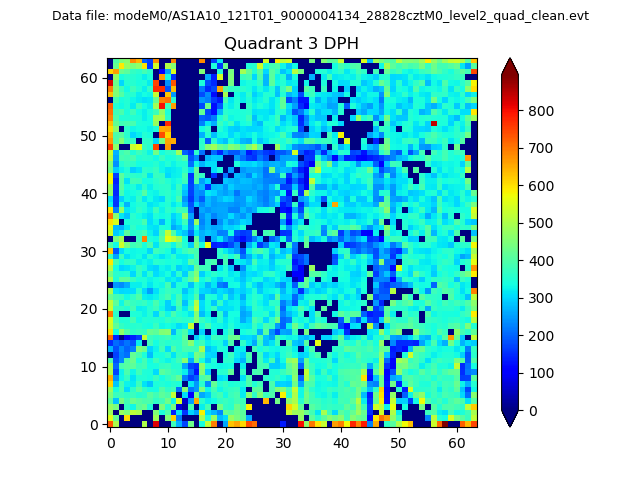 |
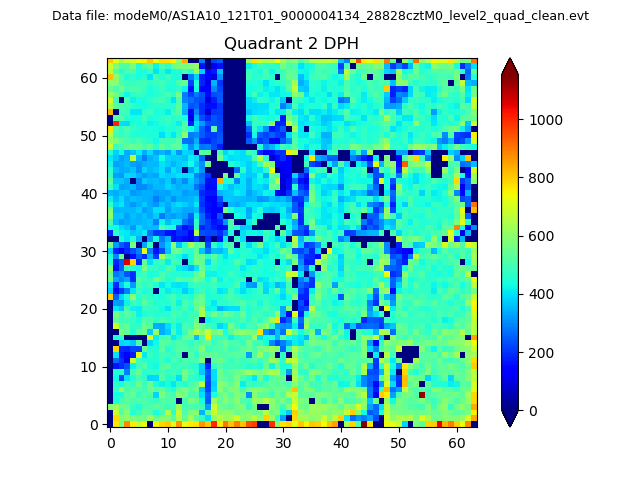 |
Quadrant C |
| Plot type | Count rate plots | Images |
|---|---|---|
| Comparison with Poisson distribution Blue bars denote a histogram of data divided into 1 sec bins. Red curve is a Poisson curve with rate = median count rate of data. |
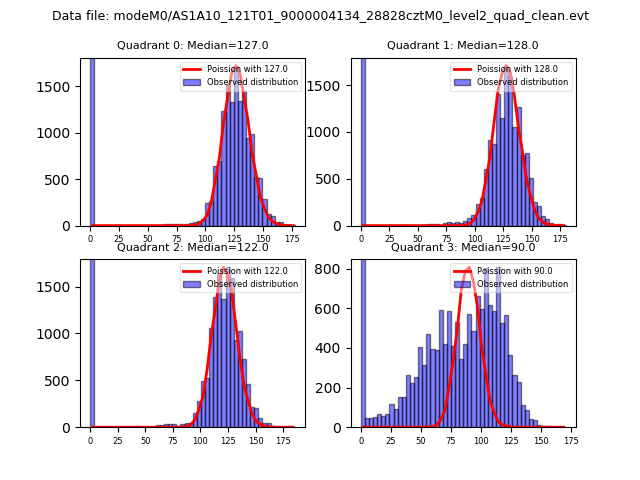 |
 |
| Quadrant-wise count rates Data is divided into 100 sec bins |
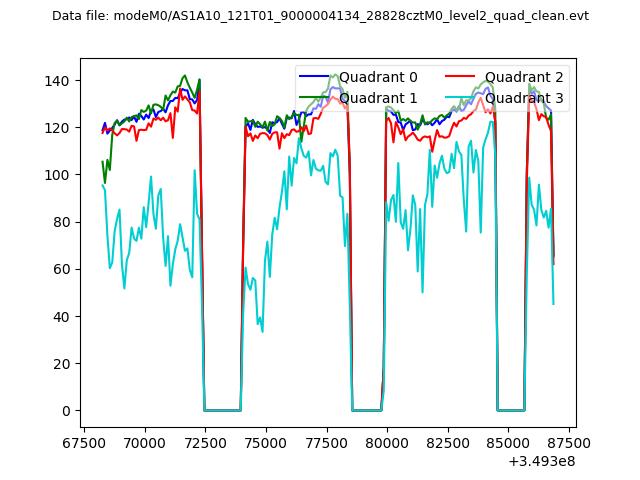 |
|
| Module-wise count rates for Quadrant A Data is divided into 100 sec bins |
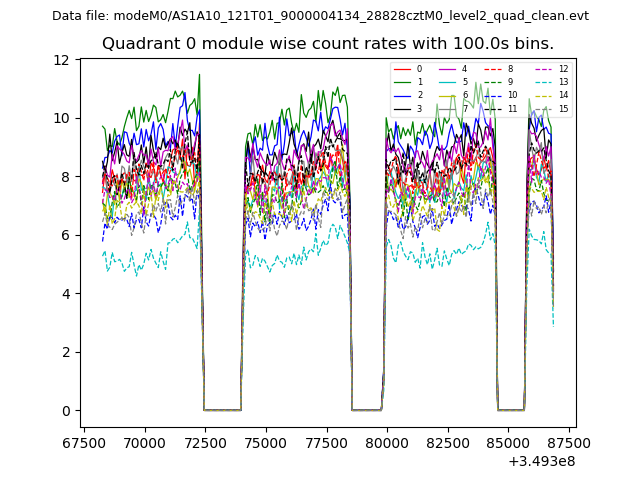 |
 |
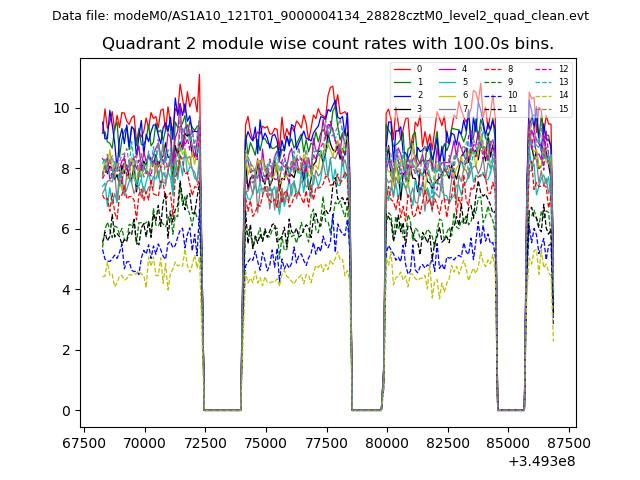
| Module-wise count rates for Quadrant B Data is divided into 100 sec bins |
 |
 |
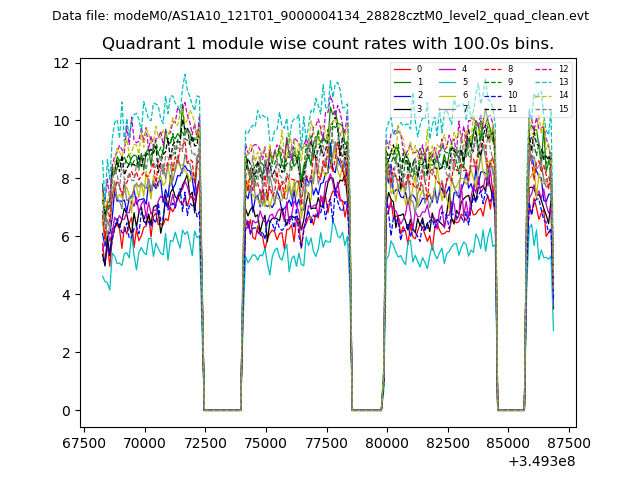
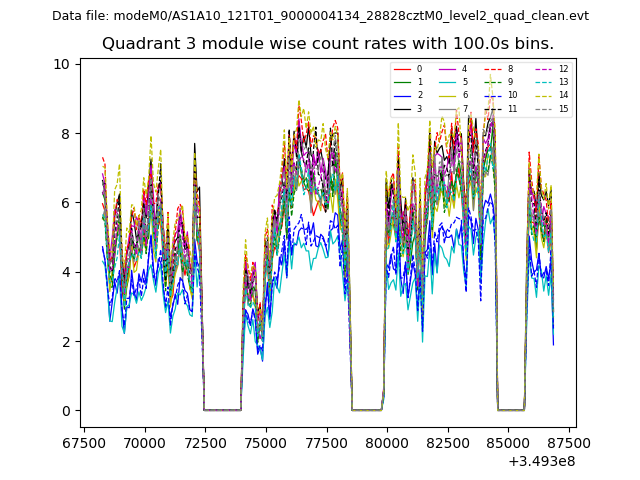
| Module-wise count rates for Quadrant C Data is divided into 100 sec bins |
 |
 |
| Module-wise count rates for Quadrant D Data is divided into 100 sec bins |
 |
 |
| Parameter | Plot |
|---|---|
| CZT HV Monitor | 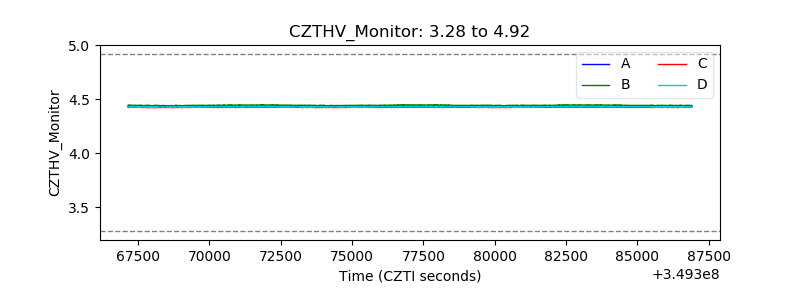 |
| D_VDD | 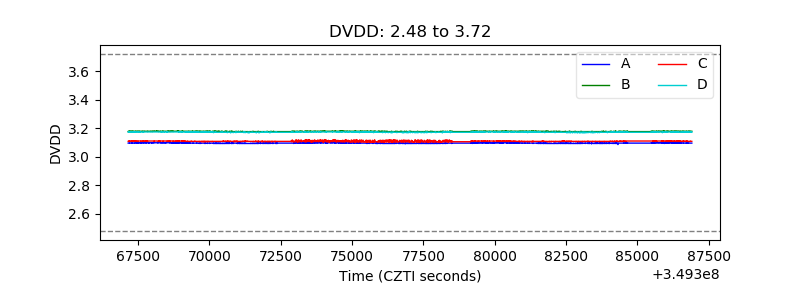 |
| Temperature 1 | 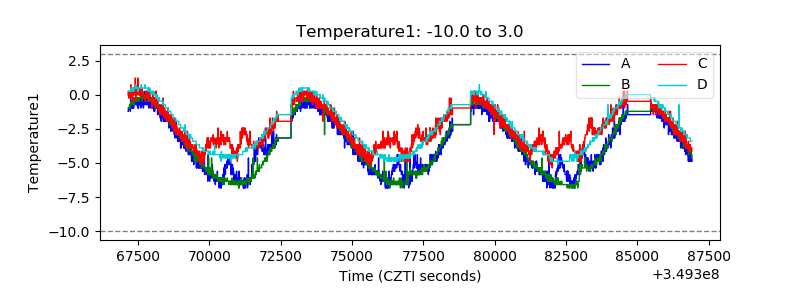 |
| Veto HV Monitor | 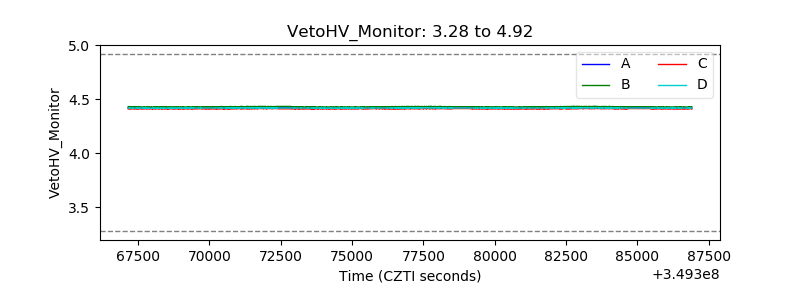 |
| Veto LLD | 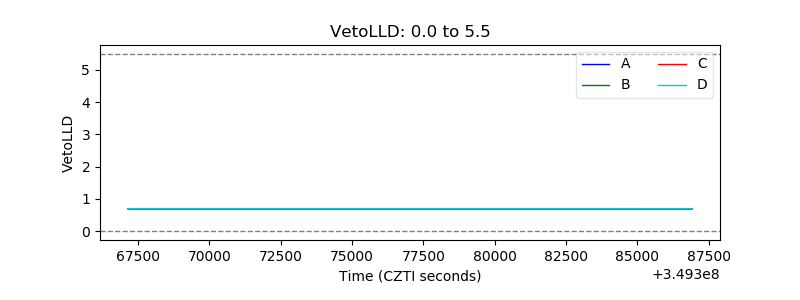 |
| Alpha Counter | 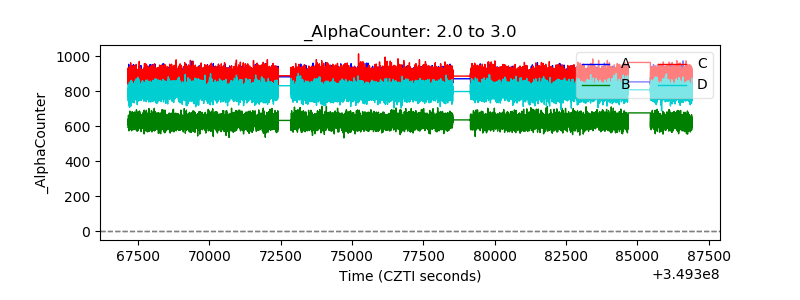 |
| _CPM_Rate |  |
| CZT Counter | 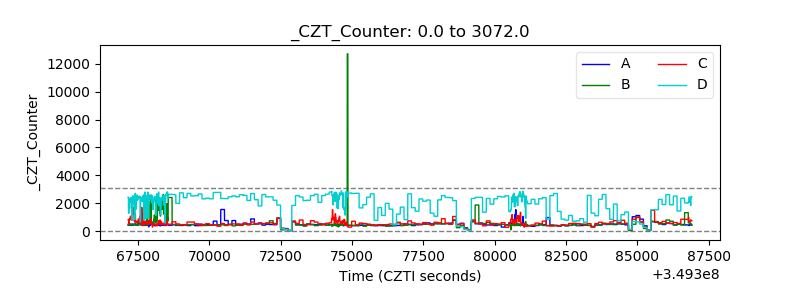 |
| +2.5 Volts monitor | 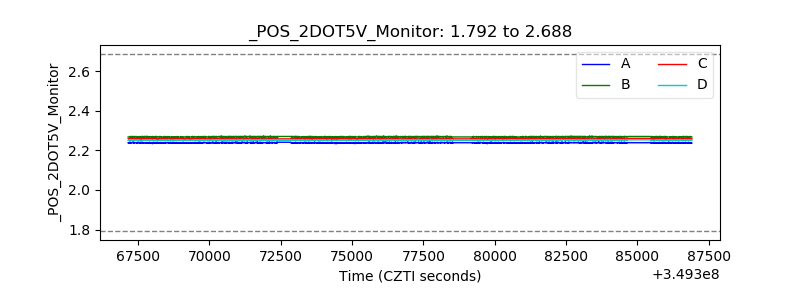 |
| +5 Volts monitor | 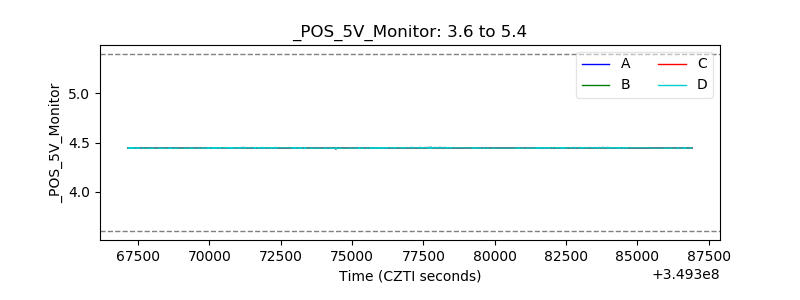 |
| _ROLL_ROT | 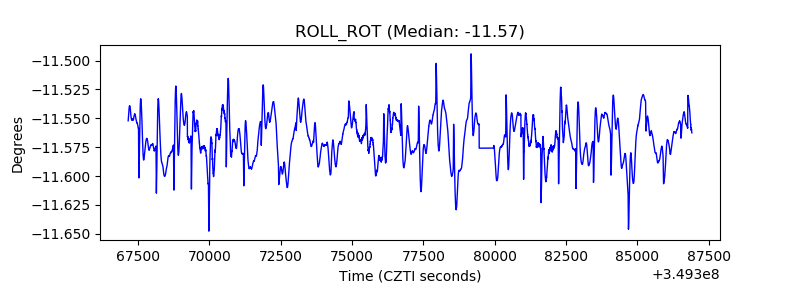 |
| _Roll_DEC |  |
| _Roll_RA | 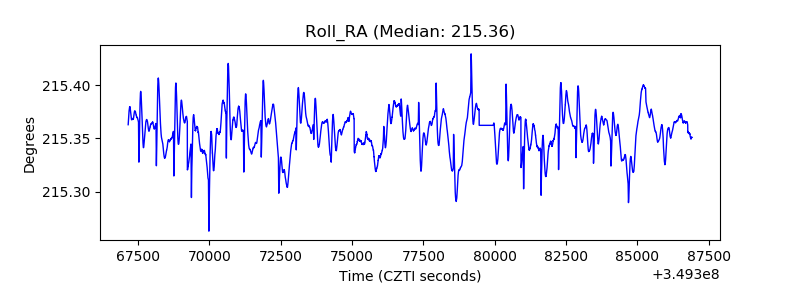 |
| Veto Counter | 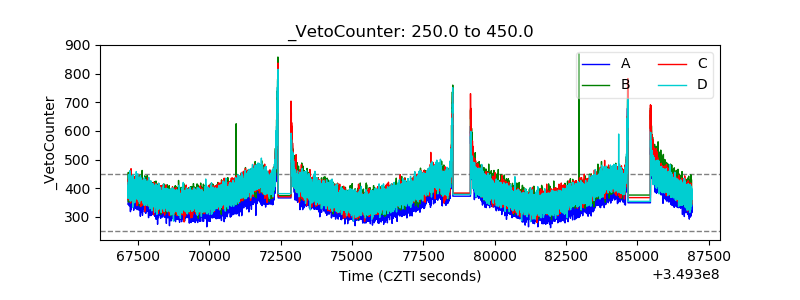 |