| Param | Original file | Final file |
|---|---|---|
| Filename | modeM0/AS1A10_121T01_9000004134_28829cztM0_level2.evt | modeM0/AS1A10_121T01_9000004134_28829cztM0_level2_quad_clean.evt |
| Size (bytes) | 797,158,080 | 111,107,520 |
| Size | 760.2 MB | 106.0 MB |
| Events in quadrant A | 3,208,504 | 775,627 |
| Events in quadrant B | 3,590,134 | 787,781 |
| Events in quadrant C | 5,566,617 | 732,689 |
| Events in quadrant D | 11,321,348 | 597,420 |
| Mode M9 | |||
|---|---|---|---|
| Quadrant | BADHDUFLAG | Total packets | Discarded packets |
| A | 0 | 17 | 0 |
| B | 0 | 17 | 0 |
| C | 0 | 17 | 0 |
| D | 0 | 17 | 0 |
| Mode M0 | |||
|---|---|---|---|
| Quadrant | BADHDUFLAG | Total packets | Discarded packets |
| A | 0 | 13880 | 2 |
| B | 0 | 15045 | 2 |
| C | 0 | 21407 | 2 |
| D | 0 | 38319 | 2 |
| Mode SS | |||
|---|---|---|---|
| Quadrant | BADHDUFLAG | Total packets | Discarded packets |
| A | 0 | 140 | 0 |
| B | 0 | 140 | 0 |
| C | 0 | 140 | 0 |
| D | 0 | 140 | 0 |
| Quadrant | Total seconds | Saturated seconds | Saturation percentage |
|---|---|---|---|
| A | 6745 | 41 | 0.607858% |
| B | 6746 | 130 | 1.927068% |
| C | 6746 | 345 | 5.114142% |
| D | 6746 | 2657 | 39.386303% |
Noise dominated data is calculated using 1-second bins in cleaned event files. If a bin has >2000 counts, and if more than 50% of those come from <1% of pixels, then it is considered to be noise-dominated and hence unusable.
| Quadrant | # 1 sec bins | Bins with >0 counts | Bins with >2000 counts | High rate bins dominated by noise | Noise dominated (total time) | Noise dominated (detector-on time) | Marked lightcurve |
|---|---|---|---|---|---|---|---|
| A | 8515 | 6746 | 0 | 0 | 0.00% | 0.00% | 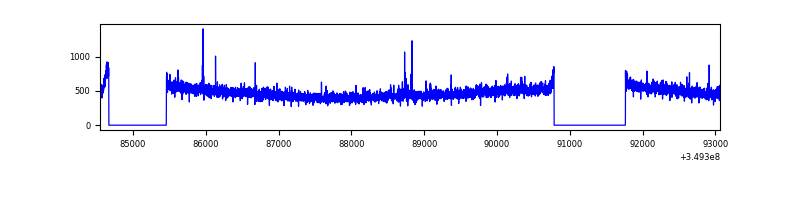 |
| B | 8516 | 6747 | 42 | 42 | 0.49% | 0.62% | 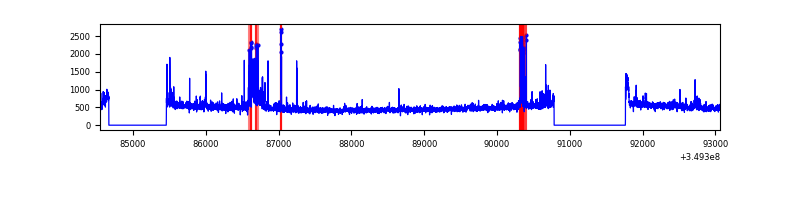 |
| C | 8516 | 6746 | 4 | 4 | 0.05% | 0.06% | 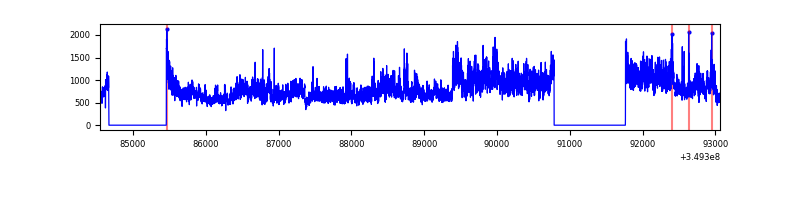 |
| D | 8516 | 6746 | 2702 | 2702 | 31.73% | 40.05% | 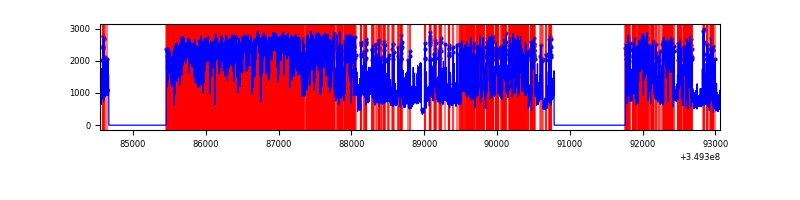 |
Top three noisy pixels from each quadrant. If the there are fewer than three noisy pixels in the level2.evt file, extra rows are filled as -1
| Pixel properties | Quadrant properties | ||||||
|---|---|---|---|---|---|---|---|
| Quadrant | DetID | PixID | Counts | Sigma | Mean | Median | Sigma |
| A | 14 | 235 | 25684 | 148.93 | 824 | 807 | 167.0 |
| A | 13 | 254 | 14051 | 79.28 | 824 | 807 | 167.0 |
| A | 3 | 137 | 7773 | 41.7 | 824 | 807 | 167.0 |
| B | 5 | 255 | 132470 | 844.65 | 822 | 802 | 155.9 |
| B | 10 | 245 | 131878 | 840.85 | 822 | 802 | 155.9 |
| B | 5 | 172 | 28067 | 174.9 | 822 | 802 | 155.9 |
| C | 3 | 233 | 2283256 | 12568.29 | 779 | 784 | 181.6 |
| C | 14 | 238 | 155192 | 850.24 | 779 | 784 | 181.6 |
| C | 14 | 254 | 46681 | 252.73 | 779 | 784 | 181.6 |
| D | 8 | 195 | 4703161 | 28751.08 | 686 | 666 | 163.6 |
| D | 1 | 52 | 3787115 | 23150.37 | 686 | 666 | 163.6 |
| D | 7 | 69 | 81630 | 495.01 | 686 | 666 | 163.6 |
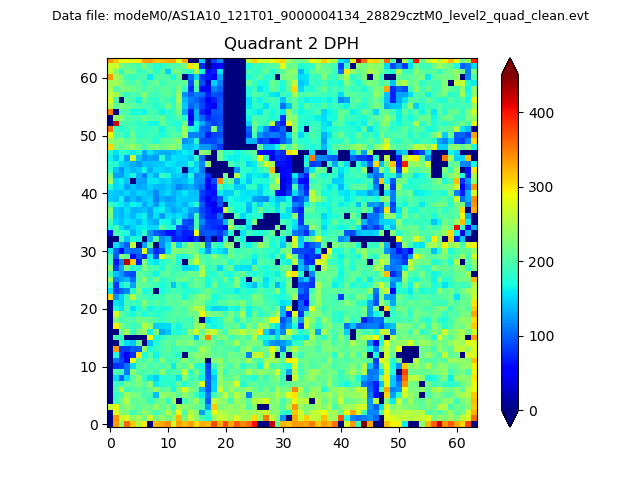
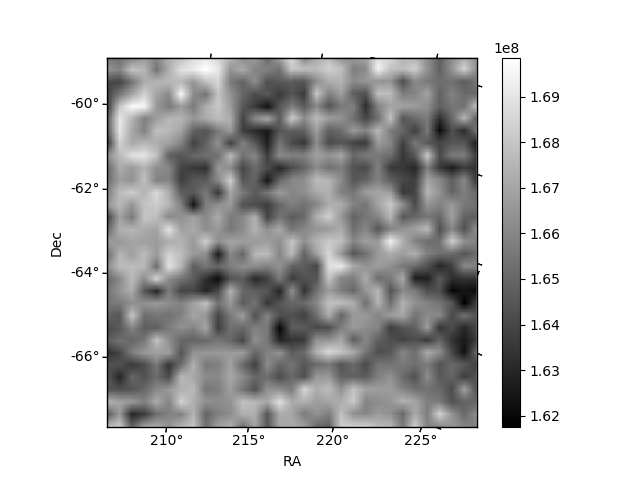
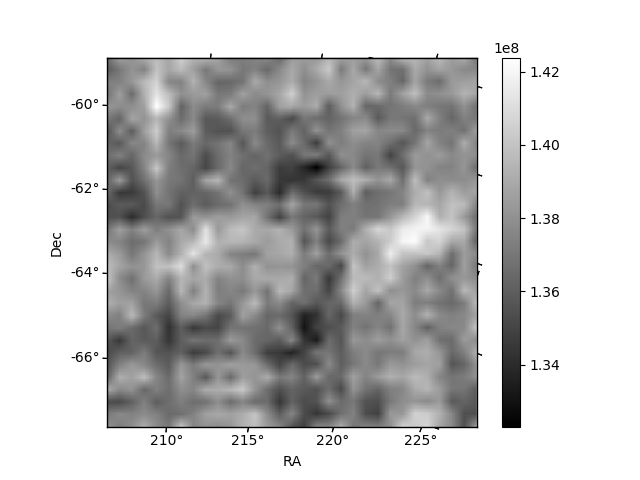
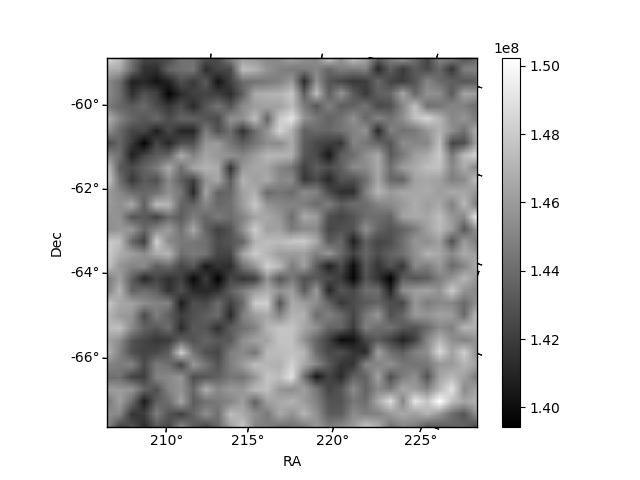
Histogram calculated using DETX and DETY for each event in the final _common_clean file
| Quadrant A | 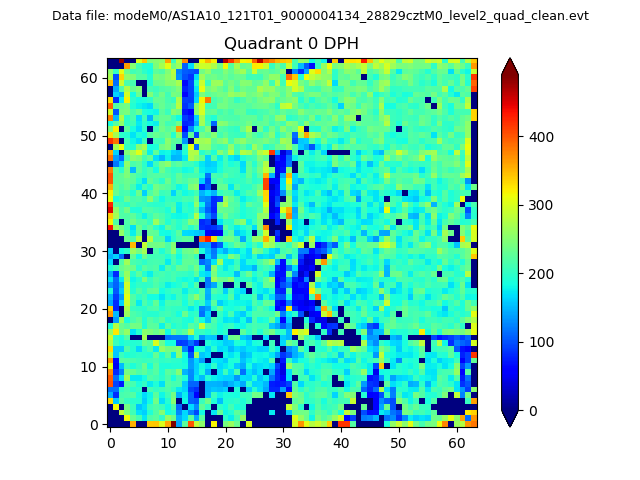 |
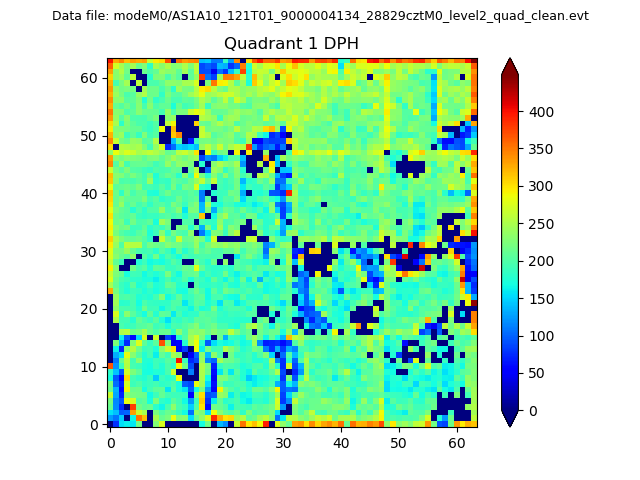 |
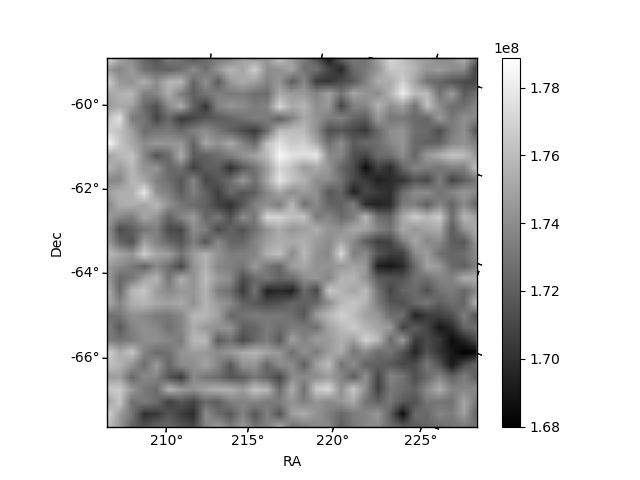
Quadrant B |
|---|---|---|---|
| Quadrant D | 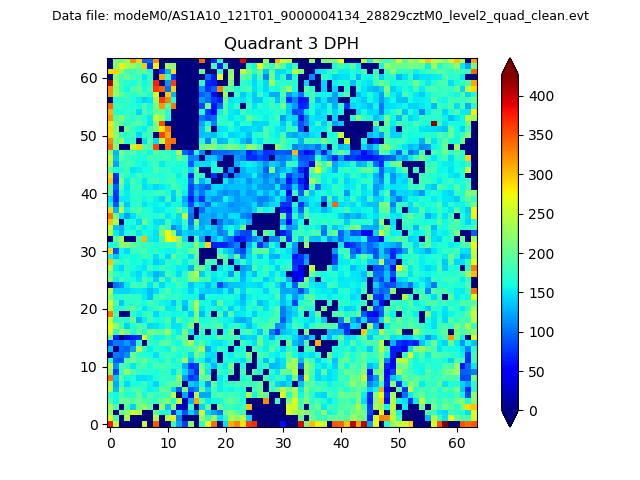 |
 |
Quadrant C |
| Plot type | Count rate plots | Images |
|---|---|---|
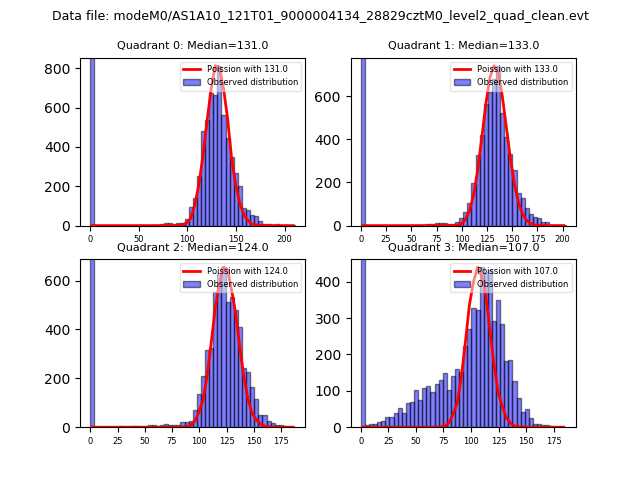
| Comparison with Poisson distribution Blue bars denote a histogram of data divided into 1 sec bins. Red curve is a Poisson curve with rate = median count rate of data. |
 |
 |
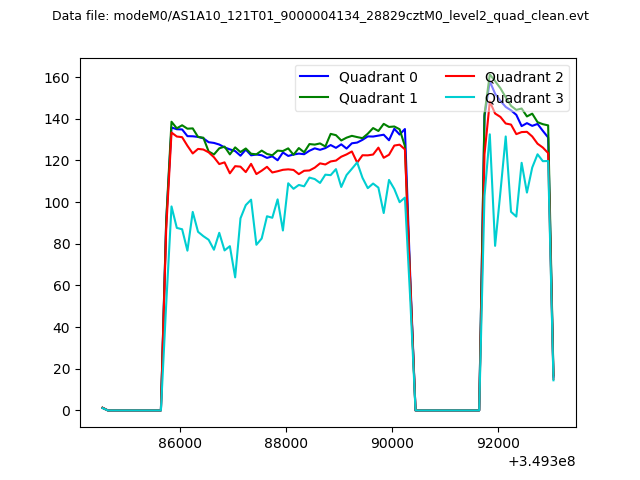
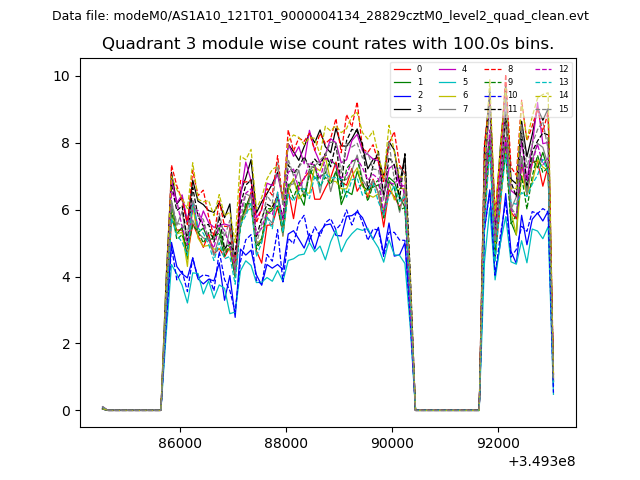
| Quadrant-wise count rates Data is divided into 100 sec bins |
 |
|
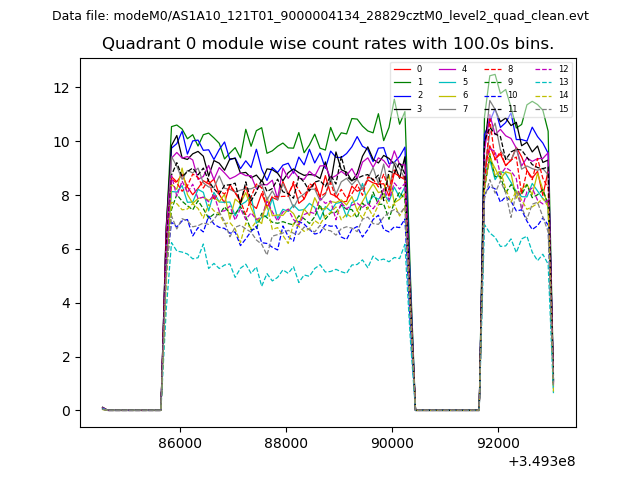
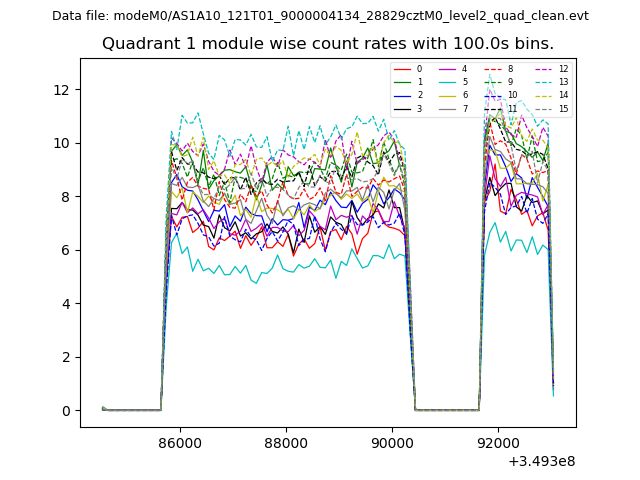
| Module-wise count rates for Quadrant A Data is divided into 100 sec bins |
 |
 |
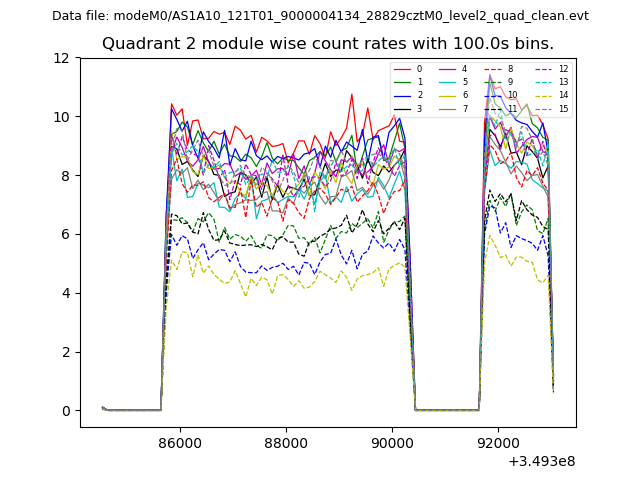
| Module-wise count rates for Quadrant B Data is divided into 100 sec bins |
 |
 |
| Module-wise count rates for Quadrant C Data is divided into 100 sec bins |
 |
 |
| Module-wise count rates for Quadrant D Data is divided into 100 sec bins |
 |
 |
| Parameter | Plot |
|---|---|
| CZT HV Monitor | 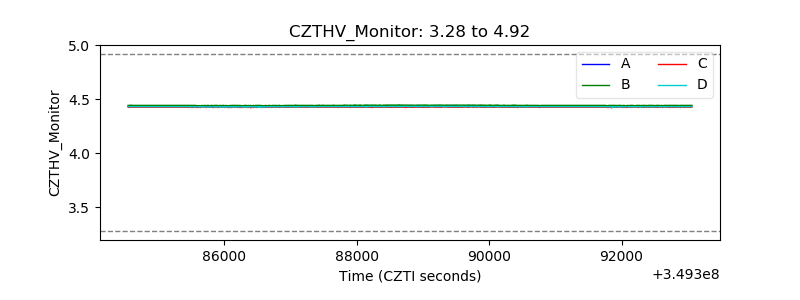 |
| D_VDD | 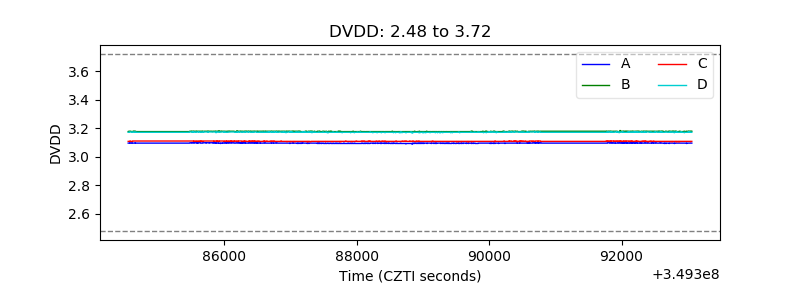 |
| Temperature 1 | 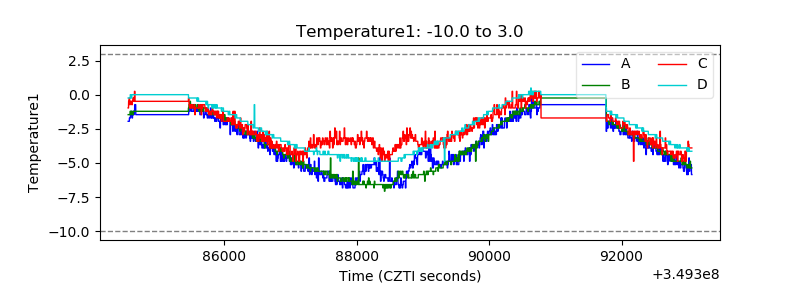 |
| Veto HV Monitor | 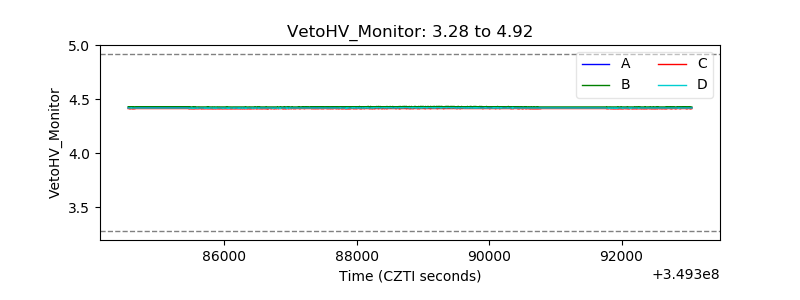 |
| Veto LLD | 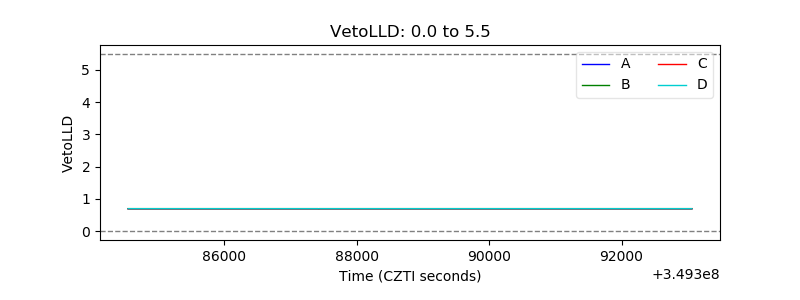 |
| Alpha Counter | 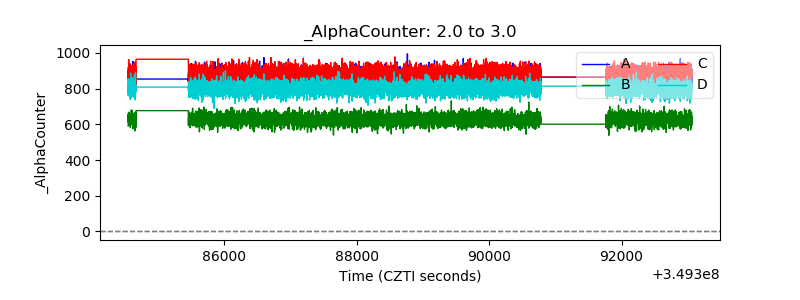 |
| _CPM_Rate | 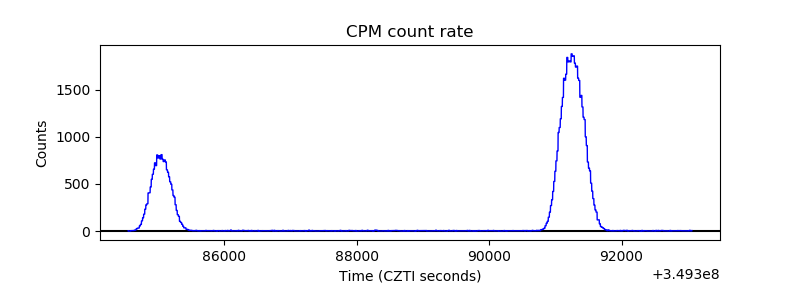 |
| CZT Counter | 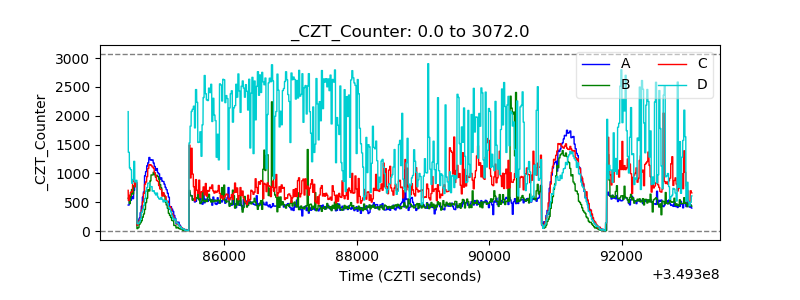 |
| +2.5 Volts monitor |  |
| +5 Volts monitor | 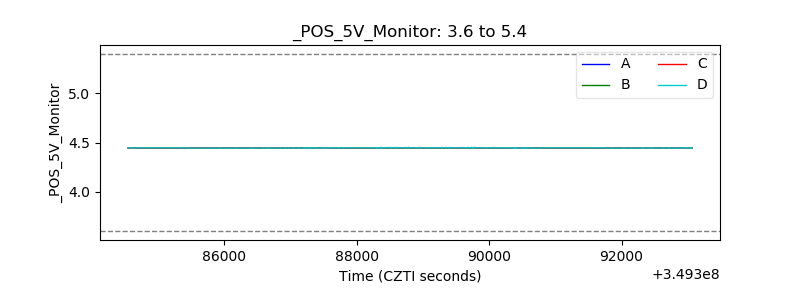 |
| _ROLL_ROT | 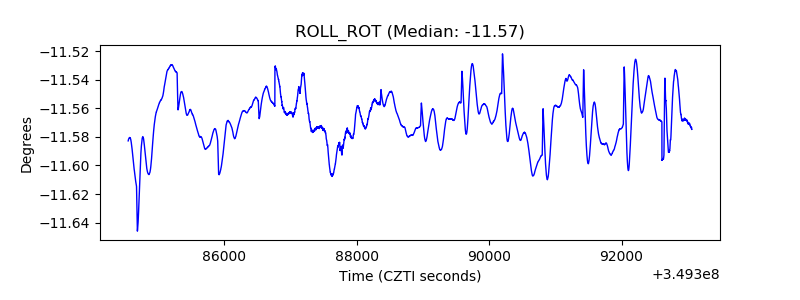 |
| _Roll_DEC | 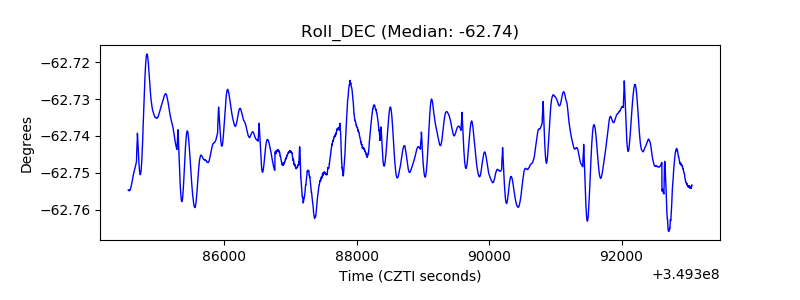 |
| _Roll_RA | 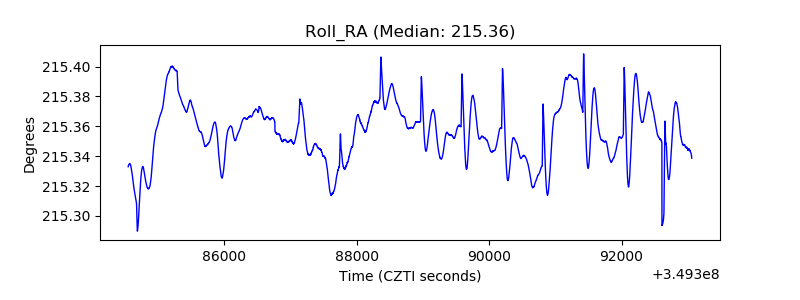 |
| Veto Counter | 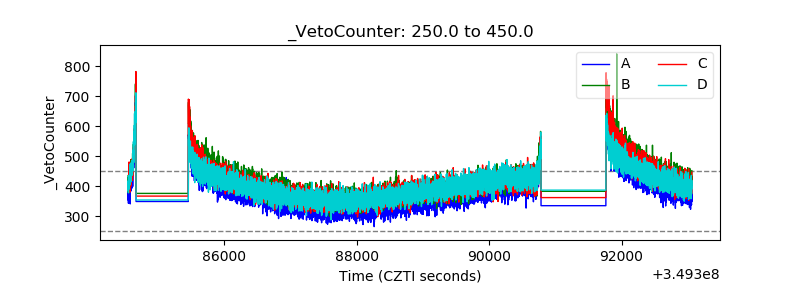 |