| Param | Original file | Final file |
|---|---|---|
| Filename | modeM0/AS1A10_121T01_9000004134_28831cztM0_level2.evt | modeM0/AS1A10_121T01_9000004134_28831cztM0_level2_quad_clean.evt |
| Size (bytes) | 593,216,640 | 115,159,680 |
| Size | 565.7 MB | 109.8 MB |
| Events in quadrant A | 3,098,862 | 790,696 |
| Events in quadrant B | 3,394,127 | 808,391 |
| Events in quadrant C | 5,184,520 | 754,513 |
| Events in quadrant D | 5,850,996 | 683,446 |
| Mode M9 | |||
|---|---|---|---|
| Quadrant | BADHDUFLAG | Total packets | Discarded packets |
| A | 0 | 16 | 0 |
| B | 0 | 17 | 0 |
| C | 0 | 17 | 0 |
| D | 0 | 17 | 0 |
| Mode M0 | |||
|---|---|---|---|
| Quadrant | BADHDUFLAG | Total packets | Discarded packets |
| A | 0 | 13401 | 2 |
| B | 0 | 14240 | 2 |
| C | 0 | 20086 | 2 |
| D | 0 | 21829 | 2 |
| Mode SS | |||
|---|---|---|---|
| Quadrant | BADHDUFLAG | Total packets | Discarded packets |
| A | 0 | 132 | 0 |
| B | 0 | 132 | 0 |
| C | 0 | 132 | 0 |
| D | 0 | 132 | 0 |
| Quadrant | Total seconds | Saturated seconds | Saturation percentage |
|---|---|---|---|
| A | 6454 | 30 | 0.464828% |
| B | 6454 | 108 | 1.673381% |
| C | 6454 | 315 | 4.880694% |
| D | 6454 | 779 | 12.070034% |
Noise dominated data is calculated using 1-second bins in cleaned event files. If a bin has >2000 counts, and if more than 50% of those come from <1% of pixels, then it is considered to be noise-dominated and hence unusable.
| Quadrant | # 1 sec bins | Bins with >0 counts | Bins with >2000 counts | High rate bins dominated by noise | Noise dominated (total time) | Noise dominated (detector-on time) | Marked lightcurve |
|---|---|---|---|---|---|---|---|
| A | 7554 | 6454 | 0 | 0 | 0.00% | 0.00% | 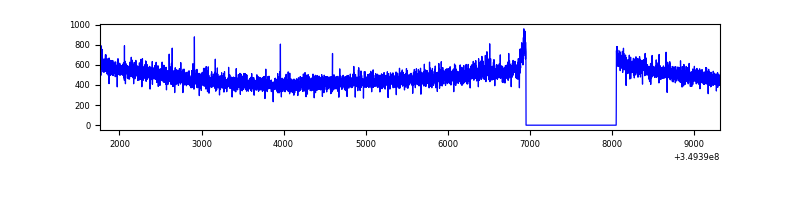 |
| B | 7554 | 6454 | 31 | 31 | 0.41% | 0.48% | 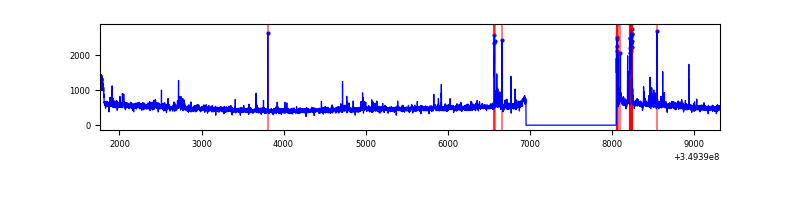 |
| C | 7554 | 6454 | 24 | 24 | 0.32% | 0.37% | 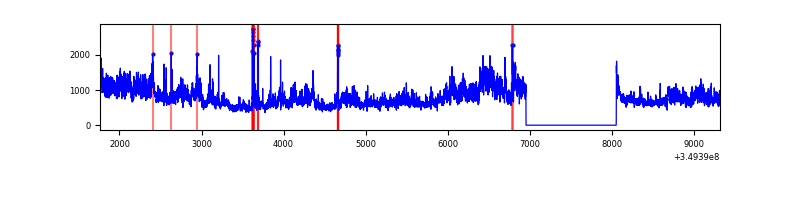 |
| D | 7554 | 6454 | 606 | 606 | 8.02% | 9.39% | 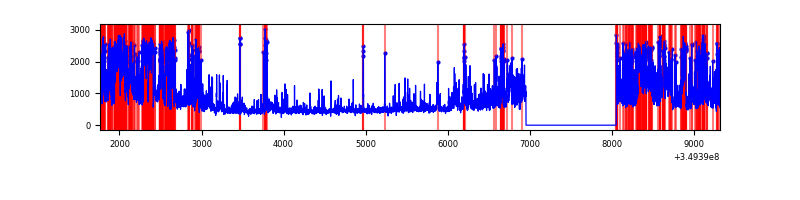 |
Top three noisy pixels from each quadrant. If the there are fewer than three noisy pixels in the level2.evt file, extra rows are filled as -1
| Pixel properties | Quadrant properties | ||||||
|---|---|---|---|---|---|---|---|
| Quadrant | DetID | PixID | Counts | Sigma | Mean | Median | Sigma |
| A | 13 | 254 | 13130 | 77.67 | 798 | 783 | 159.0 |
| A | 14 | 235 | 12323 | 72.59 | 798 | 783 | 159.0 |
| A | 3 | 137 | 7355 | 41.34 | 798 | 783 | 159.0 |
| B | 5 | 255 | 109497 | 732.6 | 797 | 778 | 148.4 |
| B | 5 | 172 | 34993 | 230.55 | 797 | 778 | 148.4 |
| B | 10 | 246 | 34220 | 225.35 | 797 | 778 | 148.4 |
| C | 3 | 233 | 1926056 | 10910.23 | 761 | 766 | 176.5 |
| C | 14 | 238 | 148421 | 836.73 | 761 | 766 | 176.5 |
| C | 4 | 254 | 88993 | 499.96 | 761 | 766 | 176.5 |
| D | 1 | 52 | 2453112 | 14294.85 | 721 | 701 | 171.6 |
| D | 8 | 195 | 510372 | 2970.82 | 721 | 701 | 171.6 |
| D | 2 | 250 | 64247 | 370.4 | 721 | 701 | 171.6 |
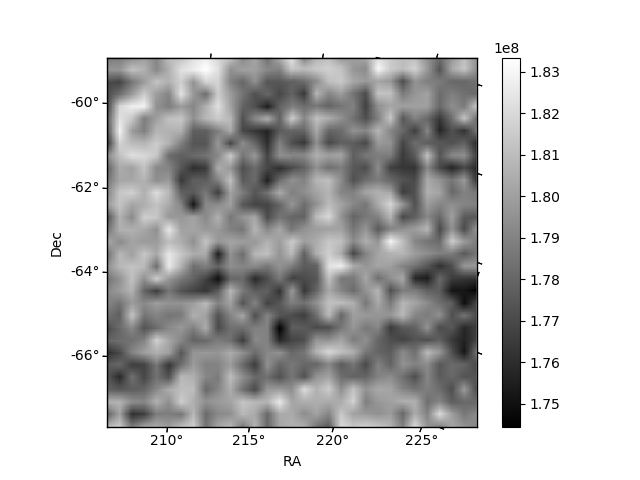
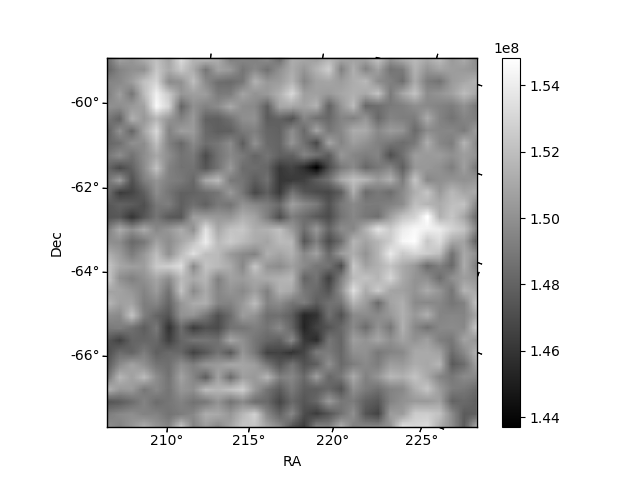
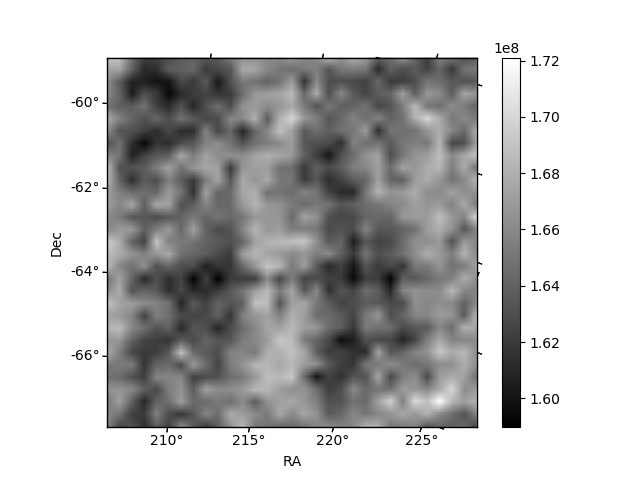
Histogram calculated using DETX and DETY for each event in the final _common_clean file
| Quadrant A |  |
 |
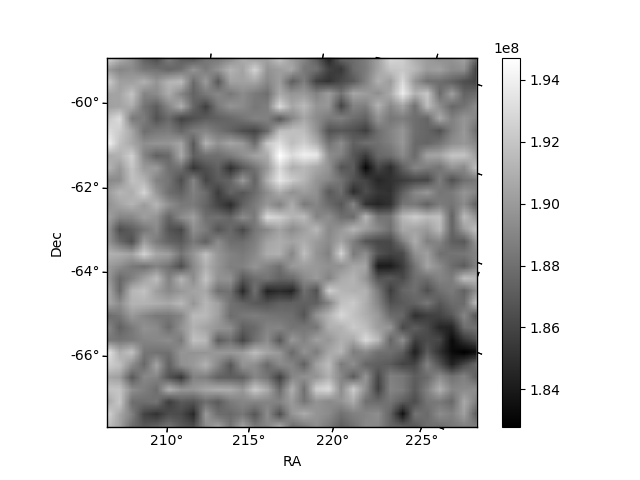
Quadrant B |
|---|---|---|---|
| Quadrant D | 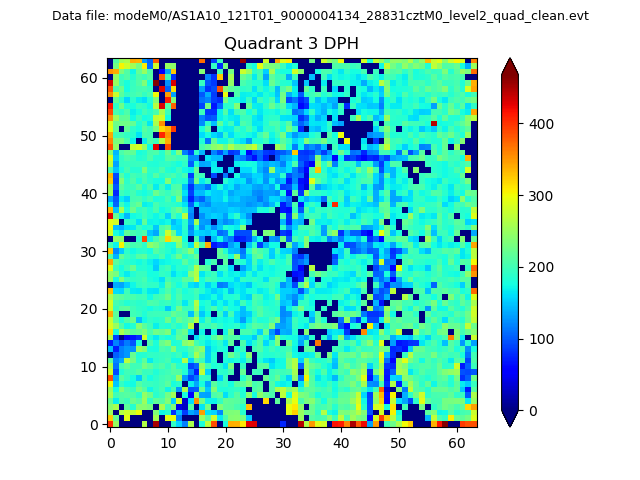 |
 |
Quadrant C |
| Plot type | Count rate plots | Images |
|---|---|---|
| Comparison with Poisson distribution Blue bars denote a histogram of data divided into 1 sec bins. Red curve is a Poisson curve with rate = median count rate of data. |
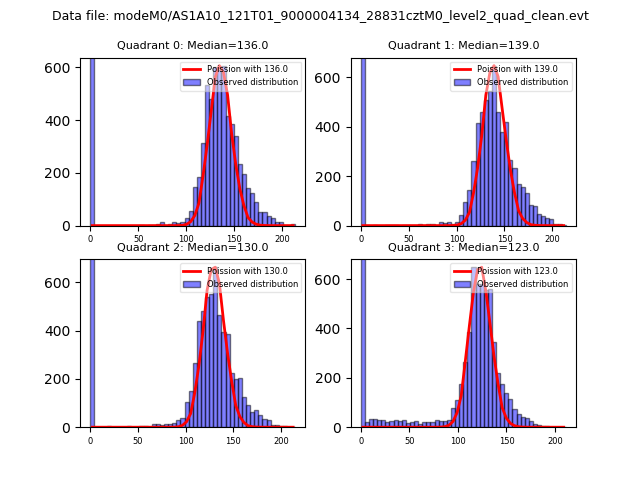 |
 |
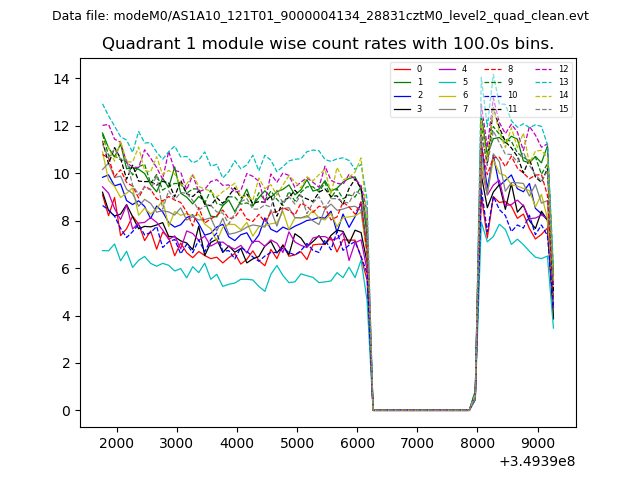
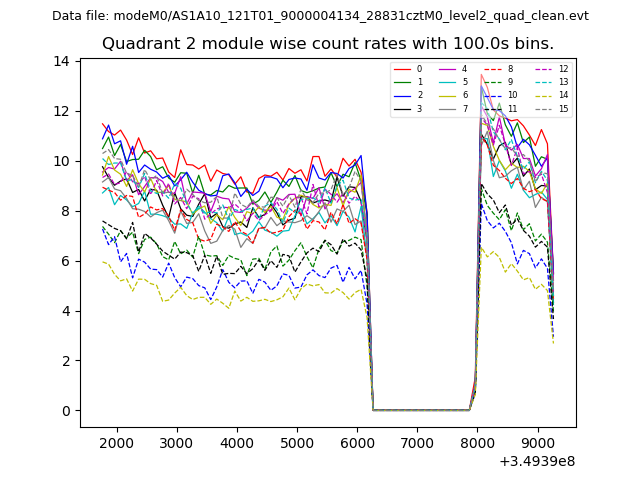
| Quadrant-wise count rates Data is divided into 100 sec bins |
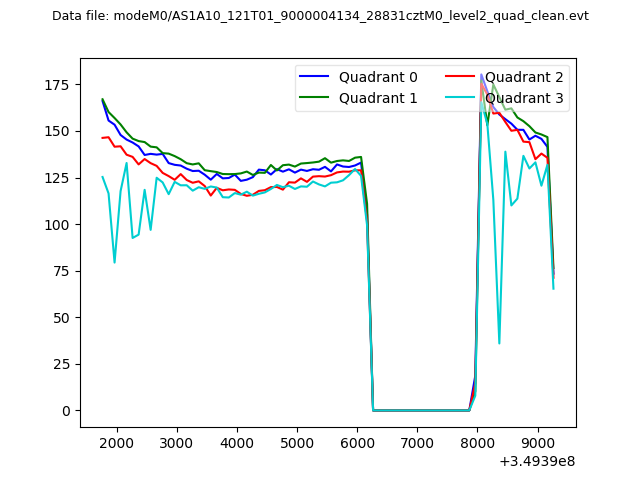 |
|
| Module-wise count rates for Quadrant A Data is divided into 100 sec bins |
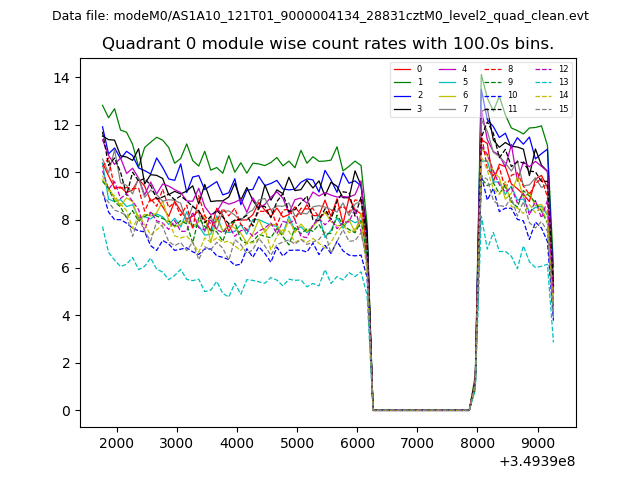 |
 |
| Module-wise count rates for Quadrant B Data is divided into 100 sec bins |
 |
 |
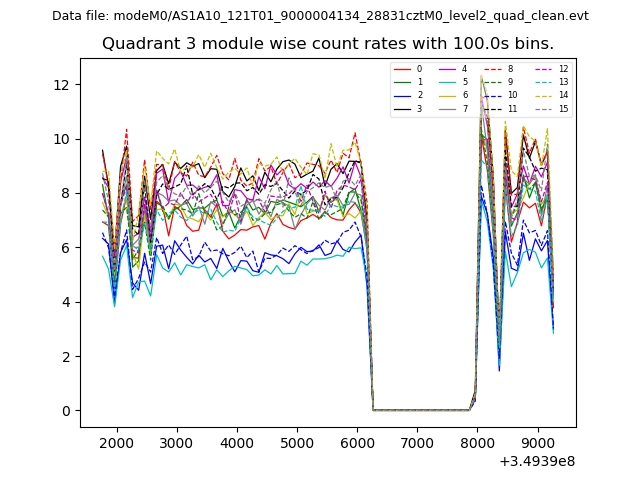
| Module-wise count rates for Quadrant C Data is divided into 100 sec bins |
 |
 |
| Module-wise count rates for Quadrant D Data is divided into 100 sec bins |
 |
 |
| Parameter | Plot |
|---|---|
| CZT HV Monitor | 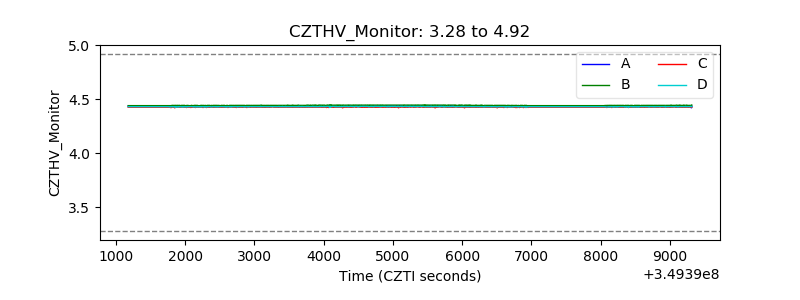 |
| D_VDD | 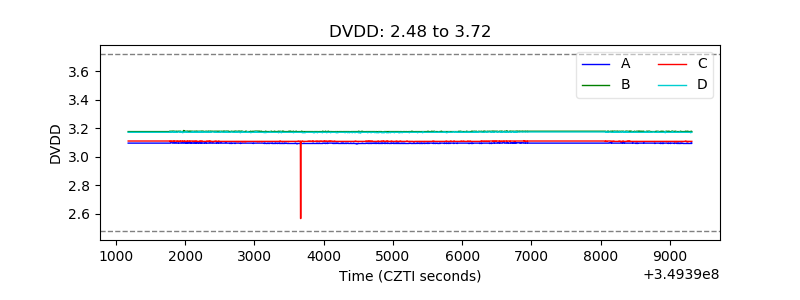 |
| Temperature 1 | 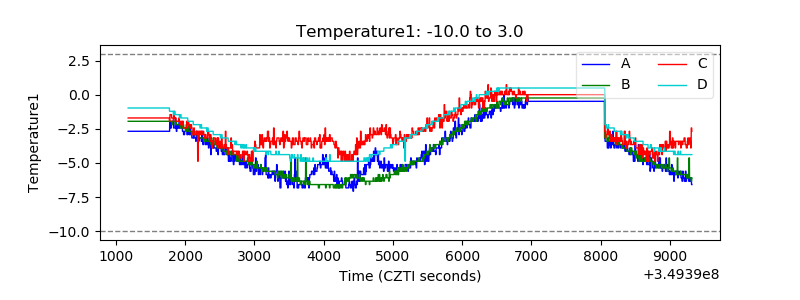 |
| Veto HV Monitor | 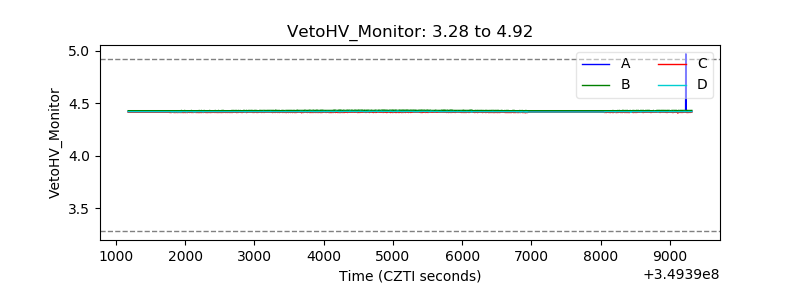 |
| Veto LLD | 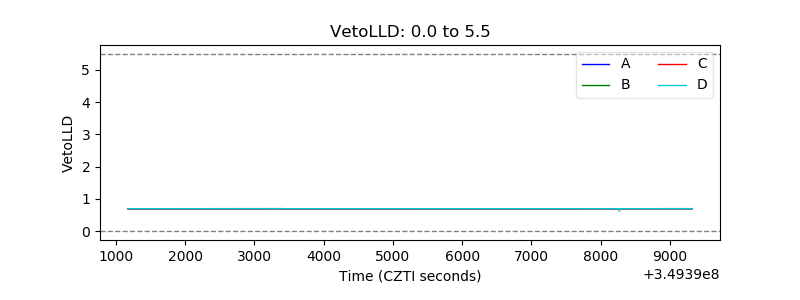 |
| Alpha Counter | 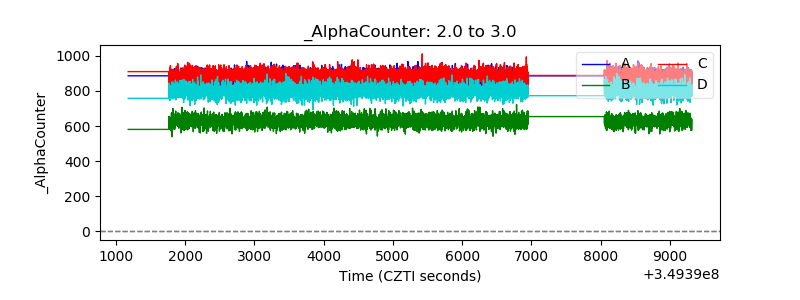 |
| _CPM_Rate | 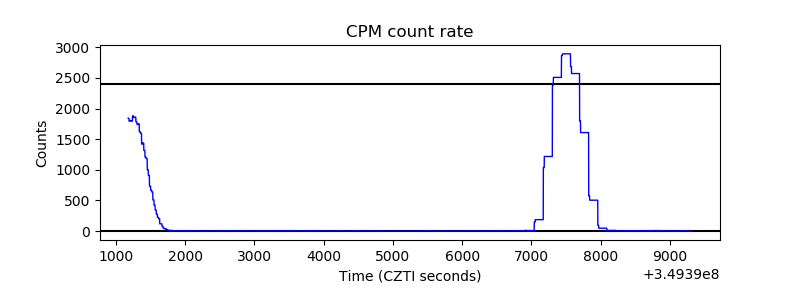 |
| CZT Counter |  |
| +2.5 Volts monitor |  |
| +5 Volts monitor | 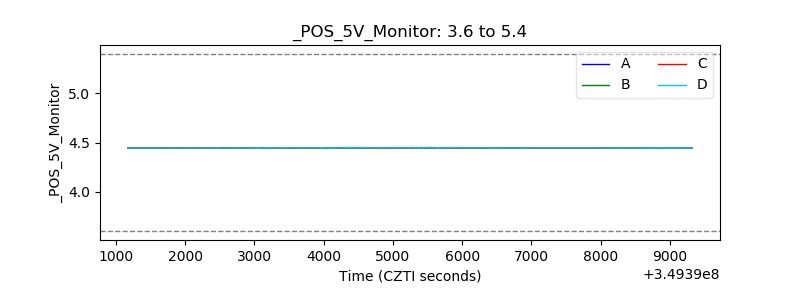 |
| _ROLL_ROT | 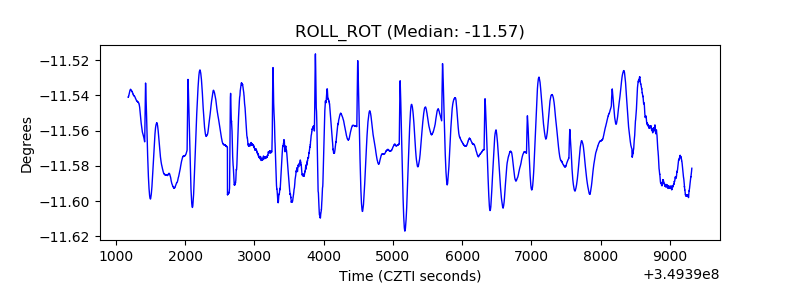 |
| _Roll_DEC | 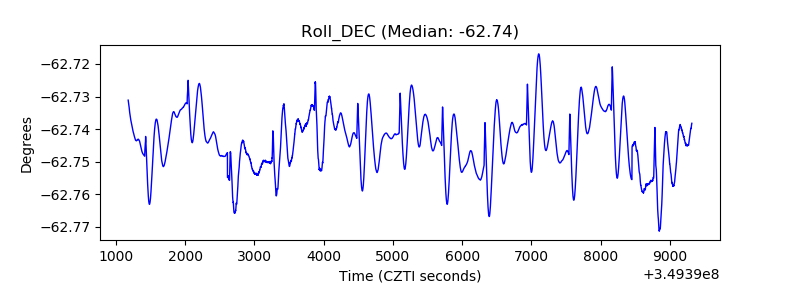 |
| _Roll_RA |  |
| Veto Counter | 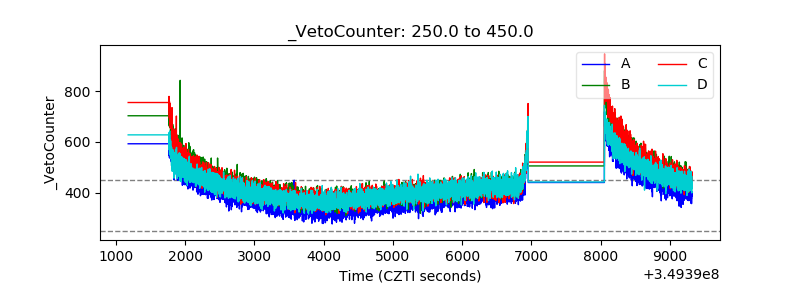 |