| Param | Original file | Final file |
|---|---|---|
| Filename | modeM0/AS1A10_121T01_9000004134_28832cztM0_level2.evt | modeM0/AS1A10_121T01_9000004134_28832cztM0_level2_quad_clean.evt |
| Size (bytes) | 685,134,720 | 119,753,280 |
| Size | 653.4 MB | 114.2 MB |
| Events in quadrant A | 3,383,004 | 821,820 |
| Events in quadrant B | 3,912,593 | 849,350 |
| Events in quadrant C | 4,923,099 | 793,990 |
| Events in quadrant D | 8,067,138 | 683,614 |
| Mode M9 | |||
|---|---|---|---|
| Quadrant | BADHDUFLAG | Total packets | Discarded packets |
| A | 0 | 23 | 0 |
| B | 0 | 23 | 0 |
| C | 0 | 23 | 0 |
| D | 0 | 23 | 0 |
| Mode M0 | |||
|---|---|---|---|
| Quadrant | BADHDUFLAG | Total packets | Discarded packets |
| A | 0 | 14379 | 2 |
| B | 0 | 16096 | 2 |
| C | 0 | 19541 | 2 |
| D | 0 | 28777 | 2 |
| Mode SS | |||
|---|---|---|---|
| Quadrant | BADHDUFLAG | Total packets | Discarded packets |
| A | 0 | 142 | 0 |
| B | 0 | 142 | 0 |
| C | 0 | 142 | 0 |
| D | 0 | 142 | 0 |
| Quadrant | Total seconds | Saturated seconds | Saturation percentage |
|---|---|---|---|
| A | 6852 | 34 | 0.496205% |
| B | 6853 | 176 | 2.568218% |
| C | 6853 | 408 | 5.953597% |
| D | 6853 | 1441 | 21.027287% |
Noise dominated data is calculated using 1-second bins in cleaned event files. If a bin has >2000 counts, and if more than 50% of those come from <1% of pixels, then it is considered to be noise-dominated and hence unusable.
| Quadrant | # 1 sec bins | Bins with >0 counts | Bins with >2000 counts | High rate bins dominated by noise | Noise dominated (total time) | Noise dominated (detector-on time) | Marked lightcurve |
|---|---|---|---|---|---|---|---|
| A | 9177 | 6853 | 0 | 0 | 0.00% | 0.00% | 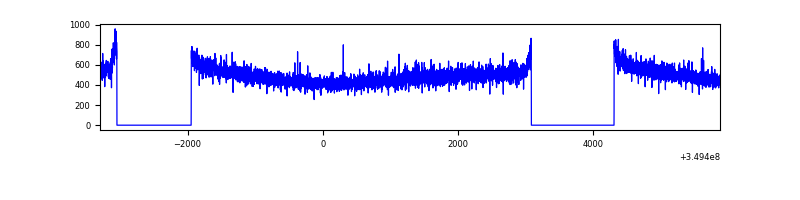 |
| B | 9178 | 6854 | 60 | 60 | 0.65% | 0.88% | 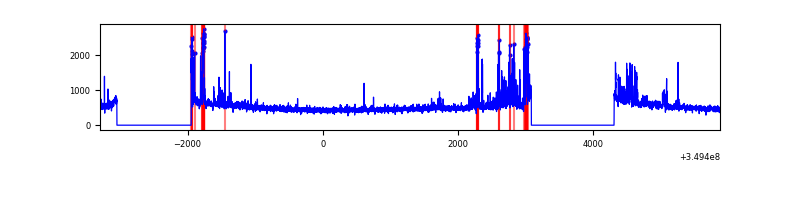 |
| C | 9178 | 6853 | 12 | 12 | 0.13% | 0.18% | 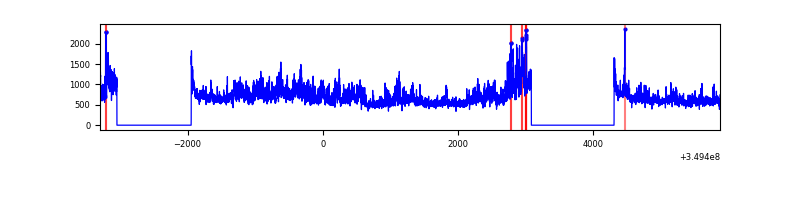 |
| D | 9178 | 6853 | 933 | 933 | 10.17% | 13.61% |  |
Top three noisy pixels from each quadrant. If the there are fewer than three noisy pixels in the level2.evt file, extra rows are filled as -1
| Pixel properties | Quadrant properties | ||||||
|---|---|---|---|---|---|---|---|
| Quadrant | DetID | PixID | Counts | Sigma | Mean | Median | Sigma |
| A | 14 | 235 | 16860 | 91.93 | 870 | 855 | 174.1 |
| A | 13 | 254 | 13429 | 72.22 | 870 | 855 | 174.1 |
| A | 4 | 2 | 9190 | 47.87 | 870 | 855 | 174.1 |
| B | 10 | 245 | 192928 | 1192.1 | 872 | 851 | 161.1 |
| B | 5 | 255 | 168640 | 1041.36 | 872 | 851 | 161.1 |
| B | 5 | 172 | 77999 | 478.81 | 872 | 851 | 161.1 |
| C | 3 | 233 | 1327160 | 6759.97 | 838 | 843 | 196.2 |
| C | 14 | 238 | 207849 | 1055.07 | 838 | 843 | 196.2 |
| C | 14 | 254 | 109472 | 553.66 | 838 | 843 | 196.2 |
| D | 1 | 52 | 4156207 | 23107.66 | 763 | 745 | 179.8 |
| D | 8 | 195 | 800377 | 4446.59 | 763 | 745 | 179.8 |
| D | 2 | 250 | 119612 | 660.99 | 763 | 745 | 179.8 |
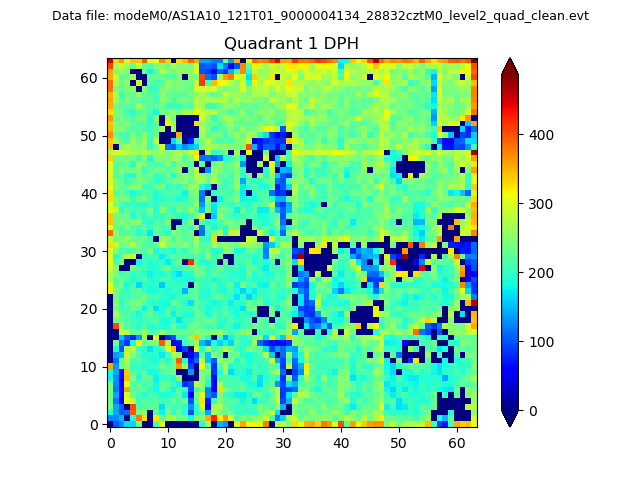
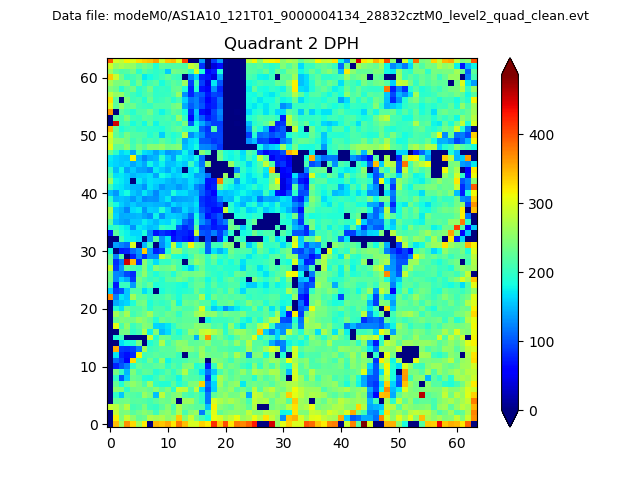
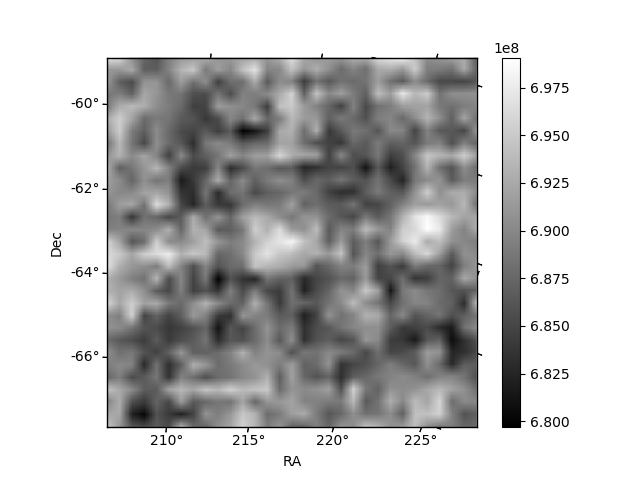
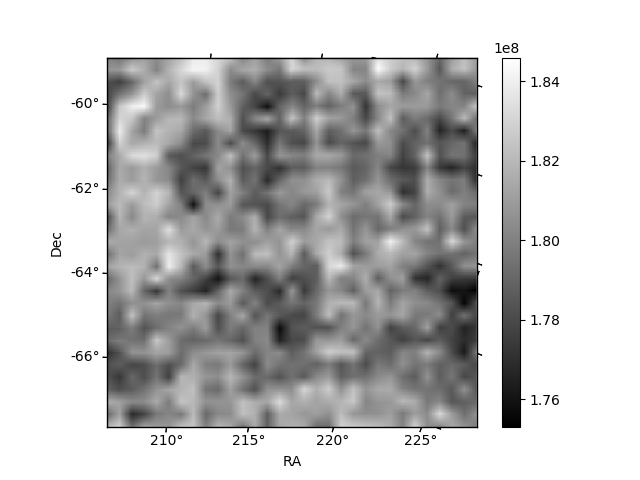
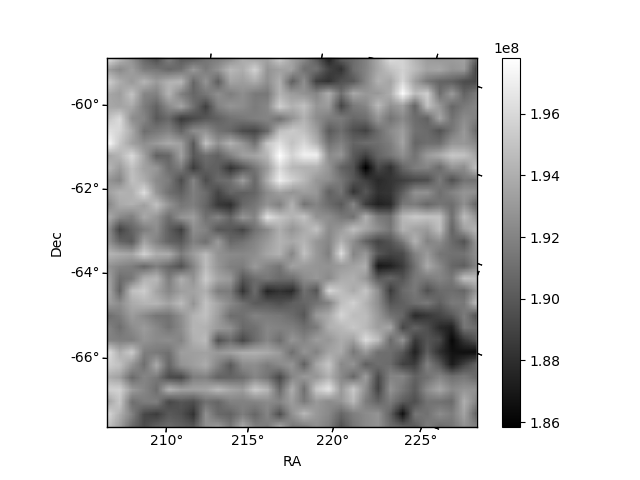
Histogram calculated using DETX and DETY for each event in the final _common_clean file
| Quadrant A | 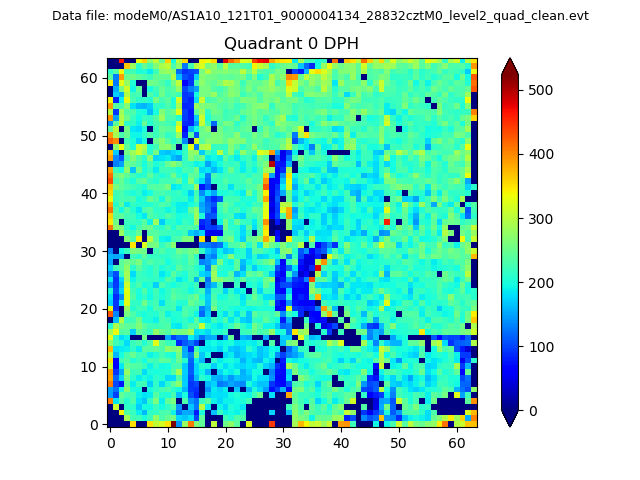 |
 |
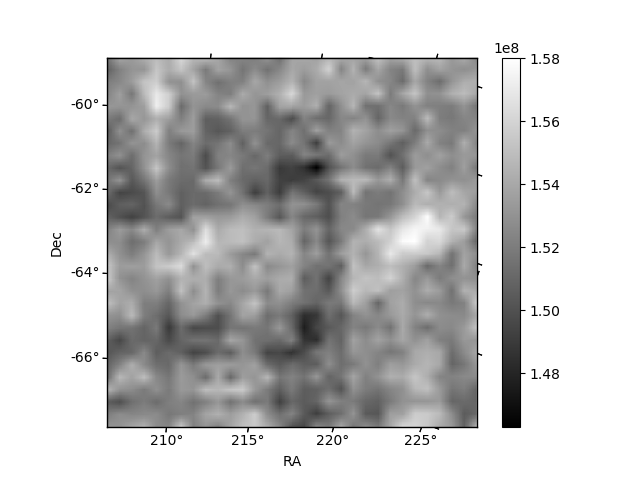
Quadrant B |
|---|---|---|---|
| Quadrant D | 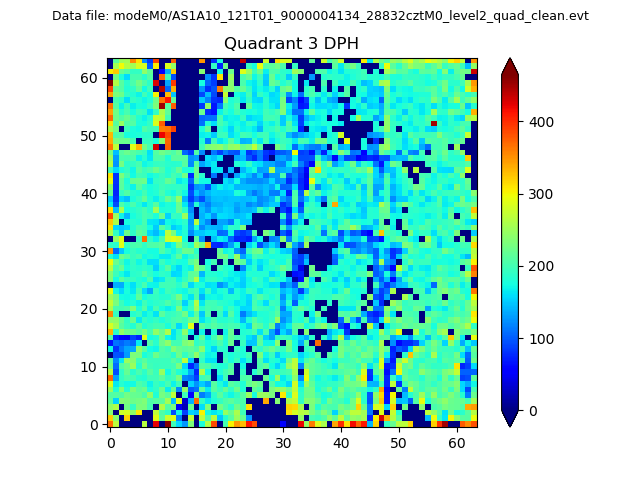 |
 |
Quadrant C |
| Plot type | Count rate plots | Images |
|---|---|---|
| Comparison with Poisson distribution Blue bars denote a histogram of data divided into 1 sec bins. Red curve is a Poisson curve with rate = median count rate of data. |
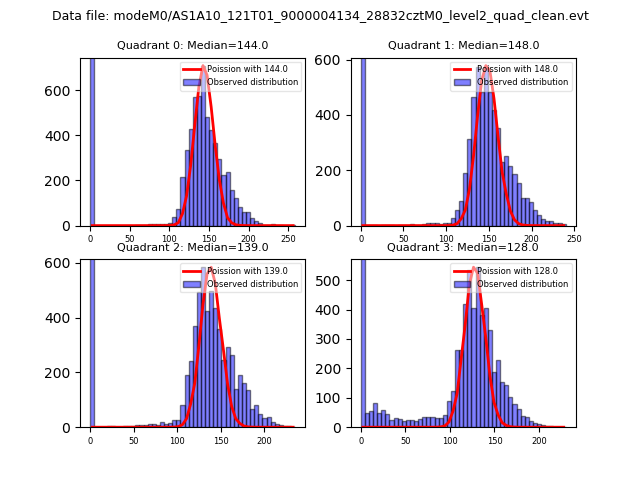 |
 |
| Quadrant-wise count rates Data is divided into 100 sec bins |
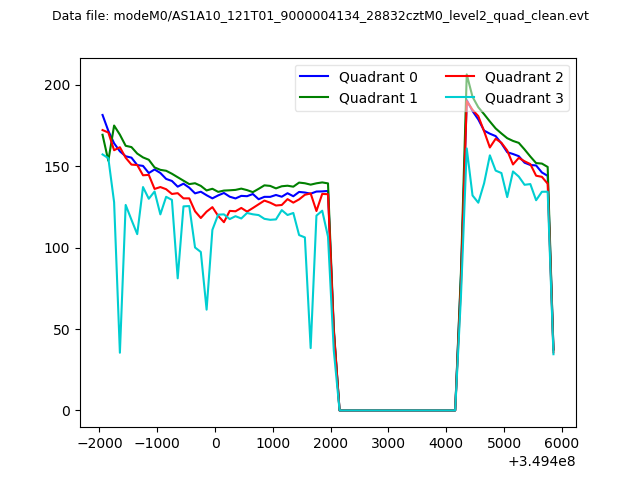 |
|
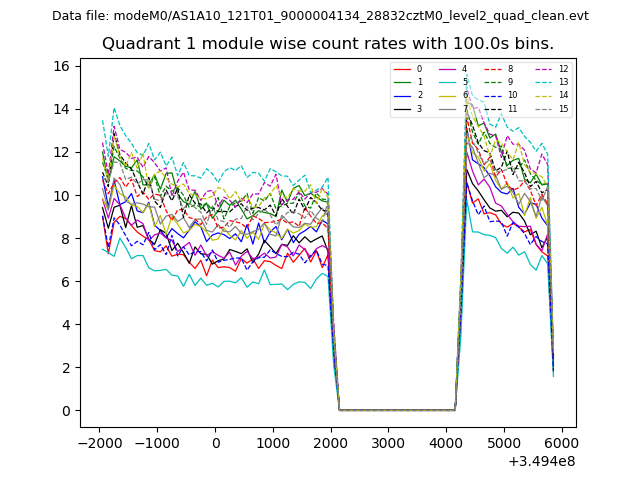
| Module-wise count rates for Quadrant A Data is divided into 100 sec bins |
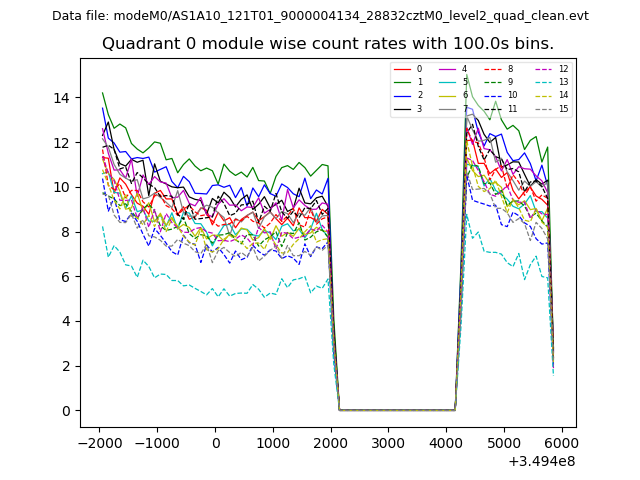 |
 |
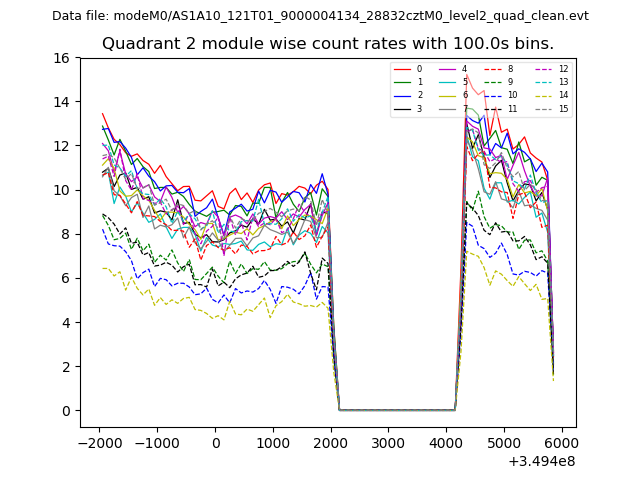
| Module-wise count rates for Quadrant B Data is divided into 100 sec bins |
 |
 |
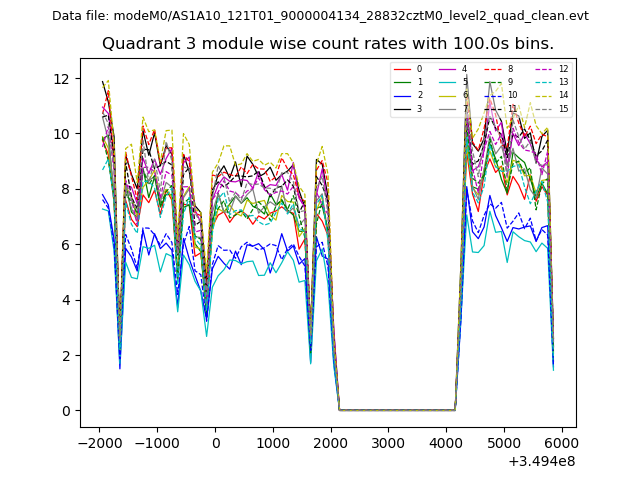
| Module-wise count rates for Quadrant C Data is divided into 100 sec bins |
 |
 |
| Module-wise count rates for Quadrant D Data is divided into 100 sec bins |
 |
 |
| Parameter | Plot |
|---|---|
| CZT HV Monitor | 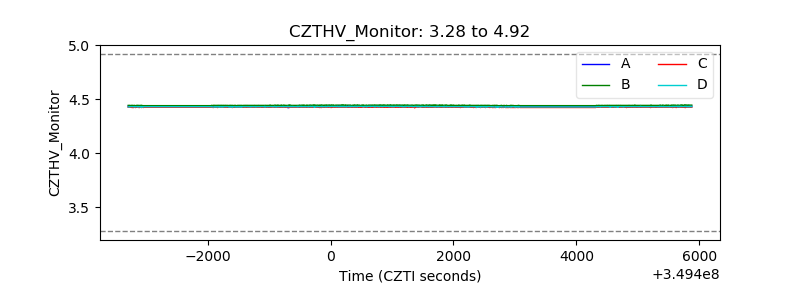 |
| D_VDD | 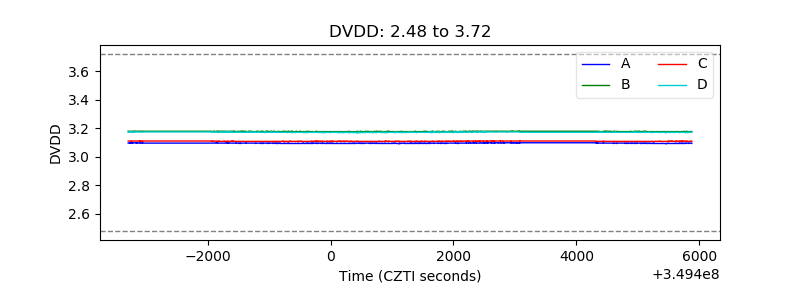 |
| Temperature 1 | 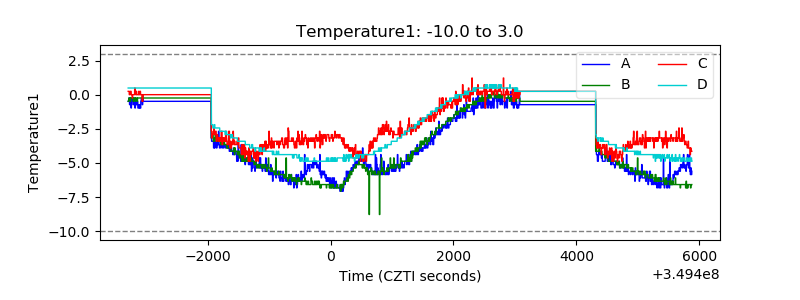 |
| Veto HV Monitor | 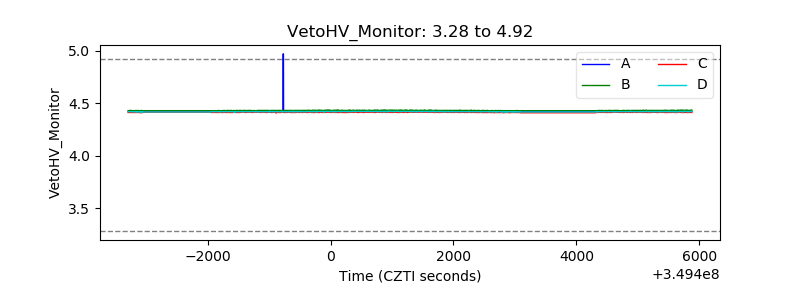 |
| Veto LLD | 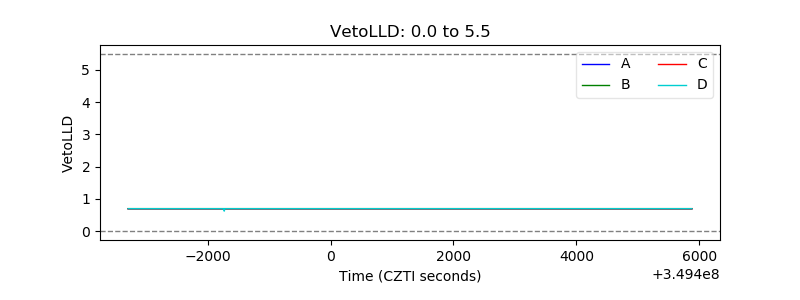 |
| Alpha Counter | 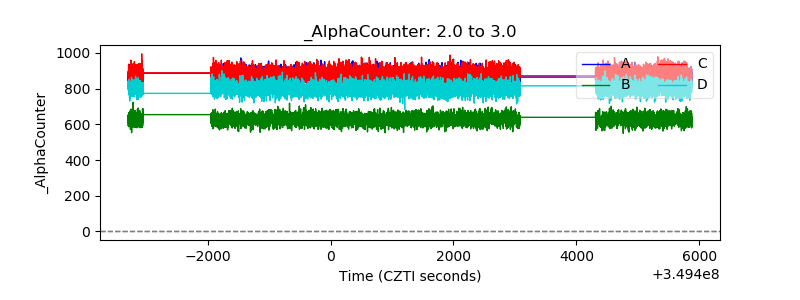 |
| _CPM_Rate | 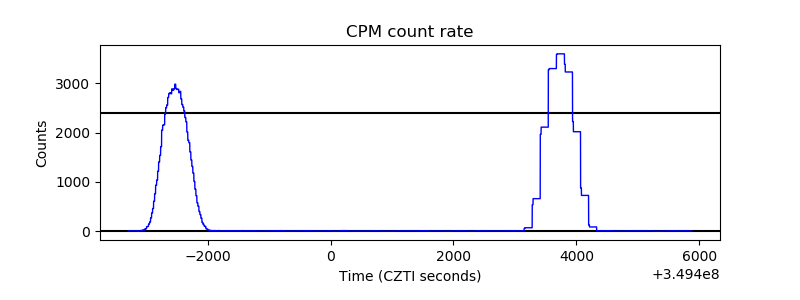 |
| CZT Counter | 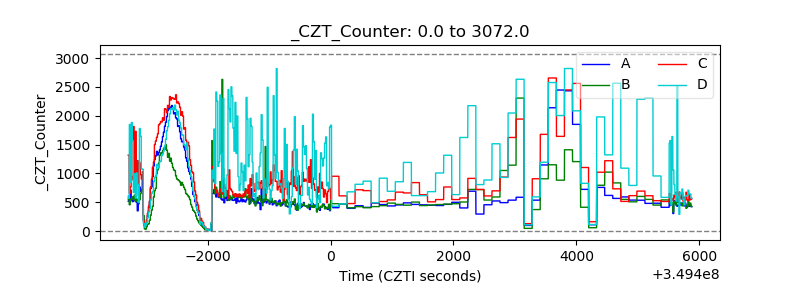 |
| +2.5 Volts monitor |  |
| +5 Volts monitor |  |
| _ROLL_ROT | 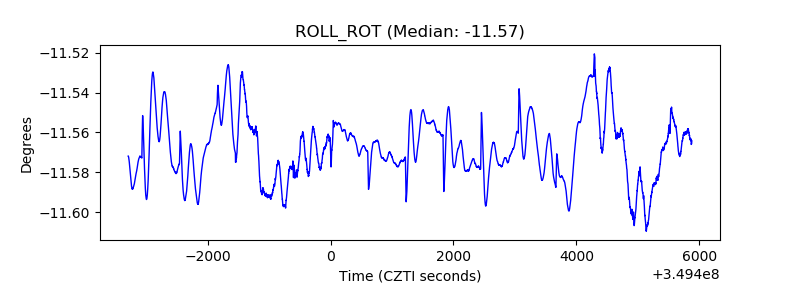 |
| _Roll_DEC | 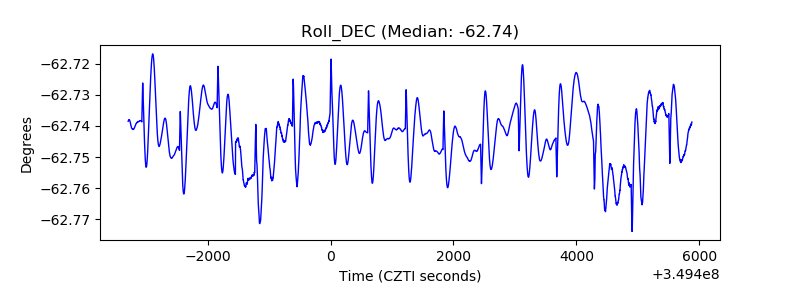 |
| _Roll_RA | 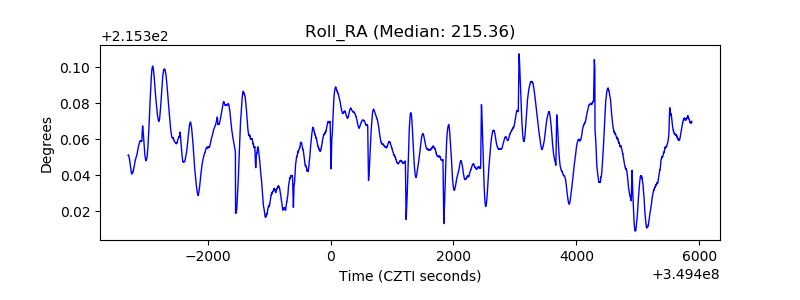 |
| Veto Counter | 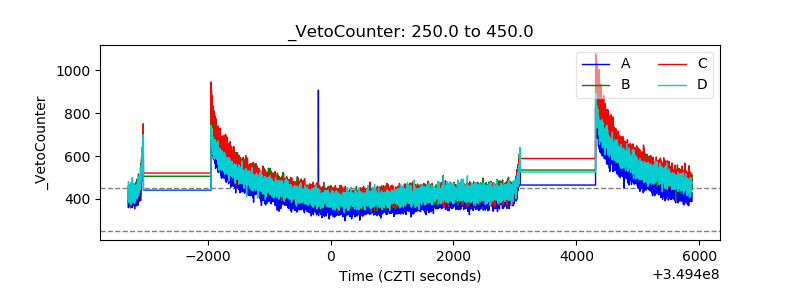 |