| Param | Original file | Final file |
|---|---|---|
| Filename | modeM0/AS1A10_121T01_9000004134_28833cztM0_level2.evt | modeM0/AS1A10_121T01_9000004134_28833cztM0_level2_quad_clean.evt |
| Size (bytes) | 604,048,320 | 113,952,960 |
| Size | 576.1 MB | 108.7 MB |
| Events in quadrant A | 3,121,312 | 770,585 |
| Events in quadrant B | 3,294,091 | 807,643 |
| Events in quadrant C | 3,691,602 | 753,307 |
| Events in quadrant D | 7,763,751 | 683,386 |
| Mode M9 | |||
|---|---|---|---|
| Quadrant | BADHDUFLAG | Total packets | Discarded packets |
| A | 0 | 13 | 0 |
| B | 0 | 13 | 0 |
| C | 0 | 13 | 0 |
| D | 0 | 13 | 0 |
| Mode M0 | |||
|---|---|---|---|
| Quadrant | BADHDUFLAG | Total packets | Discarded packets |
| A | 0 | 13090 | 1 |
| B | 0 | 13632 | 1 |
| C | 0 | 15041 | 1 |
| D | 0 | 27469 | 4 |
| Mode SS | |||
|---|---|---|---|
| Quadrant | BADHDUFLAG | Total packets | Discarded packets |
| A | 0 | 128 | 0 |
| B | 0 | 128 | 0 |
| C | 0 | 128 | 0 |
| D | 0 | 128 | 0 |
| Quadrant | Total seconds | Saturated seconds | Saturation percentage |
|---|---|---|---|
| A | 6243 | 21 | 0.336377% |
| B | 6243 | 55 | 0.880987% |
| C | 6243 | 305 | 4.885472% |
| D | 6243 | 1186 | 18.997277% |
Noise dominated data is calculated using 1-second bins in cleaned event files. If a bin has >2000 counts, and if more than 50% of those come from <1% of pixels, then it is considered to be noise-dominated and hence unusable.
| Quadrant | # 1 sec bins | Bins with >0 counts | Bins with >2000 counts | High rate bins dominated by noise | Noise dominated (total time) | Noise dominated (detector-on time) | Marked lightcurve |
|---|---|---|---|---|---|---|---|
| A | 7533 | 6243 | 0 | 0 | 0.00% | 0.00% | 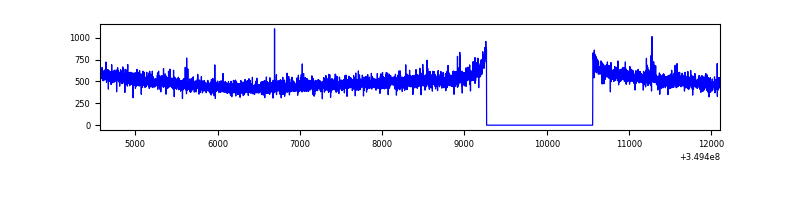 |
| B | 7533 | 6243 | 3 | 3 | 0.04% | 0.05% | 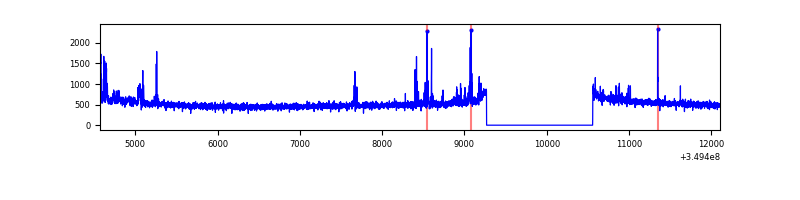 |
| C | 7533 | 6243 | 1 | 1 | 0.01% | 0.02% | 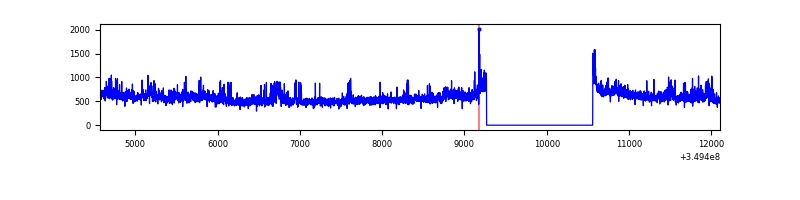 |
| D | 7533 | 6243 | 1104 | 1104 | 14.66% | 17.68% | 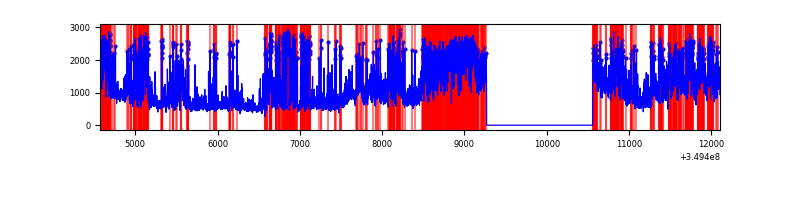 |
Top three noisy pixels from each quadrant. If the there are fewer than three noisy pixels in the level2.evt file, extra rows are filled as -1
| Pixel properties | Quadrant properties | ||||||
|---|---|---|---|---|---|---|---|
| Quadrant | DetID | PixID | Counts | Sigma | Mean | Median | Sigma |
| A | 14 | 235 | 20020 | 120.49 | 802 | 788 | 159.6 |
| A | 13 | 254 | 12142 | 71.13 | 802 | 788 | 159.6 |
| A | 0 | 226 | 6817 | 37.77 | 802 | 788 | 159.6 |
| B | 10 | 245 | 63748 | 422.85 | 812 | 792 | 148.9 |
| B | 5 | 255 | 24018 | 156.0 | 812 | 792 | 148.9 |
| B | 12 | 111 | 17040 | 109.13 | 812 | 792 | 148.9 |
| C | 3 | 233 | 312957 | 1694.18 | 790 | 798 | 184.3 |
| C | 14 | 238 | 196937 | 1064.51 | 790 | 798 | 184.3 |
| C | 14 | 254 | 101158 | 544.69 | 790 | 798 | 184.3 |
| D | 1 | 52 | 2865590 | 16443.31 | 738 | 719 | 174.2 |
| D | 8 | 195 | 1224914 | 7026.43 | 738 | 719 | 174.2 |
| D | 12 | 233 | 491263 | 2815.54 | 738 | 719 | 174.2 |
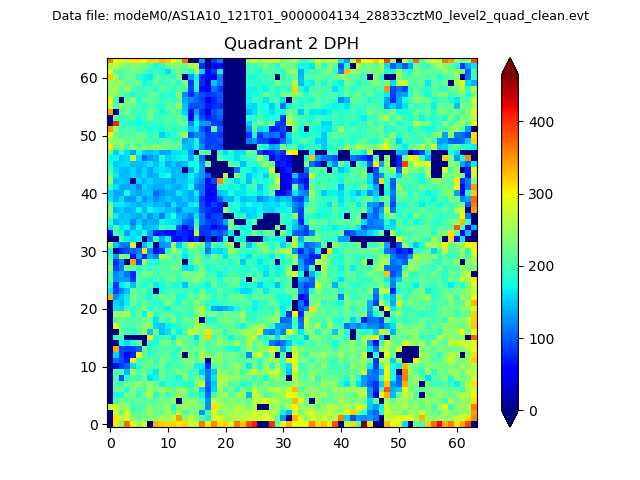
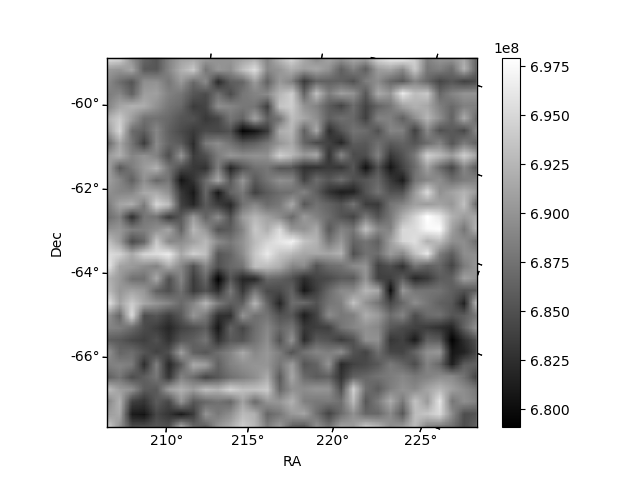
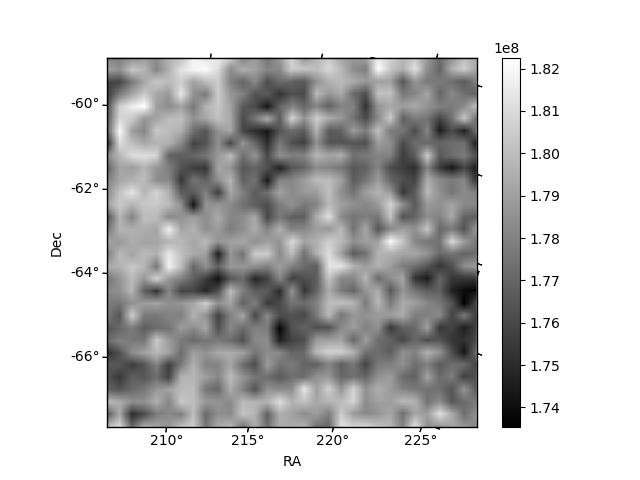
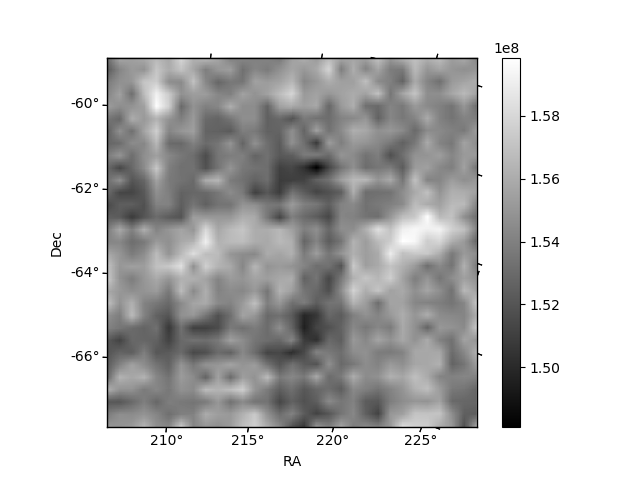
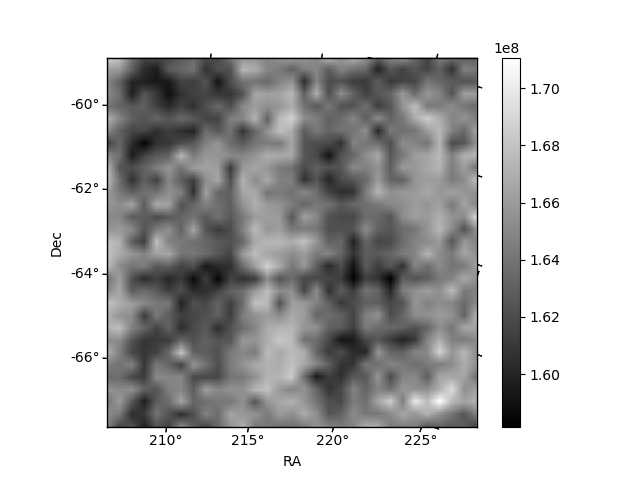
Histogram calculated using DETX and DETY for each event in the final _common_clean file
| Quadrant A | 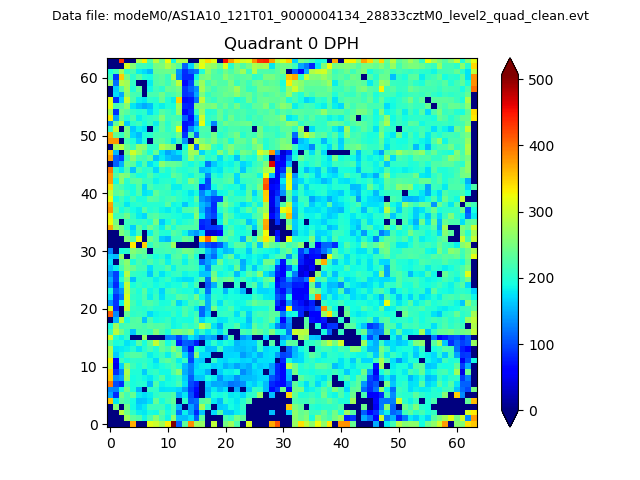 |
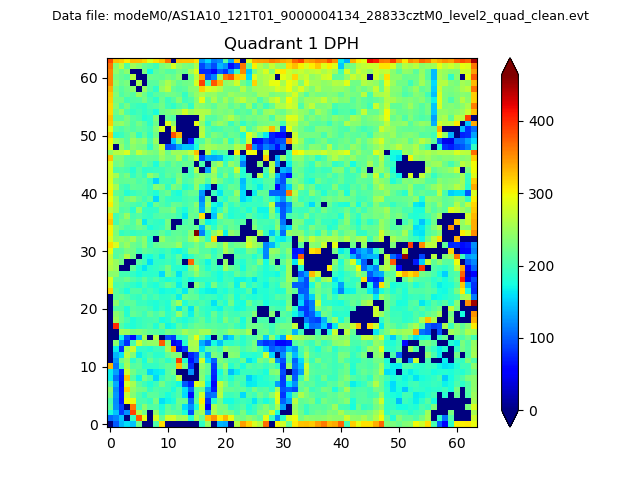 |
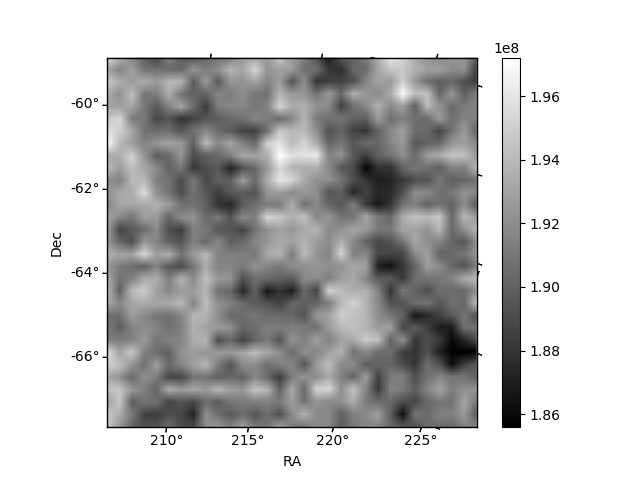
Quadrant B |
|---|---|---|---|
| Quadrant D | 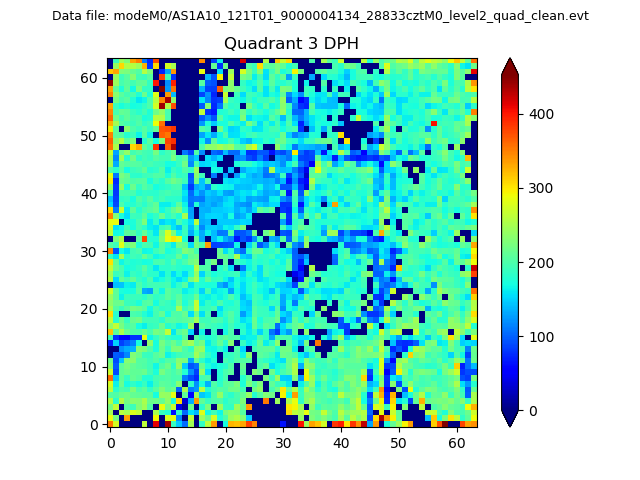 |
 |
Quadrant C |
| Plot type | Count rate plots | Images |
|---|---|---|
| Comparison with Poisson distribution Blue bars denote a histogram of data divided into 1 sec bins. Red curve is a Poisson curve with rate = median count rate of data. |
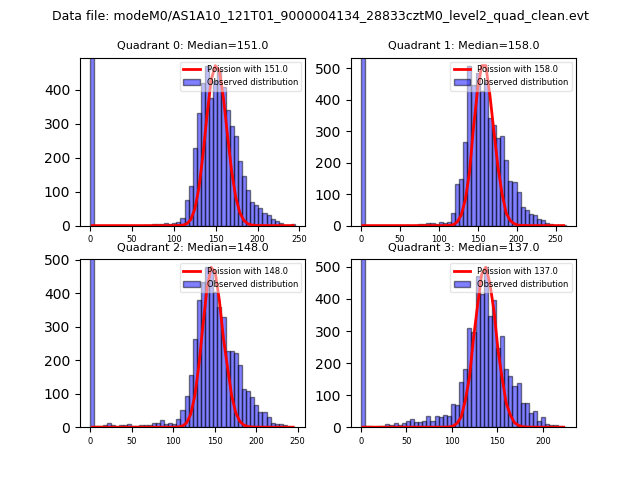 |
 |
| Quadrant-wise count rates Data is divided into 100 sec bins |
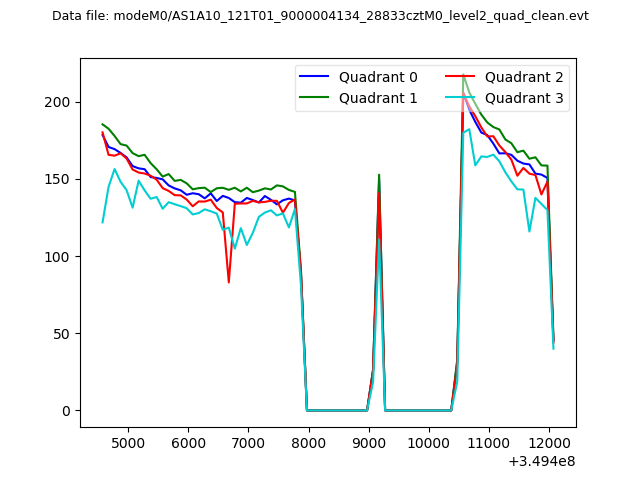 |
|
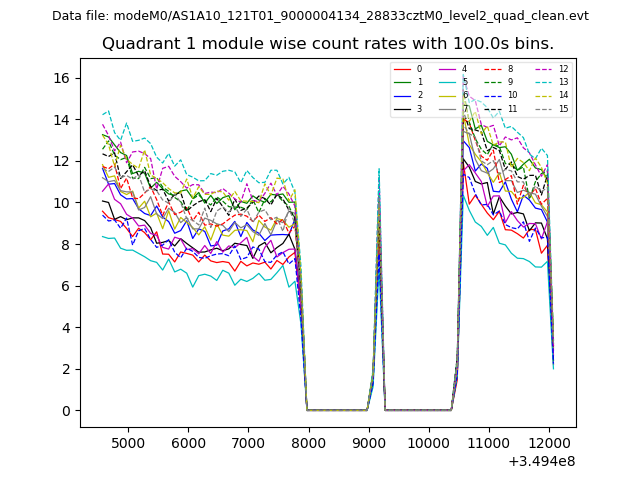
| Module-wise count rates for Quadrant A Data is divided into 100 sec bins |
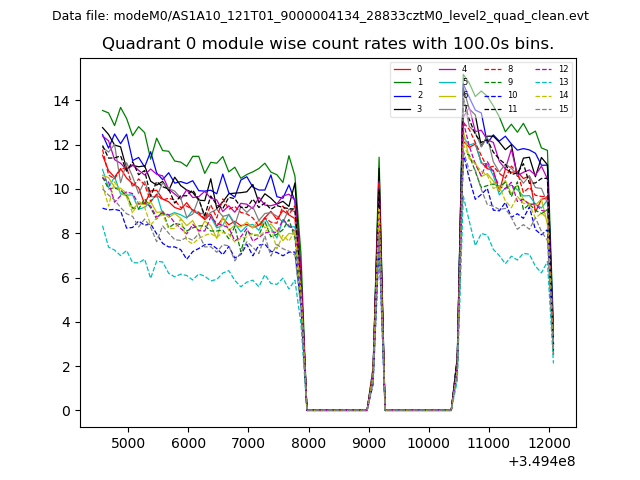 |
 |
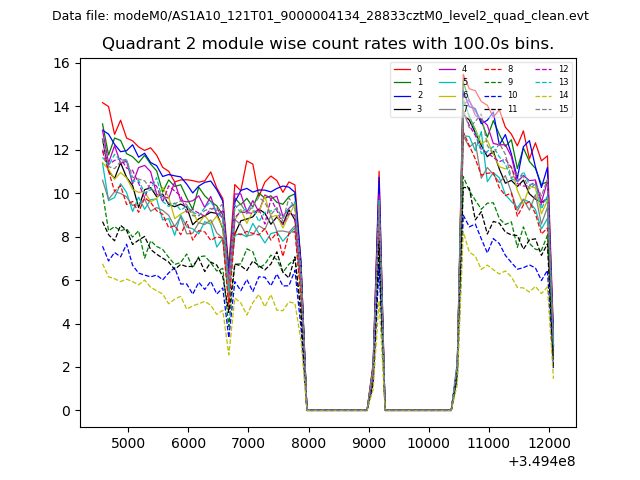
| Module-wise count rates for Quadrant B Data is divided into 100 sec bins |
 |
 |
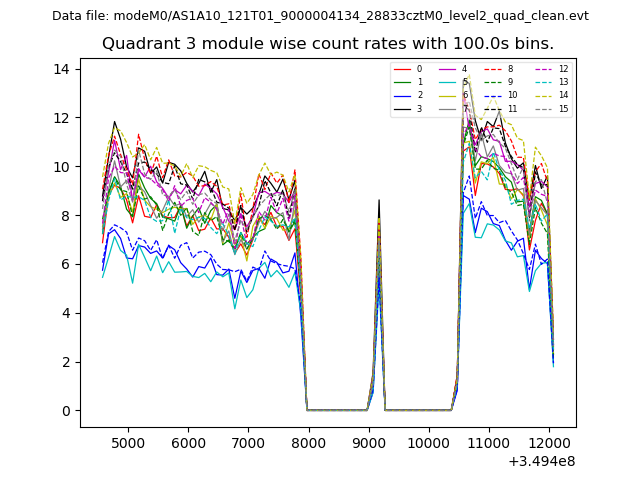
| Module-wise count rates for Quadrant C Data is divided into 100 sec bins |
 |
 |
| Module-wise count rates for Quadrant D Data is divided into 100 sec bins |
 |
 |
| Parameter | Plot |
|---|---|
| CZT HV Monitor | 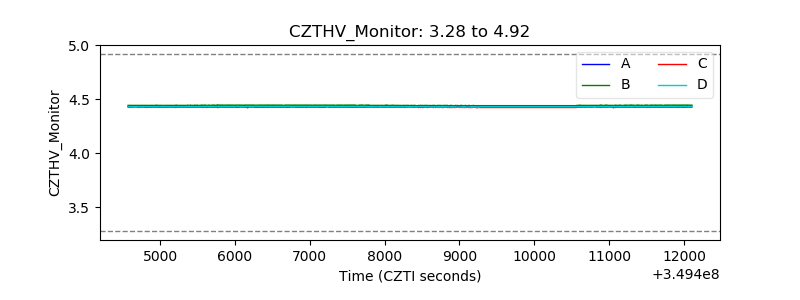 |
| D_VDD | 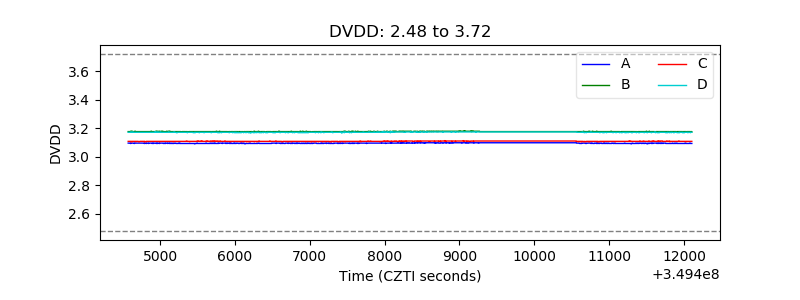 |
| Temperature 1 | 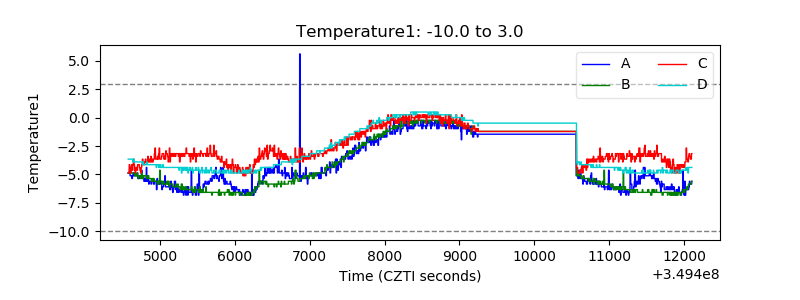 |
| Veto HV Monitor | 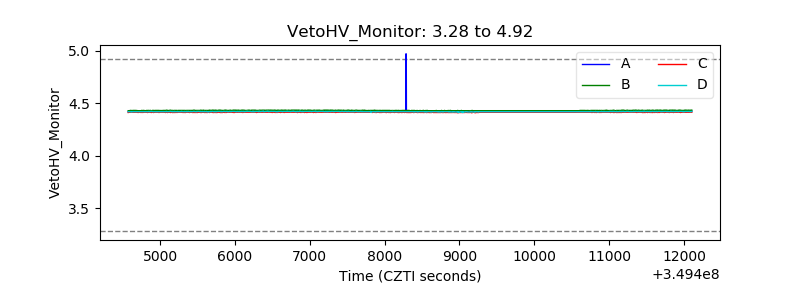 |
| Veto LLD | 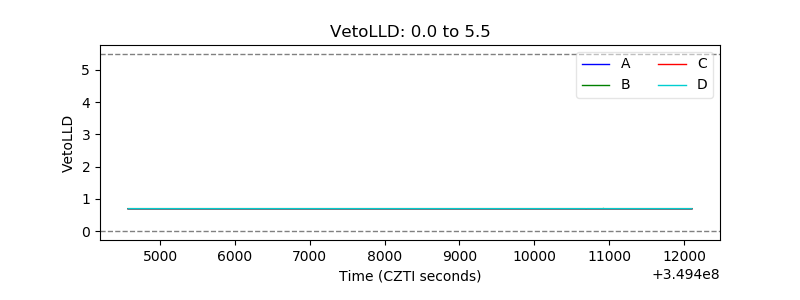 |
| Alpha Counter | 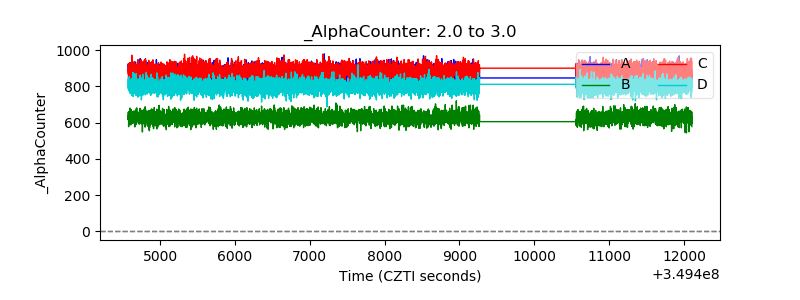 |
| _CPM_Rate | 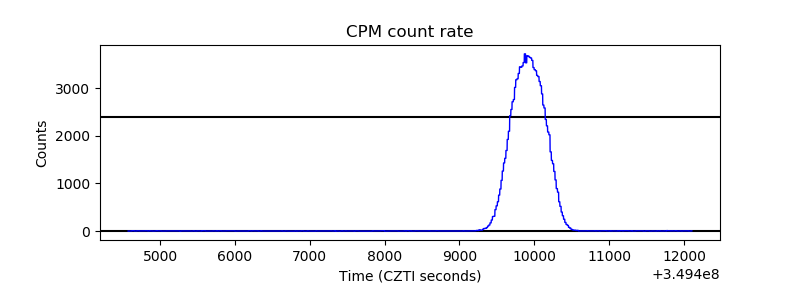 |
| CZT Counter | 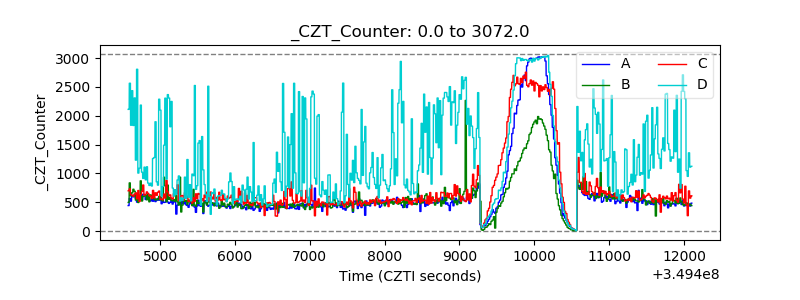 |
| +2.5 Volts monitor |  |
| +5 Volts monitor |  |
| _ROLL_ROT | 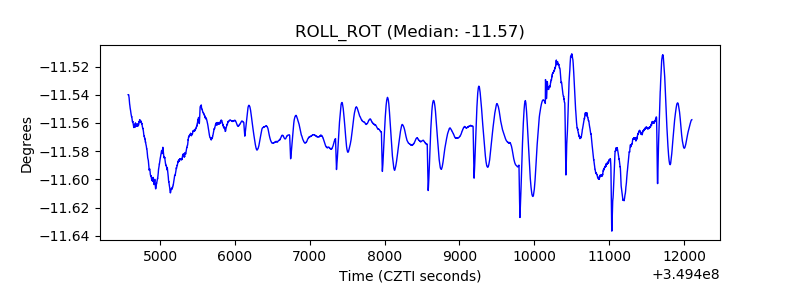 |
| _Roll_DEC | 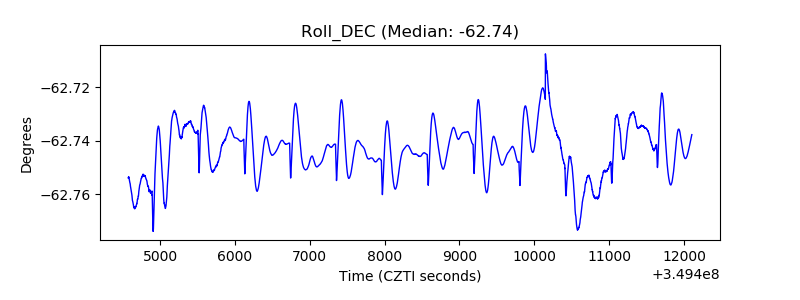 |
| _Roll_RA | 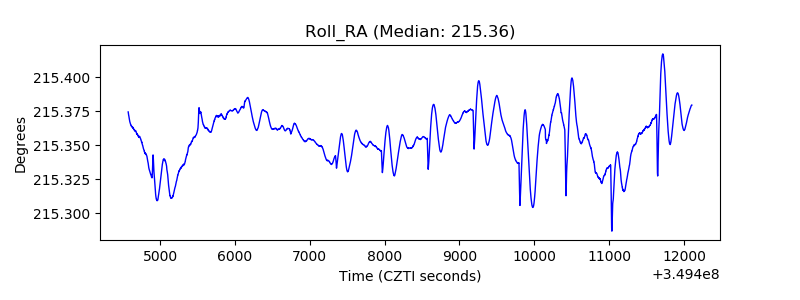 |
| Veto Counter | 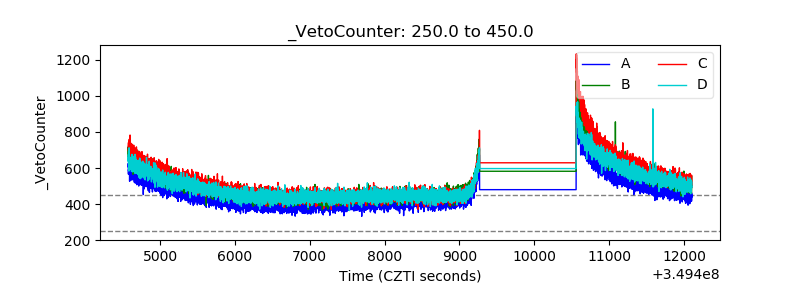 |