| Param | Original file | Final file |
|---|---|---|
| Filename | modeM0/AS1A10_121T01_9000004134_28836cztM0_level2.evt | modeM0/AS1A10_121T01_9000004134_28836cztM0_level2_quad_clean.evt |
| Size (bytes) | 599,748,480 | 97,168,320 |
| Size | 572.0 MB | 92.7 MB |
| Events in quadrant A | 2,834,326 | 657,922 |
| Events in quadrant B | 2,930,388 | 676,187 |
| Events in quadrant C | 5,155,453 | 608,808 |
| Events in quadrant D | 6,846,874 | 589,943 |
| Mode M9 | |||
|---|---|---|---|
| Quadrant | BADHDUFLAG | Total packets | Discarded packets |
| A | 0 | 10 | 0 |
| B | 0 | 10 | 0 |
| C | 0 | 10 | 0 |
| D | 0 | 10 | 0 |
| Mode M0 | |||
|---|---|---|---|
| Quadrant | BADHDUFLAG | Total packets | Discarded packets |
| A | 0 | 12019 | 1 |
| B | 0 | 12275 | 1 |
| C | 0 | 19612 | 1 |
| D | 0 | 24423 | 1 |
| Mode SS | |||
|---|---|---|---|
| Quadrant | BADHDUFLAG | Total packets | Discarded packets |
| A | 0 | 122 | 0 |
| B | 0 | 122 | 0 |
| C | 0 | 122 | 0 |
| D | 0 | 122 | 0 |
| Quadrant | Total seconds | Saturated seconds | Saturation percentage |
|---|---|---|---|
| A | 5850 | 56 | 0.957265% |
| B | 5851 | 70 | 1.196377% |
| C | 5851 | 717 | 12.254316% |
| D | 5851 | 854 | 14.595796% |
Noise dominated data is calculated using 1-second bins in cleaned event files. If a bin has >2000 counts, and if more than 50% of those come from <1% of pixels, then it is considered to be noise-dominated and hence unusable.
| Quadrant | # 1 sec bins | Bins with >0 counts | Bins with >2000 counts | High rate bins dominated by noise | Noise dominated (total time) | Noise dominated (detector-on time) | Marked lightcurve |
|---|---|---|---|---|---|---|---|
| A | 6920 | 5850 | 0 | 0 | 0.00% | 0.00% | 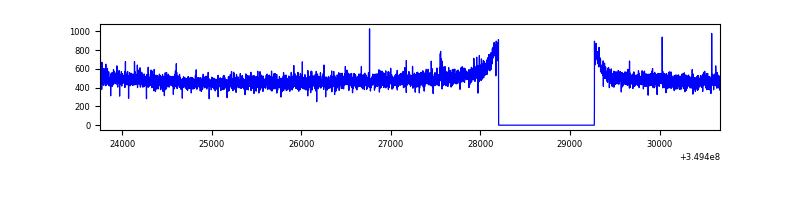 |
| B | 6921 | 5851 | 2 | 2 | 0.03% | 0.03% | 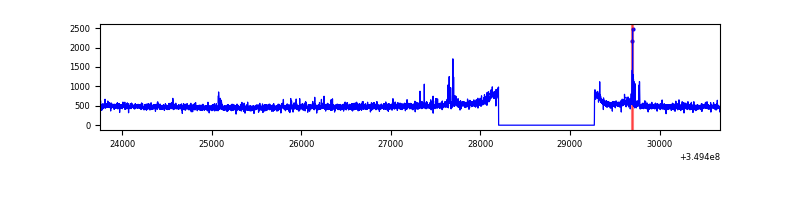 |
| C | 6921 | 5851 | 89 | 89 | 1.29% | 1.52% | 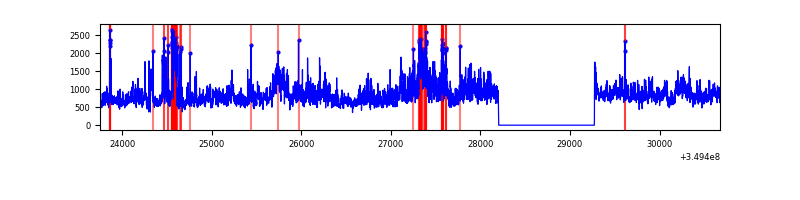 |
| D | 6921 | 5851 | 811 | 811 | 11.72% | 13.86% | 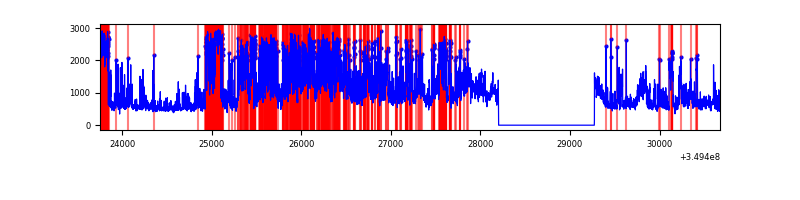 |
Top three noisy pixels from each quadrant. If the there are fewer than three noisy pixels in the level2.evt file, extra rows are filled as -1
| Pixel properties | Quadrant properties | ||||||
|---|---|---|---|---|---|---|---|
| Quadrant | DetID | PixID | Counts | Sigma | Mean | Median | Sigma |
| A | 13 | 254 | 10045 | 63.72 | 732 | 716 | 146.4 |
| A | 0 | 226 | 6470 | 39.3 | 732 | 716 | 146.4 |
| A | 3 | 137 | 6469 | 39.29 | 732 | 716 | 146.4 |
| B | 5 | 255 | 55445 | 399.8 | 728 | 710 | 136.9 |
| B | 12 | 111 | 15843 | 110.54 | 728 | 710 | 136.9 |
| B | 11 | 111 | 14163 | 98.26 | 728 | 710 | 136.9 |
| C | 3 | 233 | 1911580 | 12053.47 | 685 | 688 | 158.5 |
| C | 4 | 254 | 223378 | 1404.68 | 685 | 688 | 158.5 |
| C | 14 | 238 | 203929 | 1282.0 | 685 | 688 | 158.5 |
| D | 1 | 52 | 2890657 | 17645.16 | 688 | 671 | 163.8 |
| D | 8 | 195 | 797469 | 4864.95 | 688 | 671 | 163.8 |
| D | 12 | 33 | 238096 | 1449.63 | 688 | 671 | 163.8 |
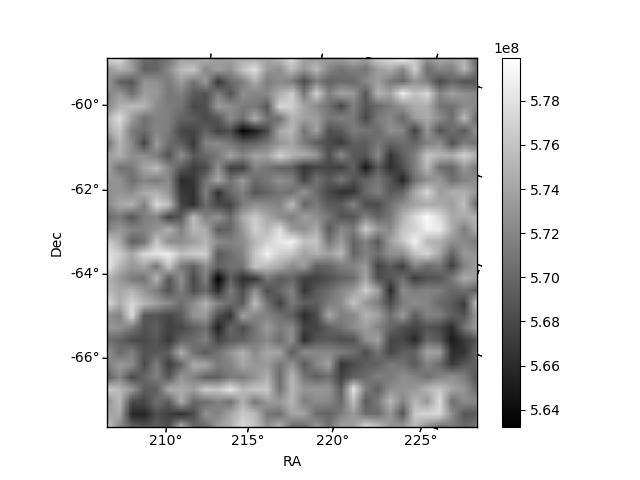
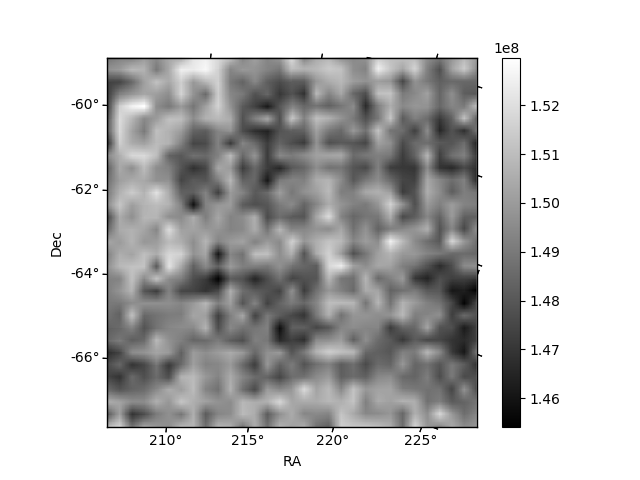
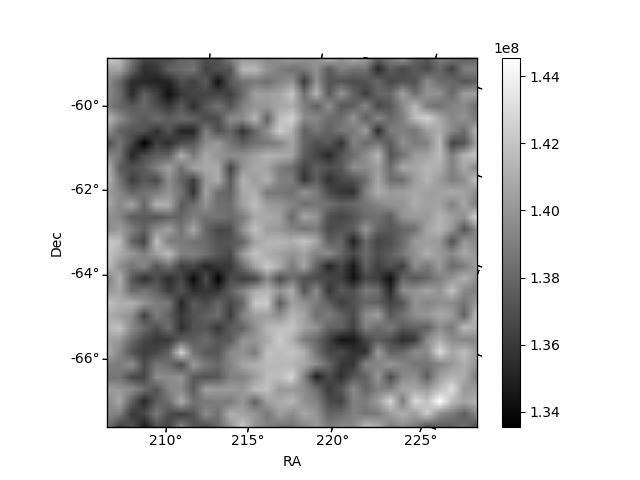
Histogram calculated using DETX and DETY for each event in the final _common_clean file
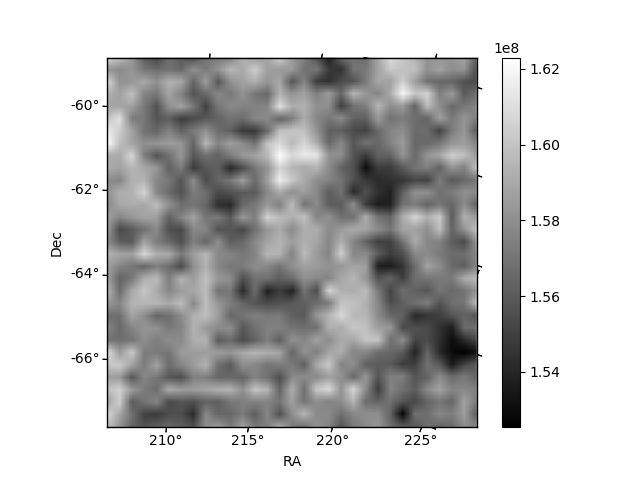
| Quadrant A | 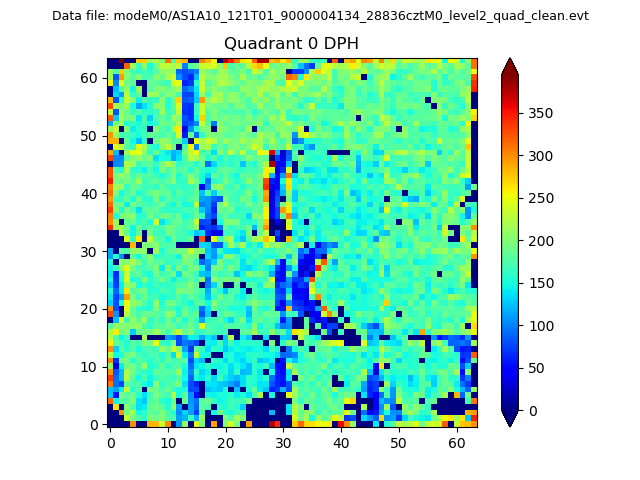 |
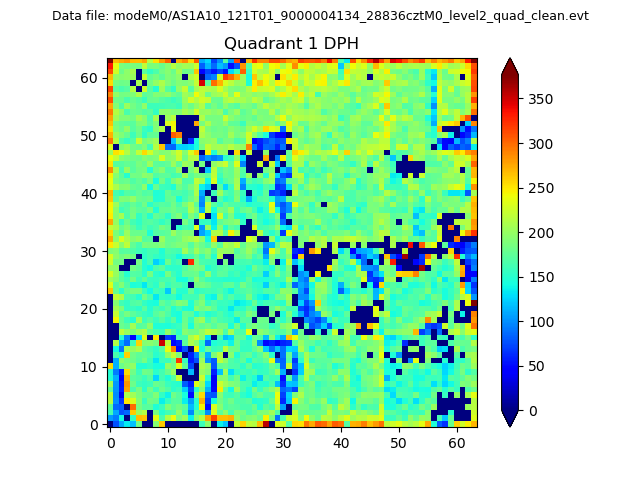 |
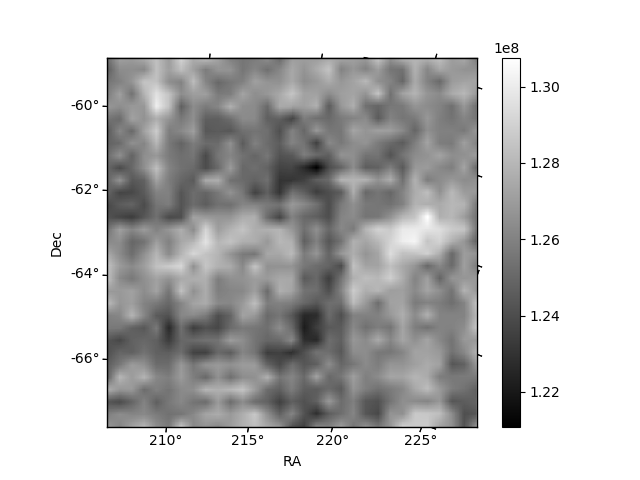
Quadrant B |
|---|---|---|---|
| Quadrant D | 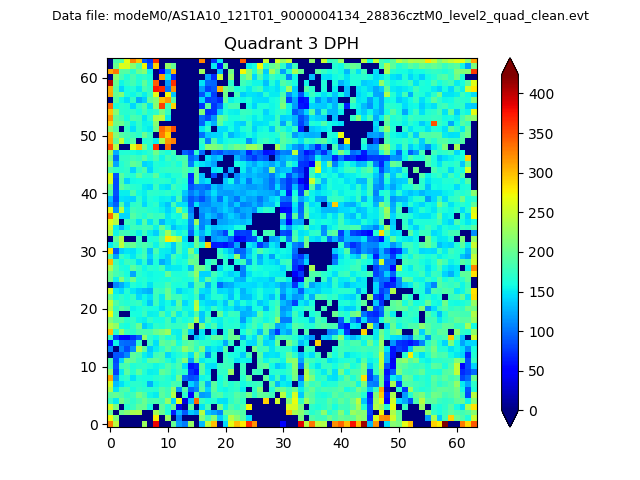 |
 |
Quadrant C |
| Plot type | Count rate plots | Images |
|---|---|---|
| Comparison with Poisson distribution Blue bars denote a histogram of data divided into 1 sec bins. Red curve is a Poisson curve with rate = median count rate of data. |
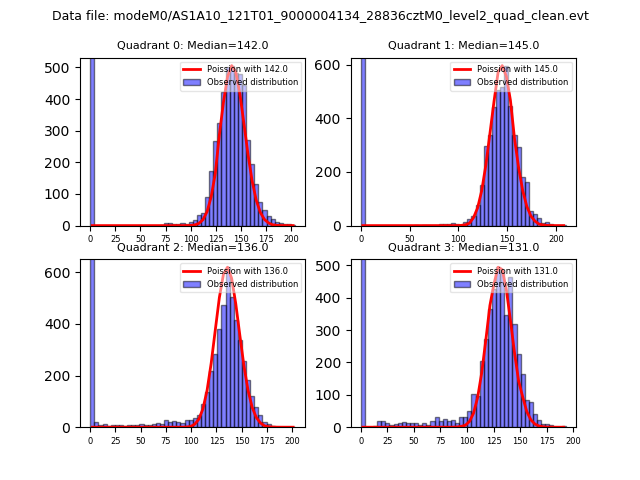 |
 |
| Quadrant-wise count rates Data is divided into 100 sec bins |
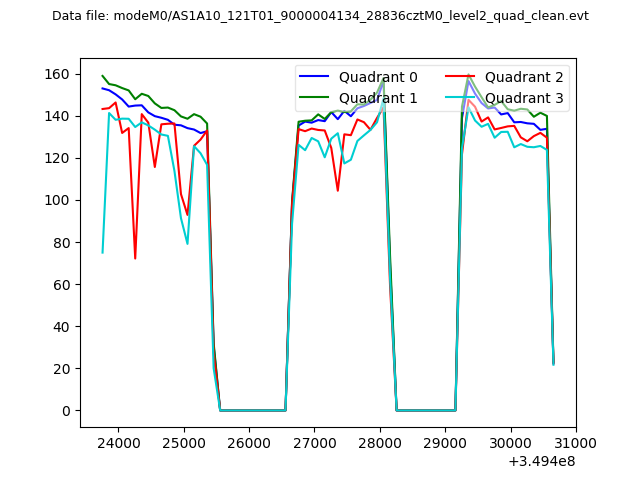 |
|
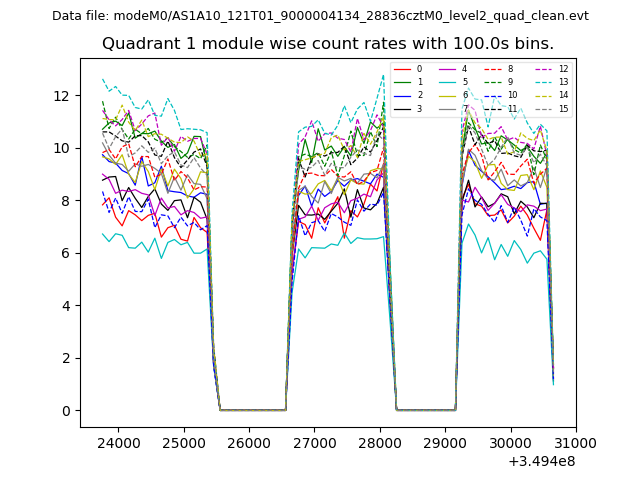
| Module-wise count rates for Quadrant A Data is divided into 100 sec bins |
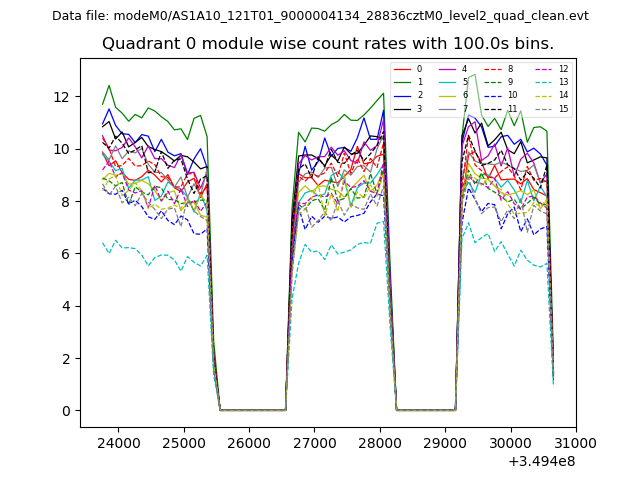 |
 |
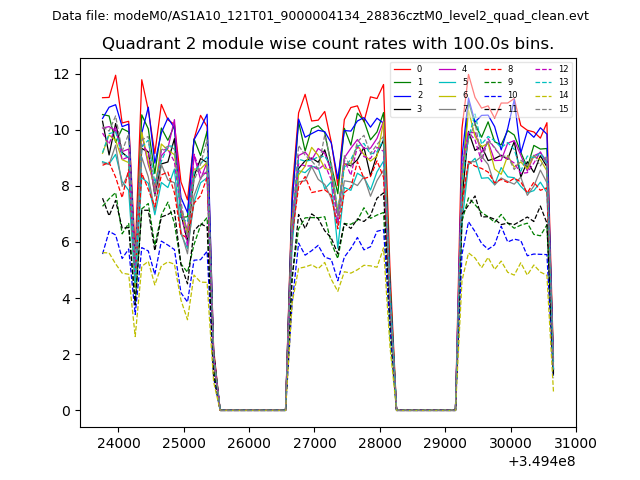
| Module-wise count rates for Quadrant B Data is divided into 100 sec bins |
 |
 |
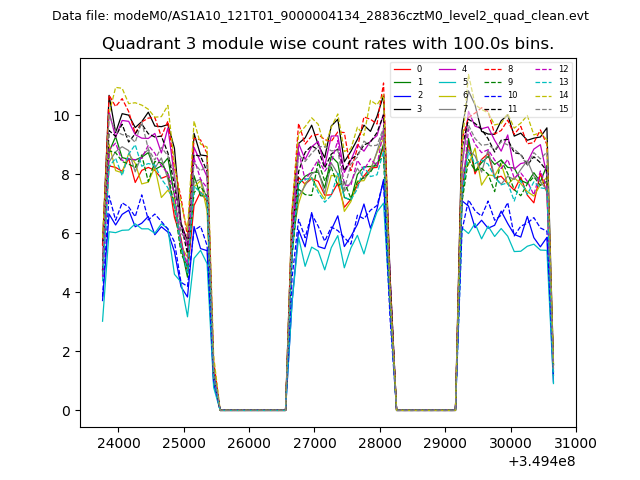
| Module-wise count rates for Quadrant C Data is divided into 100 sec bins |
 |
 |
| Module-wise count rates for Quadrant D Data is divided into 100 sec bins |
 |
 |
| Parameter | Plot |
|---|---|
| CZT HV Monitor | 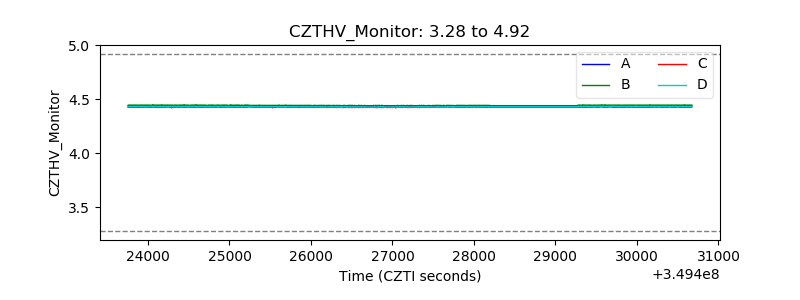 |
| D_VDD | 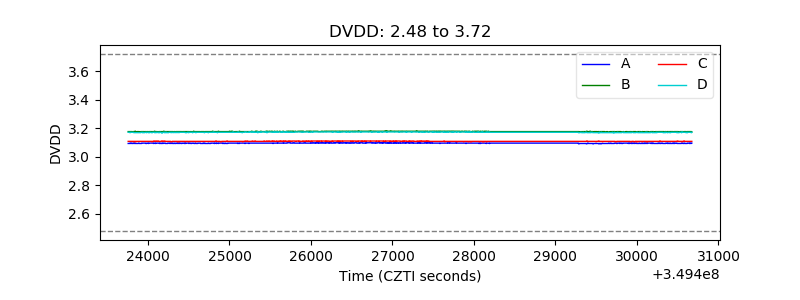 |
| Temperature 1 | 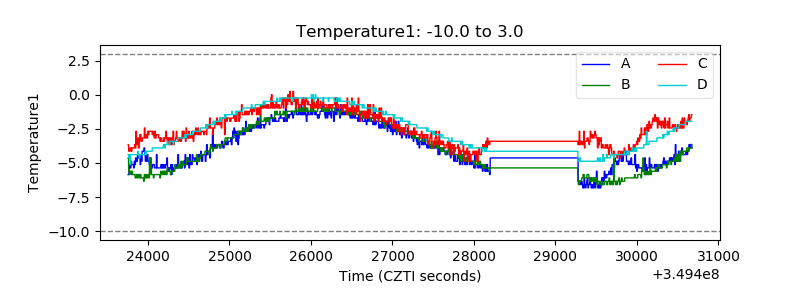 |
| Veto HV Monitor | 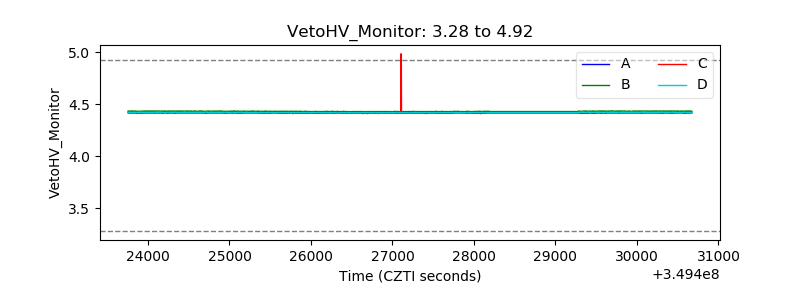 |
| Veto LLD | 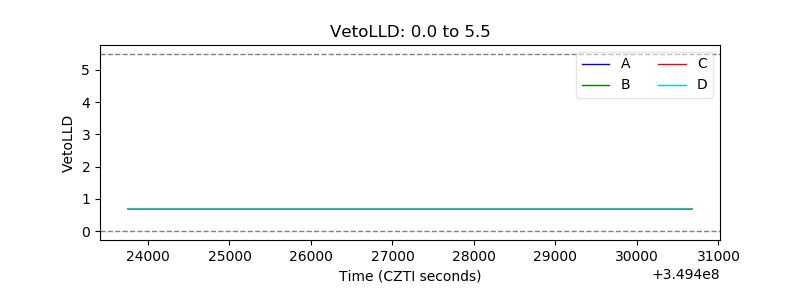 |
| Alpha Counter | 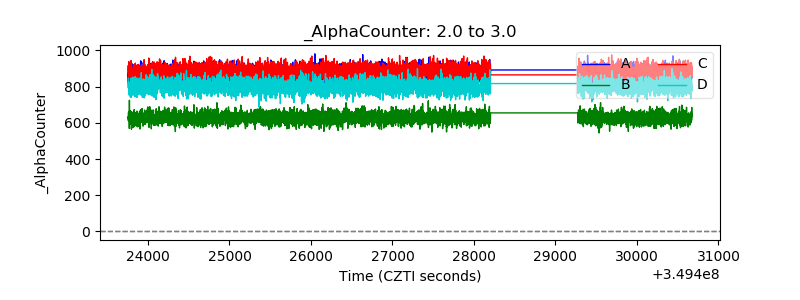 |
| _CPM_Rate | 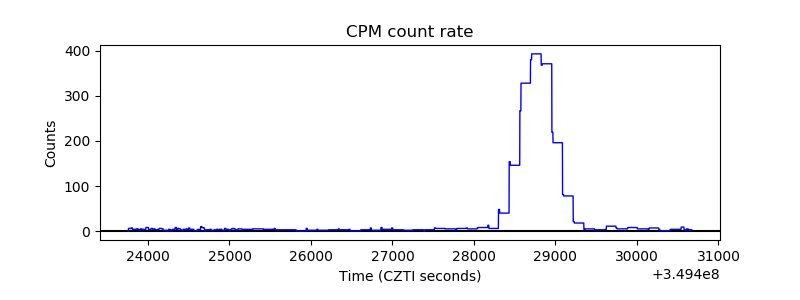 |
| CZT Counter | 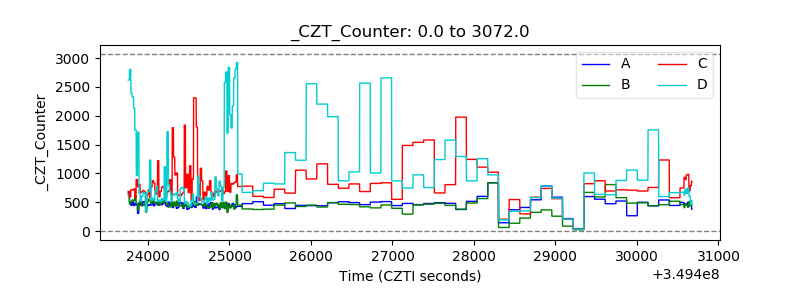 |
| +2.5 Volts monitor |  |
| +5 Volts monitor | 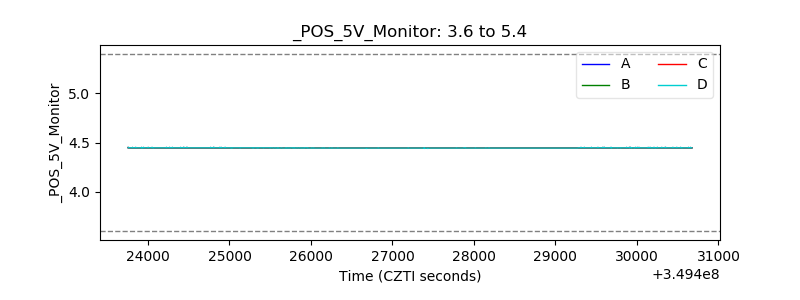 |
| _ROLL_ROT | 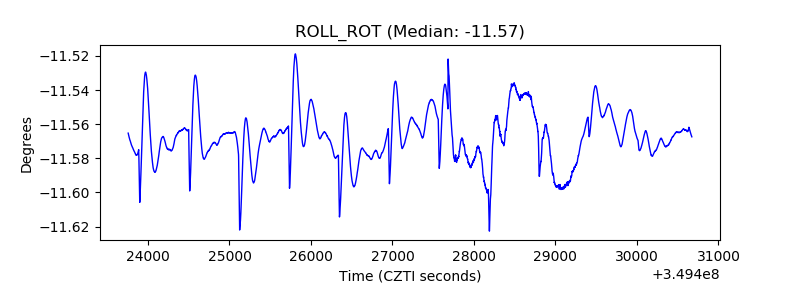 |
| _Roll_DEC | 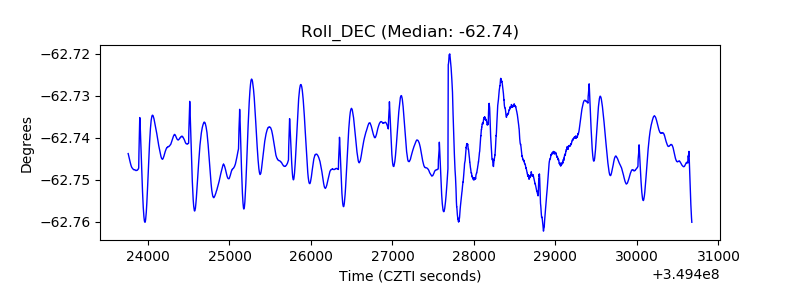 |
| _Roll_RA | 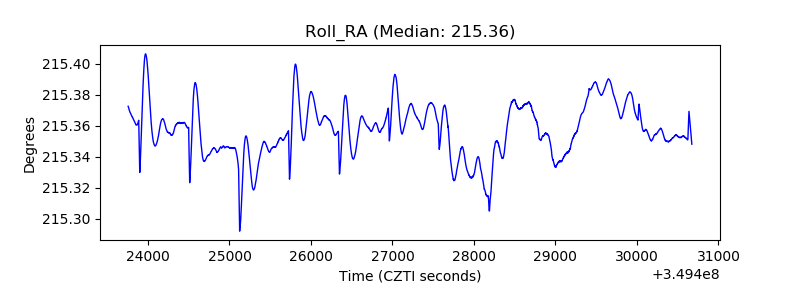 |
| Veto Counter | 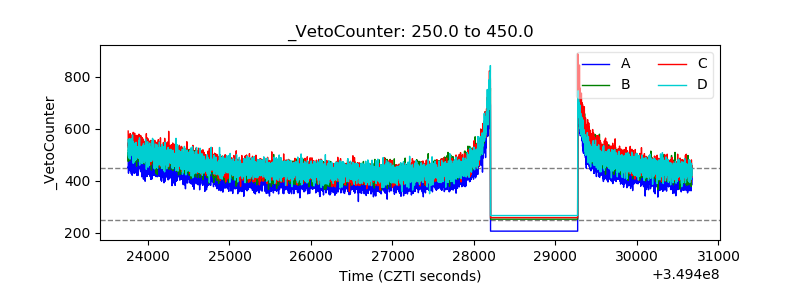 |