| Param | Original file | Final file |
|---|---|---|
| Filename | modeM0/AS1A10_121T01_9000004134_28838cztM0_level2.evt | modeM0/AS1A10_121T01_9000004134_28838cztM0_level2_quad_clean.evt |
| Size (bytes) | 715,659,840 | 108,469,440 |
| Size | 682.5 MB | 103.4 MB |
| Events in quadrant A | 3,631,049 | 715,137 |
| Events in quadrant B | 3,709,454 | 734,916 |
| Events in quadrant C | 7,743,591 | 660,864 |
| Events in quadrant D | 6,103,115 | 672,295 |
| Mode M9 | |||
|---|---|---|---|
| Quadrant | BADHDUFLAG | Total packets | Discarded packets |
| A | 0 | 2 | 0 |
| B | 0 | 2 | 0 |
| C | 0 | 2 | 0 |
| D | 0 | 2 | 0 |
| Mode M0 | |||
|---|---|---|---|
| Quadrant | BADHDUFLAG | Total packets | Discarded packets |
| A | 0 | 15262 | 1 |
| B | 0 | 15625 | 1 |
| C | 0 | 28222 | 1 |
| D | 0 | 23129 | 1 |
| Mode SS | |||
|---|---|---|---|
| Quadrant | BADHDUFLAG | Total packets | Discarded packets |
| A | 0 | 148 | 0 |
| B | 0 | 148 | 0 |
| C | 0 | 148 | 0 |
| D | 0 | 148 | 0 |
| Quadrant | Total seconds | Saturated seconds | Saturation percentage |
|---|---|---|---|
| A | 7196 | 280 | 3.891051% |
| B | 7197 | 345 | 4.793664% |
| C | 7197 | 1282 | 17.812978% |
| D | 7197 | 525 | 7.294706% |
Noise dominated data is calculated using 1-second bins in cleaned event files. If a bin has >2000 counts, and if more than 50% of those come from <1% of pixels, then it is considered to be noise-dominated and hence unusable.
| Quadrant | # 1 sec bins | Bins with >0 counts | Bins with >2000 counts | High rate bins dominated by noise | Noise dominated (total time) | Noise dominated (detector-on time) | Marked lightcurve |
|---|---|---|---|---|---|---|---|
| A | 7341 | 7196 | 0 | 0 | 0.00% | 0.00% | 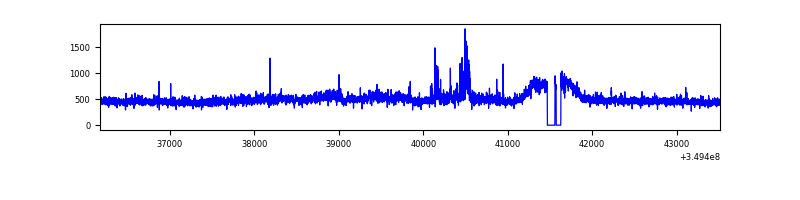 |
| B | 7342 | 7197 | 47 | 47 | 0.64% | 0.65% | 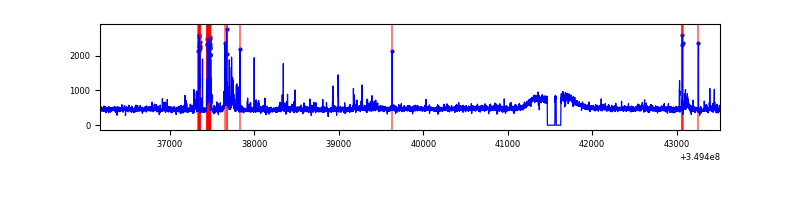 |
| C | 7342 | 7197 | 423 | 423 | 5.76% | 5.88% | 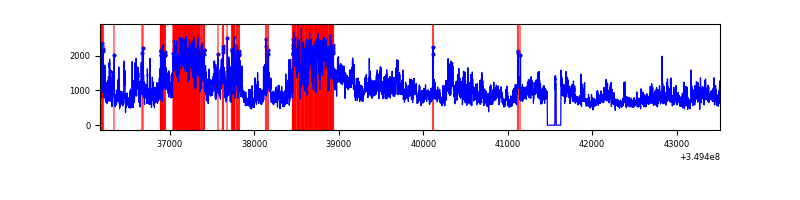 |
| D | 7342 | 7197 | 286 | 286 | 3.90% | 3.97% | 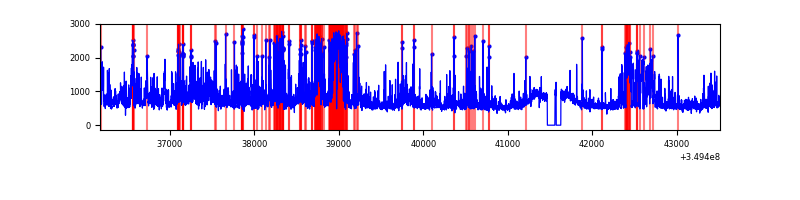 |
Top three noisy pixels from each quadrant. If the there are fewer than three noisy pixels in the level2.evt file, extra rows are filled as -1
| Pixel properties | Quadrant properties | ||||||
|---|---|---|---|---|---|---|---|
| Quadrant | DetID | PixID | Counts | Sigma | Mean | Median | Sigma |
| A | 4 | 2 | 147740 | 831.89 | 875 | 854 | 176.6 |
| A | 14 | 235 | 101051 | 567.47 | 875 | 854 | 176.6 |
| A | 13 | 254 | 13267 | 70.3 | 875 | 854 | 176.6 |
| B | 5 | 255 | 121631 | 726.88 | 870 | 846 | 166.2 |
| B | 5 | 172 | 93461 | 557.35 | 870 | 846 | 166.2 |
| B | 10 | 245 | 32793 | 192.26 | 870 | 846 | 166.2 |
| C | 3 | 233 | 4217630 | 22013.4 | 818 | 824 | 191.6 |
| C | 14 | 238 | 209102 | 1087.29 | 818 | 824 | 191.6 |
| C | 14 | 254 | 118011 | 611.76 | 818 | 824 | 191.6 |
| D | 8 | 195 | 1009672 | 5000.33 | 853 | 828 | 201.8 |
| D | 1 | 52 | 722138 | 3575.17 | 853 | 828 | 201.8 |
| D | 13 | 104 | 611768 | 3028.12 | 853 | 828 | 201.8 |
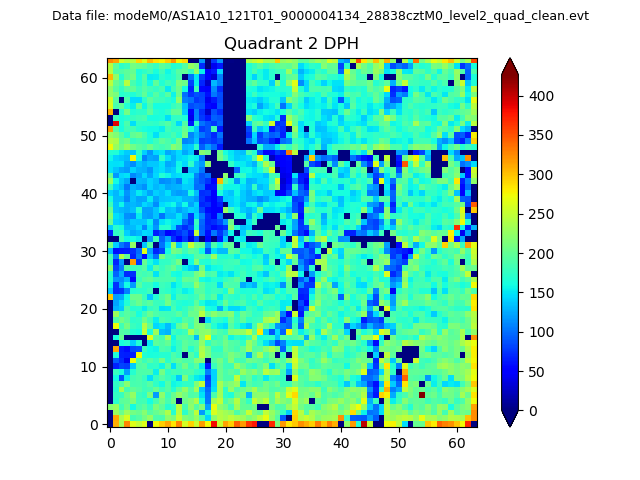
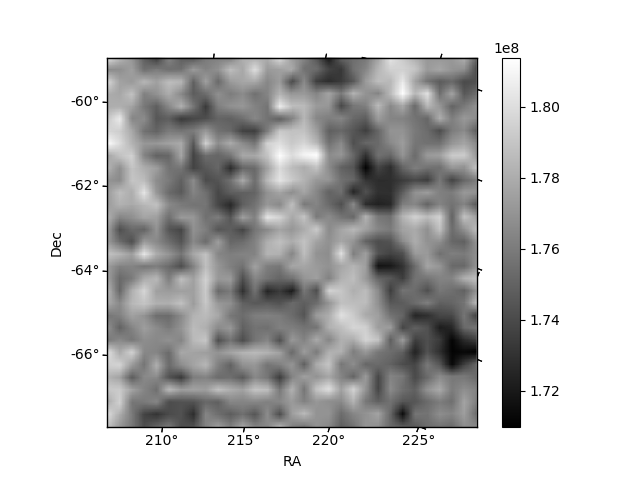
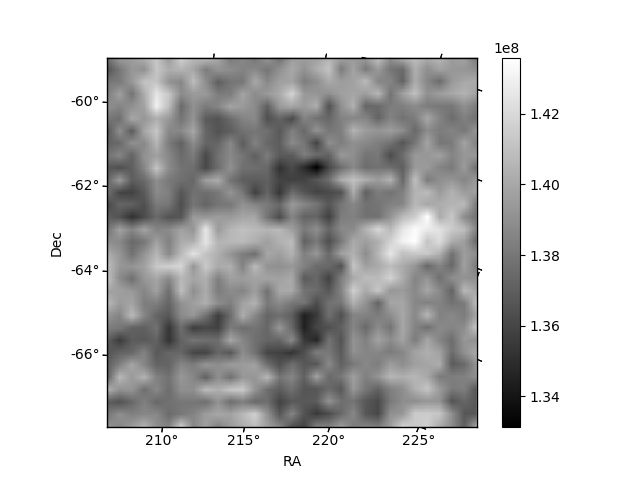
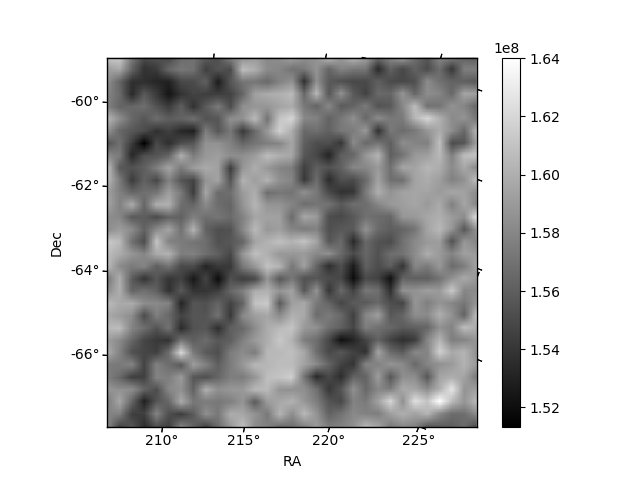
Histogram calculated using DETX and DETY for each event in the final _common_clean file
| Quadrant A | 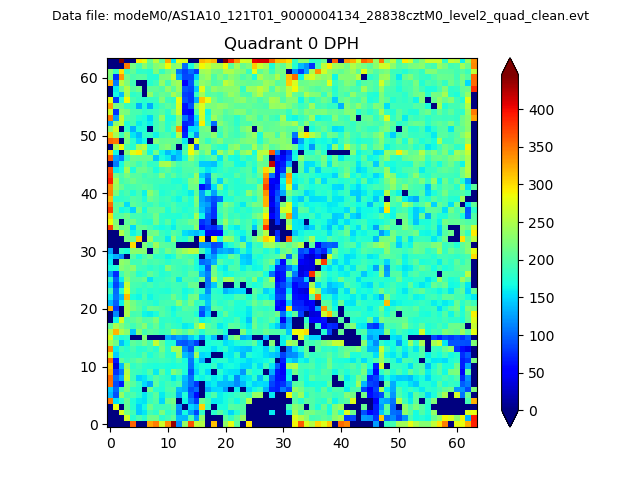 |
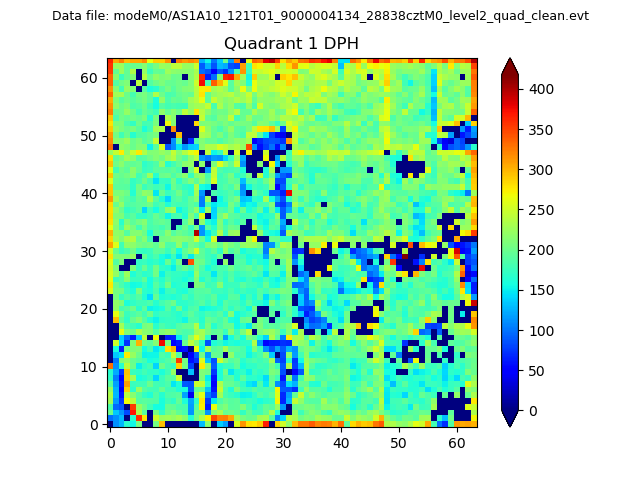 |
Quadrant B |
|---|---|---|---|
| Quadrant D | 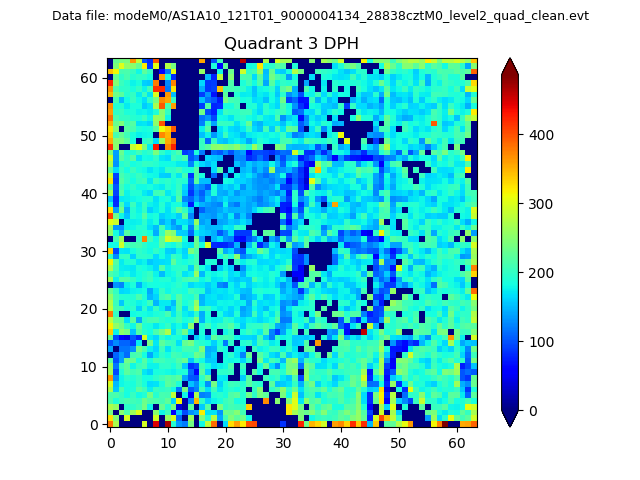 |
 |
Quadrant C |
| Plot type | Count rate plots | Images |
|---|---|---|
| Comparison with Poisson distribution Blue bars denote a histogram of data divided into 1 sec bins. Red curve is a Poisson curve with rate = median count rate of data. |
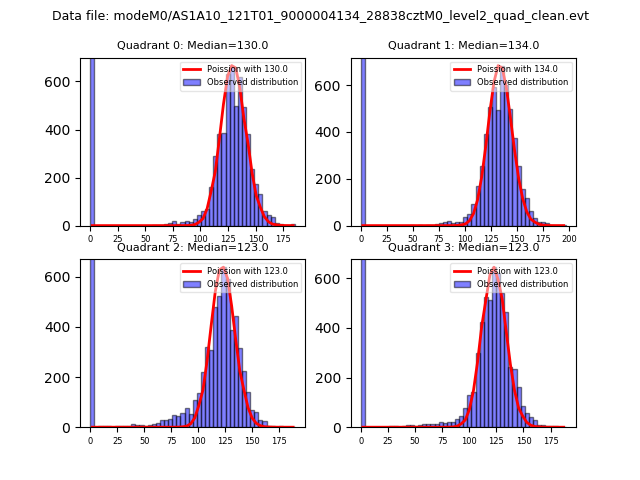 |
 |
| Quadrant-wise count rates Data is divided into 100 sec bins |
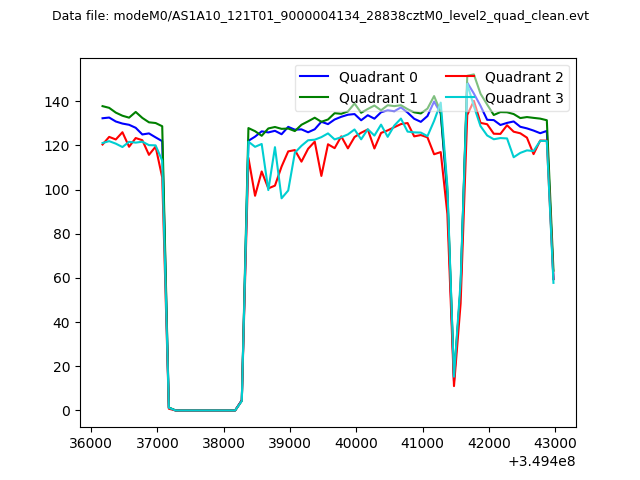 |
|
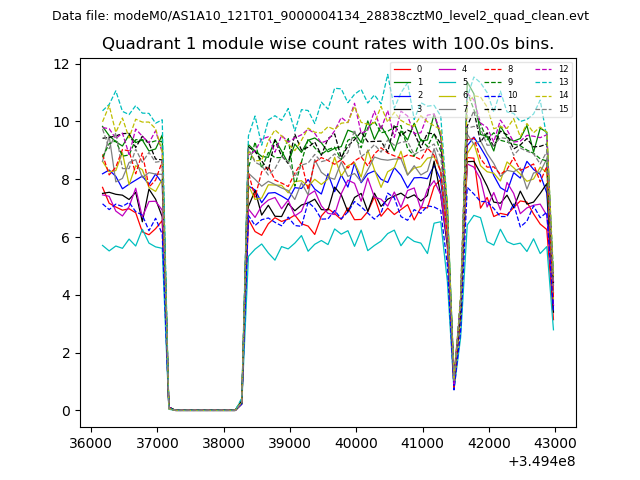
| Module-wise count rates for Quadrant A Data is divided into 100 sec bins |
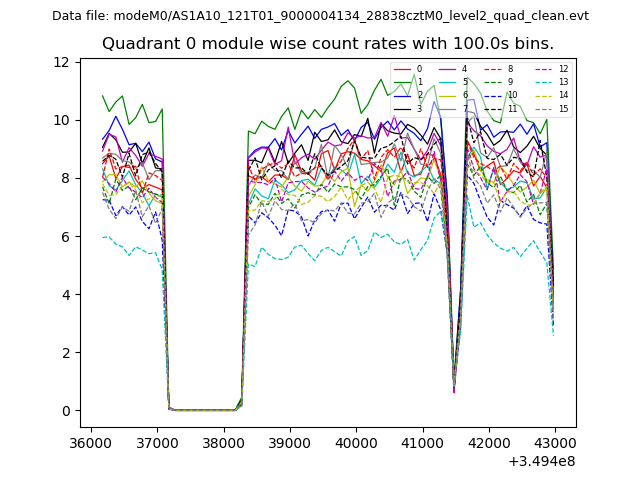 |
 |
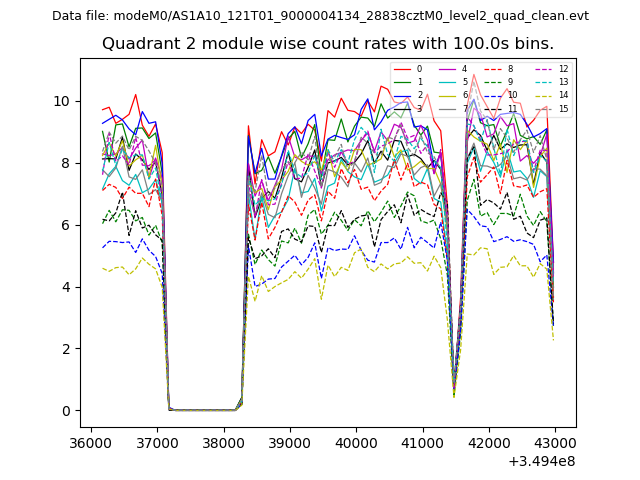
| Module-wise count rates for Quadrant B Data is divided into 100 sec bins |
 |
 |
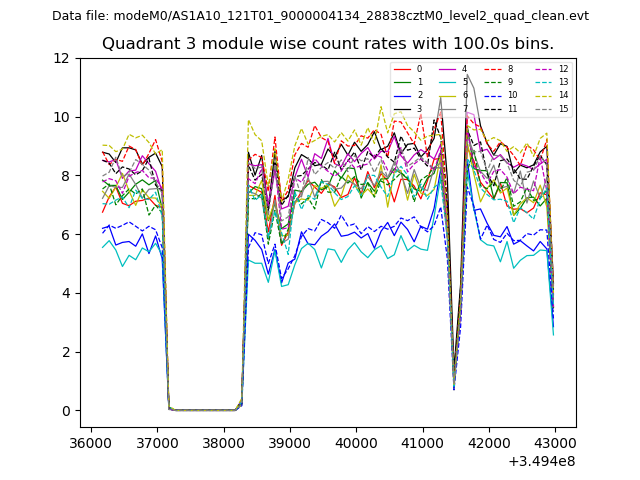
| Module-wise count rates for Quadrant C Data is divided into 100 sec bins |
 |
 |
| Module-wise count rates for Quadrant D Data is divided into 100 sec bins |
 |
 |
| Parameter | Plot |
|---|---|
| CZT HV Monitor | 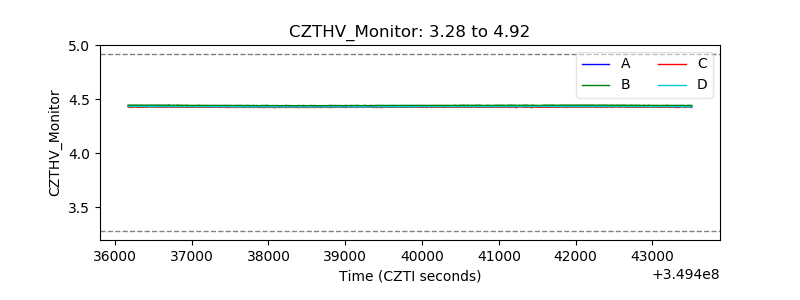 |
| D_VDD | 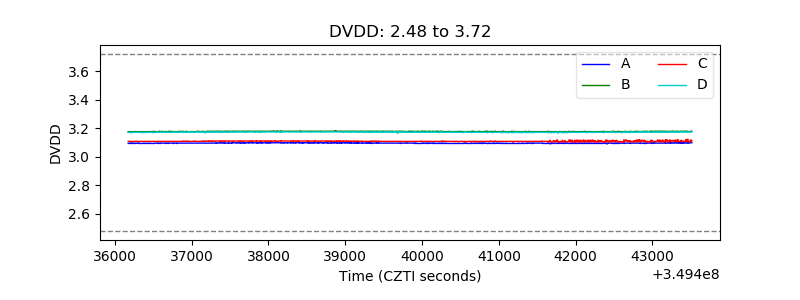 |
| Temperature 1 | 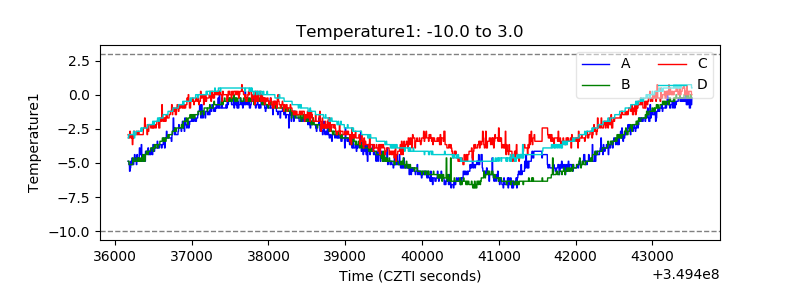 |
| Veto HV Monitor |  |
| Veto LLD | 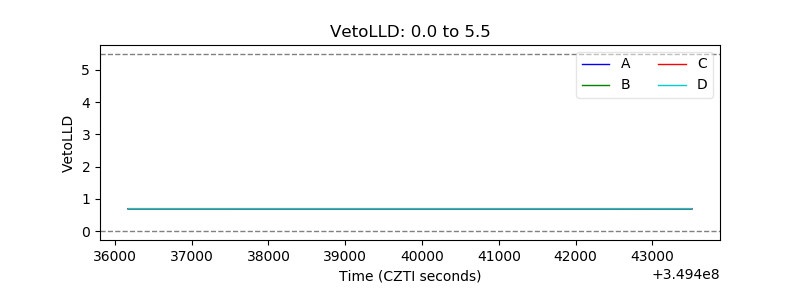 |
| Alpha Counter | 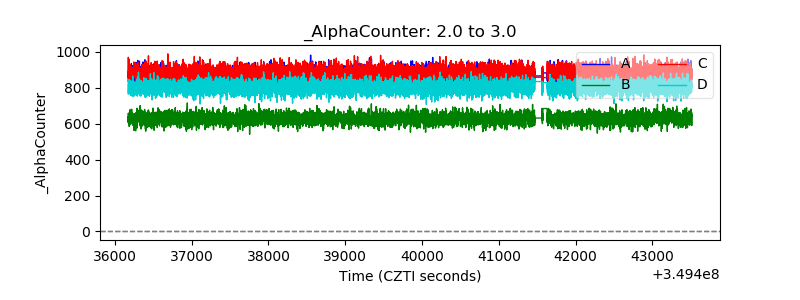 |
| _CPM_Rate | 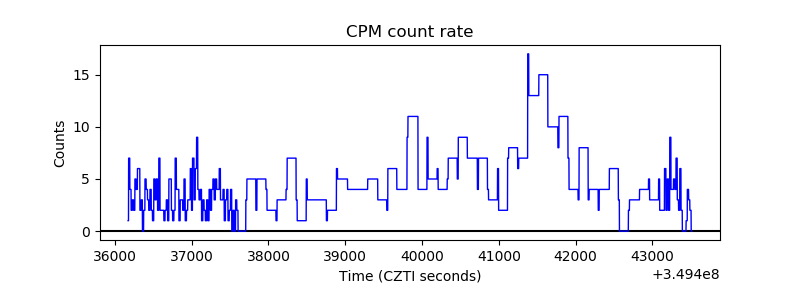 |
| CZT Counter | 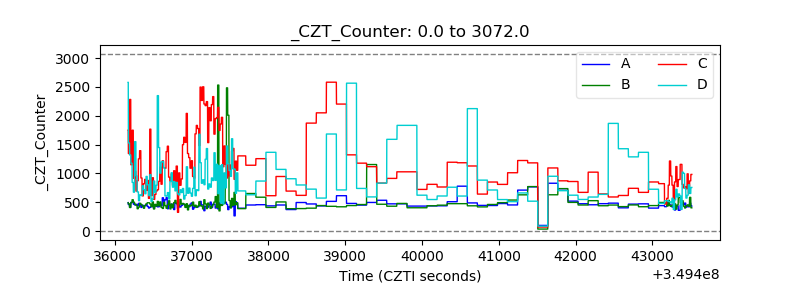 |
| +2.5 Volts monitor |  |
| +5 Volts monitor | 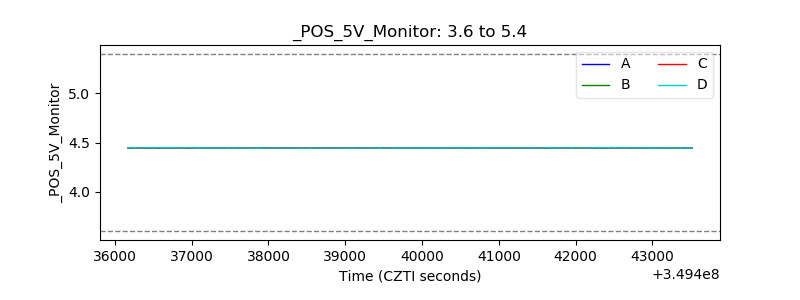 |
| _ROLL_ROT | 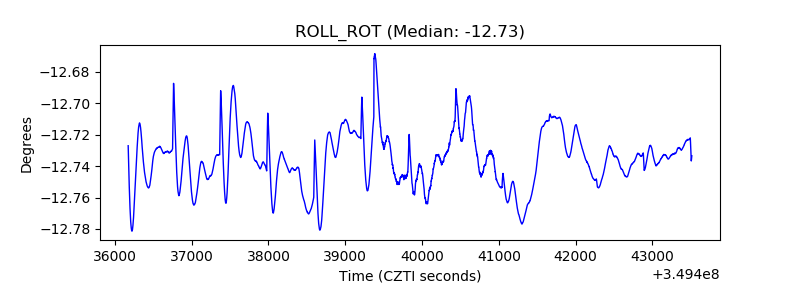 |
| _Roll_DEC | 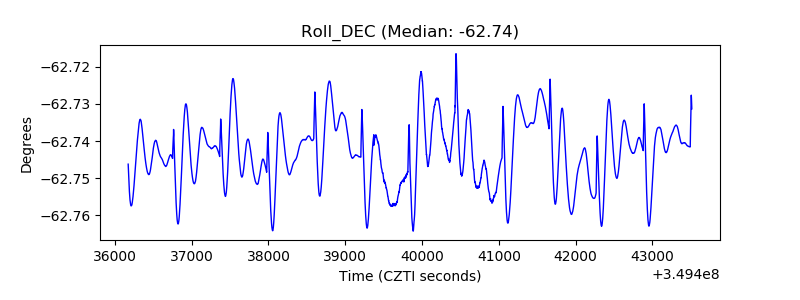 |
| _Roll_RA | 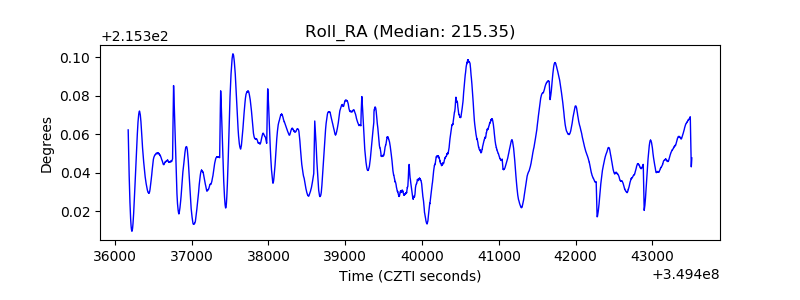 |
| Veto Counter | 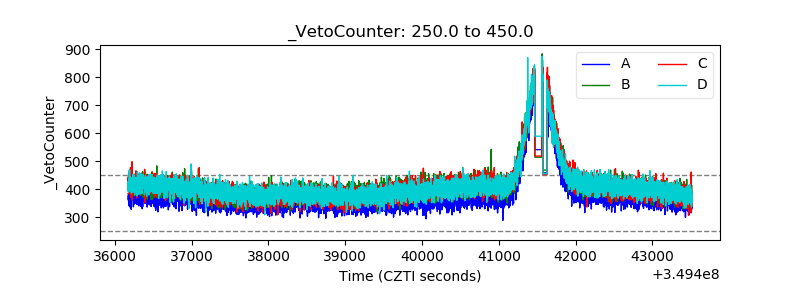 |