| Param | Original file | Final file |
|---|---|---|
| Filename | modeM0/AS1A10_121T01_9000004134_28843cztM0_level2.evt | modeM0/AS1A10_121T01_9000004134_28843cztM0_level2_quad_clean.evt |
| Size (bytes) | 894,709,440 | 137,612,160 |
| Size | 853.3 MB | 131.2 MB |
| Events in quadrant A | 4,465,754 | 920,448 |
| Events in quadrant B | 4,541,766 | 935,975 |
| Events in quadrant C | 4,985,020 | 888,877 |
| Events in quadrant D | 12,498,620 | 799,831 |
| Mode M9 | |||
|---|---|---|---|
| Quadrant | BADHDUFLAG | Total packets | Discarded packets |
| A | 0 | 12 | 0 |
| B | 0 | 12 | 0 |
| C | 0 | 12 | 0 |
| D | 0 | 12 | 0 |
| Mode M0 | |||
|---|---|---|---|
| Quadrant | BADHDUFLAG | Total packets | Discarded packets |
| A | 0 | 18925 | 2 |
| B | 0 | 19059 | 2 |
| C | 0 | 20453 | 2 |
| D | 0 | 43478 | 2 |
| Mode SS | |||
|---|---|---|---|
| Quadrant | BADHDUFLAG | Total packets | Discarded packets |
| A | 0 | 184 | 0 |
| B | 0 | 184 | 0 |
| C | 0 | 184 | 0 |
| D | 0 | 184 | 0 |
| Quadrant | Total seconds | Saturated seconds | Saturation percentage |
|---|---|---|---|
| A | 8959 | 121 | 1.350597% |
| B | 8959 | 153 | 1.707780% |
| C | 8959 | 345 | 3.850876% |
| D | 8960 | 2147 | 23.962054% |
Noise dominated data is calculated using 1-second bins in cleaned event files. If a bin has >2000 counts, and if more than 50% of those come from <1% of pixels, then it is considered to be noise-dominated and hence unusable.
| Quadrant | # 1 sec bins | Bins with >0 counts | Bins with >2000 counts | High rate bins dominated by noise | Noise dominated (total time) | Noise dominated (detector-on time) | Marked lightcurve |
|---|---|---|---|---|---|---|---|
| A | 10214 | 8959 | 7 | 7 | 0.07% | 0.08% | 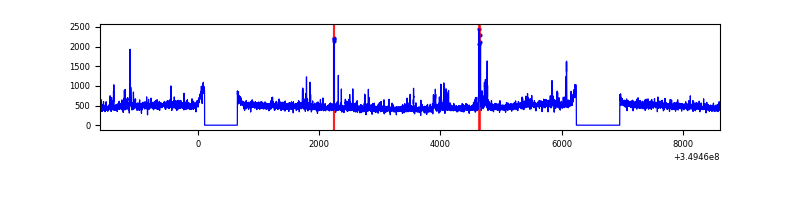 |
| B | 10214 | 8959 | 25 | 25 | 0.24% | 0.28% | 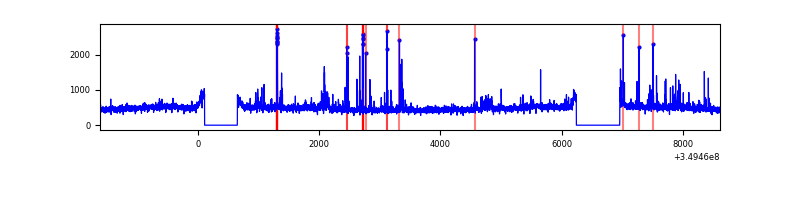 |
| C | 10214 | 8959 | 0 | 0 | 0.00% | 0.00% | 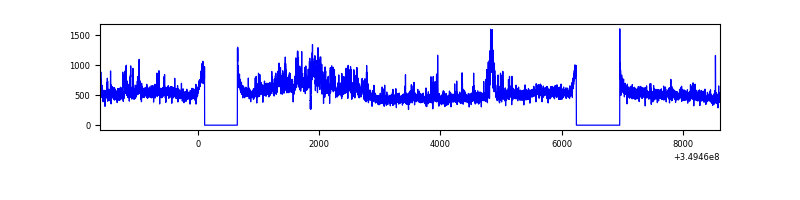 |
| D | 10215 | 8960 | 1938 | 1938 | 18.97% | 21.63% | 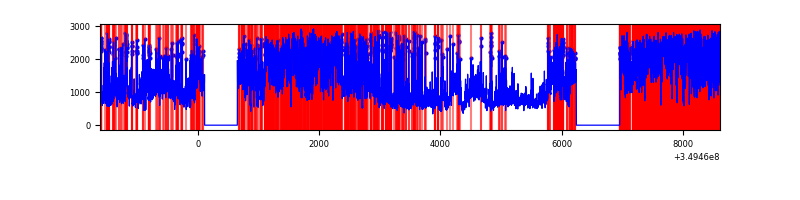 |
Top three noisy pixels from each quadrant. If the there are fewer than three noisy pixels in the level2.evt file, extra rows are filled as -1
| Pixel properties | Quadrant properties | ||||||
|---|---|---|---|---|---|---|---|
| Quadrant | DetID | PixID | Counts | Sigma | Mean | Median | Sigma |
| A | 14 | 235 | 225185 | 1021.78 | 1091 | 1066 | 219.3 |
| A | 15 | 174 | 22368 | 97.12 | 1091 | 1066 | 219.3 |
| A | 13 | 254 | 16668 | 71.13 | 1091 | 1066 | 219.3 |
| B | 5 | 172 | 116784 | 562.06 | 1082 | 1054 | 205.9 |
| B | 5 | 255 | 58819 | 280.55 | 1082 | 1054 | 205.9 |
| B | 0 | 229 | 41880 | 198.28 | 1082 | 1054 | 205.9 |
| C | 3 | 233 | 525106 | 2162.08 | 1038 | 1045 | 242.4 |
| C | 14 | 238 | 234109 | 961.54 | 1038 | 1045 | 242.4 |
| C | 14 | 254 | 102664 | 419.24 | 1038 | 1045 | 242.4 |
| D | 8 | 195 | 5667441 | 23951.92 | 987 | 959 | 236.6 |
| D | 13 | 104 | 1702596 | 7192.73 | 987 | 959 | 236.6 |
| D | 1 | 52 | 995222 | 4202.7 | 987 | 959 | 236.6 |
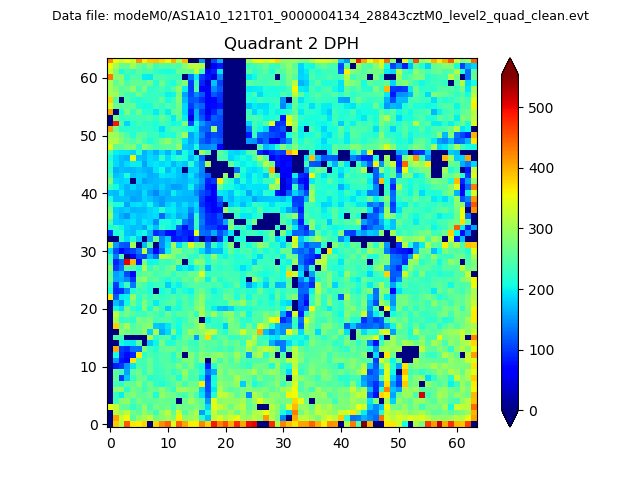
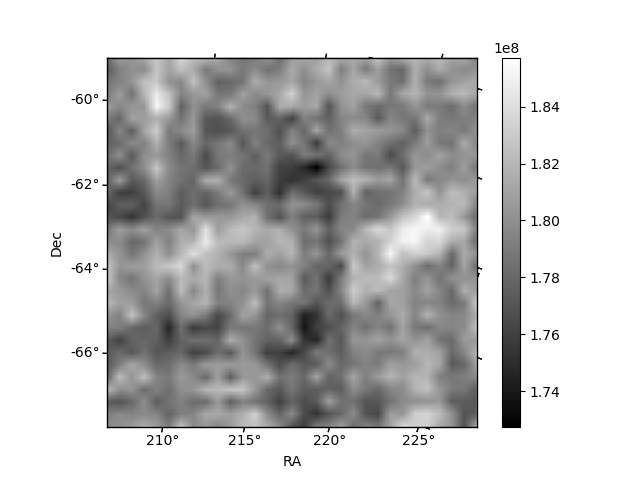
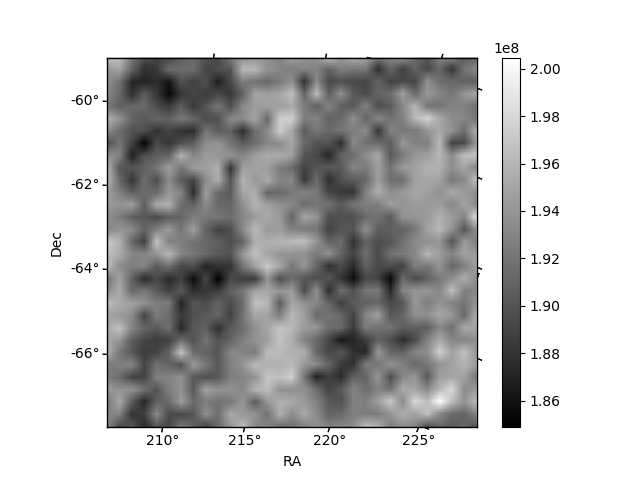
Histogram calculated using DETX and DETY for each event in the final _common_clean file
| Quadrant A | 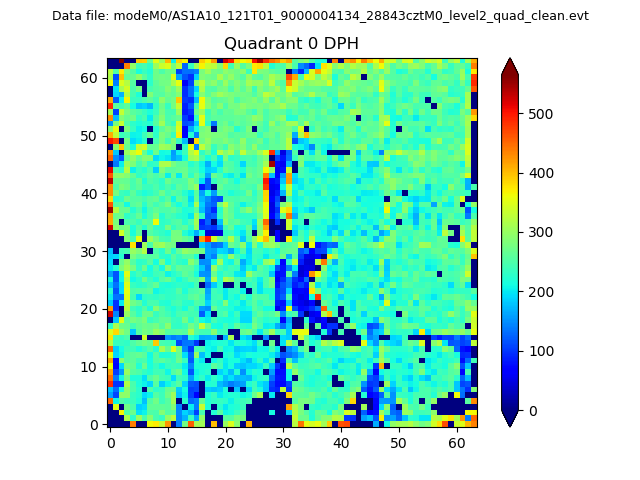 |
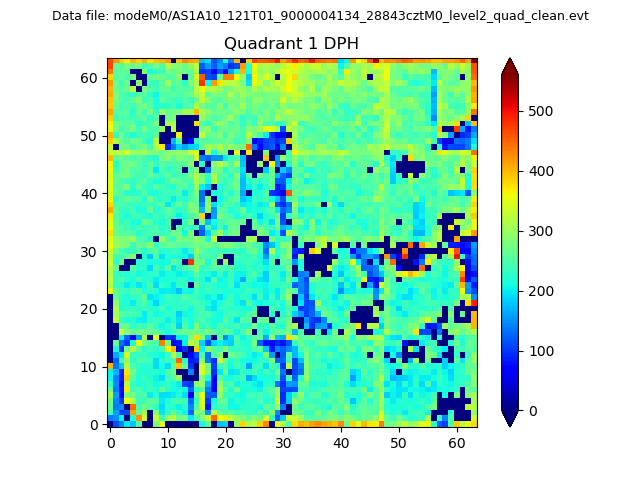 |
Quadrant B |
|---|---|---|---|
| Quadrant D | 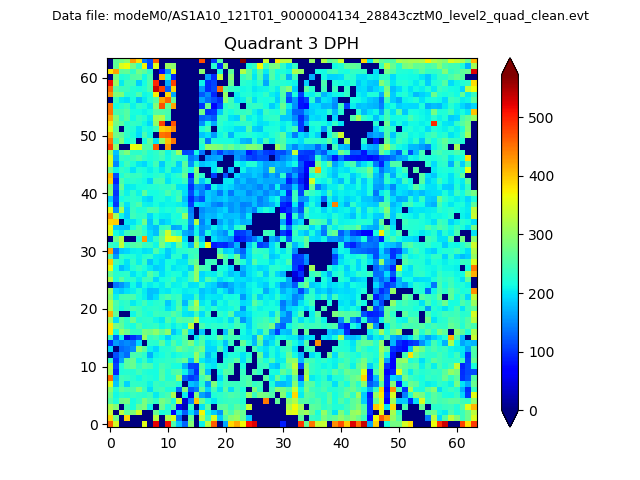 |
 |
Quadrant C |
| Plot type | Count rate plots | Images |
|---|---|---|
| Comparison with Poisson distribution Blue bars denote a histogram of data divided into 1 sec bins. Red curve is a Poisson curve with rate = median count rate of data. |
 |
 |
| Quadrant-wise count rates Data is divided into 100 sec bins |
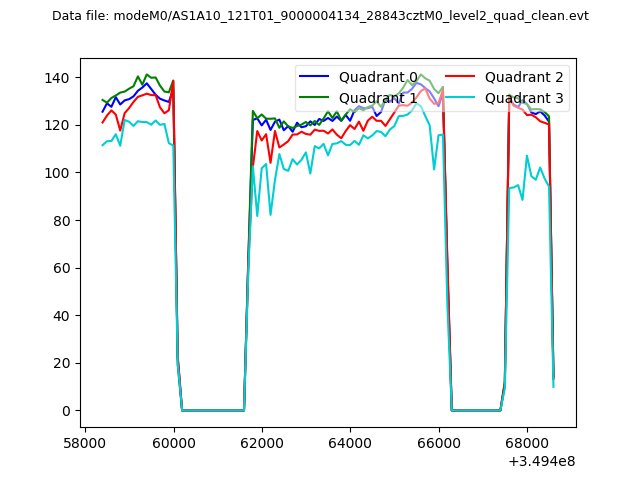 |
|
| Module-wise count rates for Quadrant A Data is divided into 100 sec bins |
 |
 |
| Module-wise count rates for Quadrant B Data is divided into 100 sec bins |
 |
 |
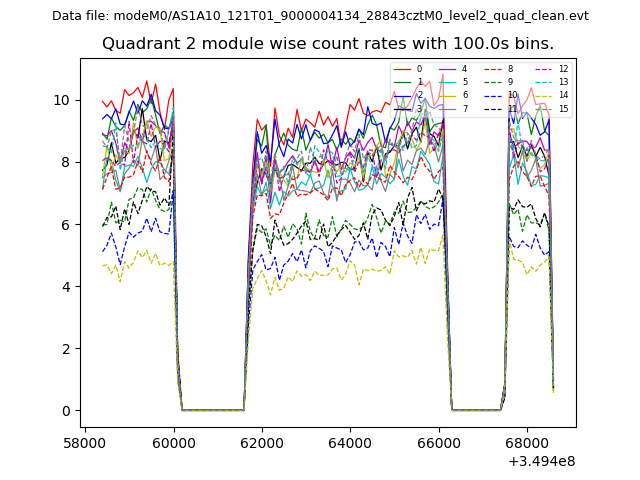
| Module-wise count rates for Quadrant C Data is divided into 100 sec bins |
 |
 |
| Module-wise count rates for Quadrant D Data is divided into 100 sec bins |
 |
 |
| Parameter | Plot |
|---|---|
| CZT HV Monitor | 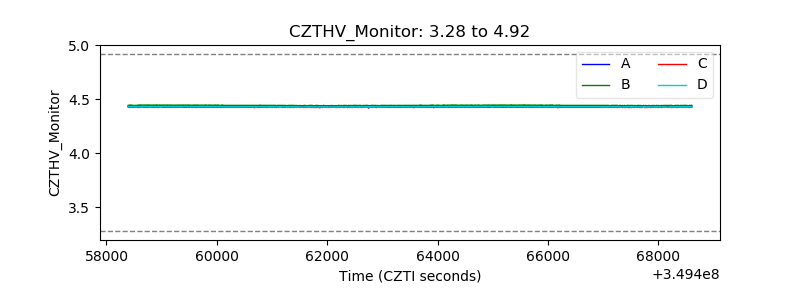 |
| D_VDD | 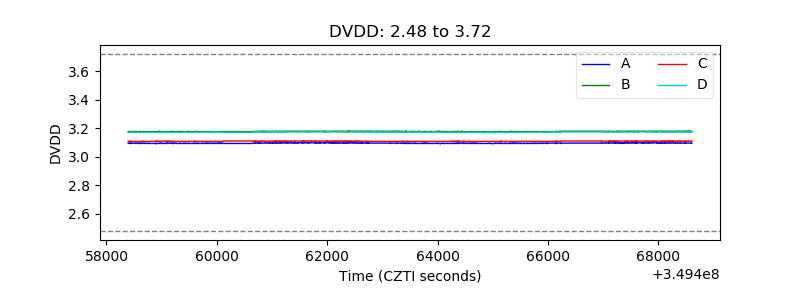 |
| Temperature 1 | 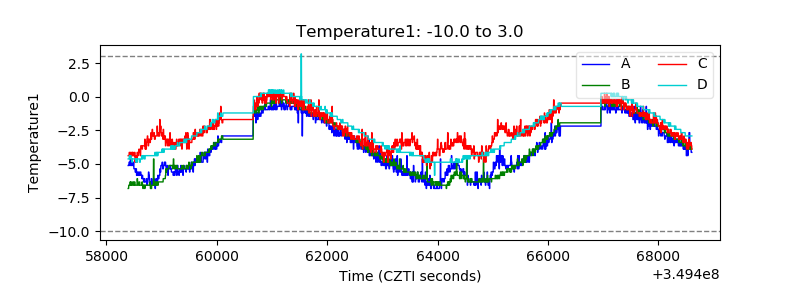 |
| Veto HV Monitor |  |
| Veto LLD | 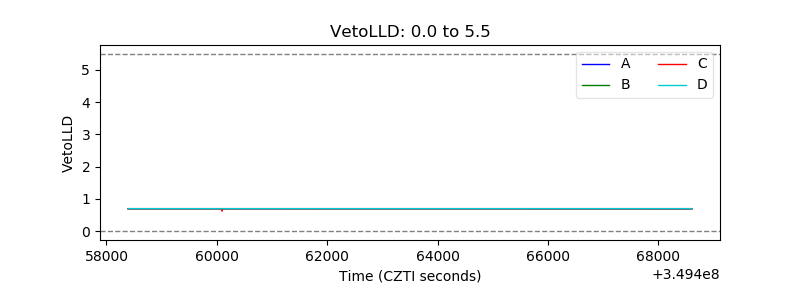 |
| Alpha Counter | 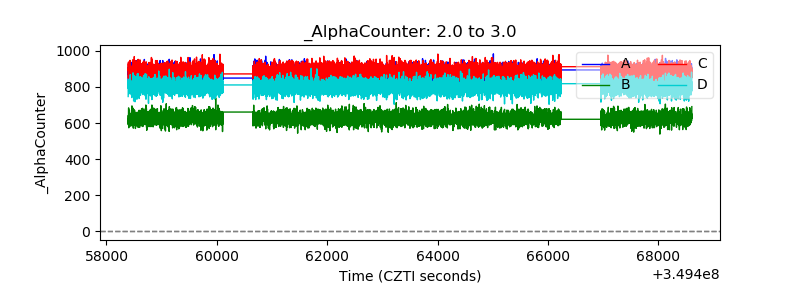 |
| _CPM_Rate | 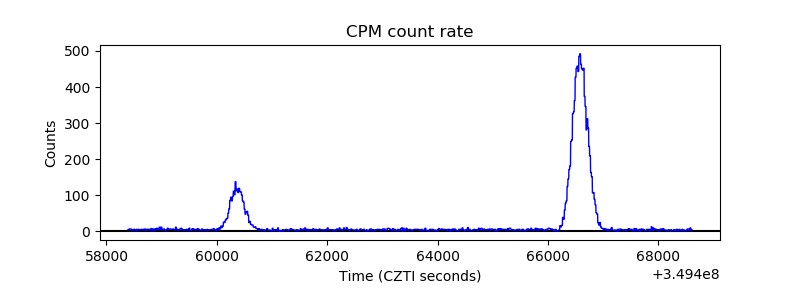 |
| CZT Counter |  |
| +2.5 Volts monitor |  |
| +5 Volts monitor |  |
| _ROLL_ROT | 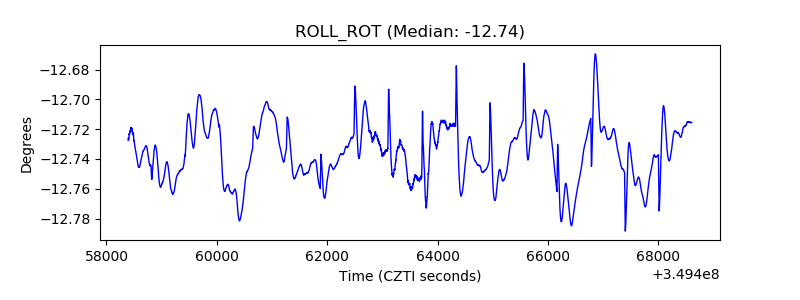 |
| _Roll_DEC | 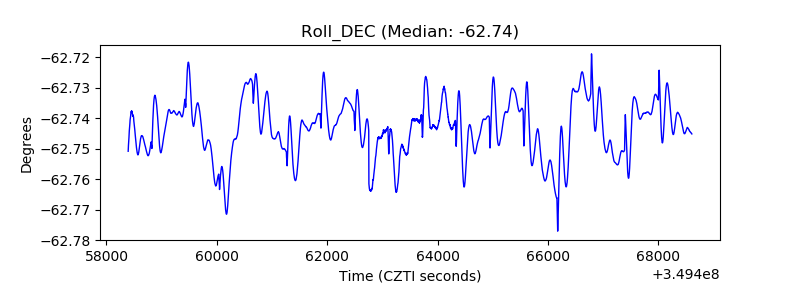 |
| _Roll_RA |  |
| Veto Counter | 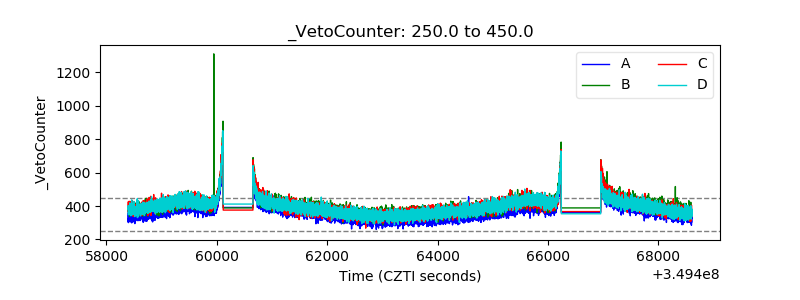 |