| Param | Original file | Final file |
|---|---|---|
| Filename | modeM0/AS1A10_103T08_9000004136_28846cztM0_level2.evt | modeM0/AS1A10_103T08_9000004136_28846cztM0_level2_quad_clean.evt |
| Size (bytes) | 705,625,920 | 124,879,680 |
| Size | 672.9 MB | 119.1 MB |
| Events in quadrant A | 3,072,978 | 891,781 |
| Events in quadrant B | 3,681,761 | 903,964 |
| Events in quadrant C | 3,120,808 | 860,824 |
| Events in quadrant D | 11,070,478 | 686,907 |
| Mode SS | |||
|---|---|---|---|
| Quadrant | BADHDUFLAG | Total packets | Discarded packets |
| A | 0 | 126 | 0 |
| B | 0 | 126 | 0 |
| C | 0 | 126 | 0 |
| D | 0 | 126 | 0 |
| Mode M9 | |||
|---|---|---|---|
| Quadrant | BADHDUFLAG | Total packets | Discarded packets |
| A | 0 | 12 | 0 |
| B | 0 | 12 | 0 |
| C | 0 | 12 | 0 |
| D | 0 | 12 | 0 |
| Mode M0 | |||
|---|---|---|---|
| Quadrant | BADHDUFLAG | Total packets | Discarded packets |
| A | 0 | 13178 | 1 |
| B | 0 | 14975 | 1 |
| C | 0 | 13182 | 1 |
| D | 0 | 37232 | 1 |
| Quadrant | Total seconds | Saturated seconds | Saturation percentage |
|---|---|---|---|
| A | 6280 | 24 | 0.382166% |
| B | 6280 | 142 | 2.261146% |
| C | 6280 | 82 | 1.305732% |
| D | 6281 | 2292 | 36.491005% |
Noise dominated data is calculated using 1-second bins in cleaned event files. If a bin has >2000 counts, and if more than 50% of those come from <1% of pixels, then it is considered to be noise-dominated and hence unusable.
| Quadrant | # 1 sec bins | Bins with >0 counts | Bins with >2000 counts | High rate bins dominated by noise | Noise dominated (total time) | Noise dominated (detector-on time) | Marked lightcurve |
|---|---|---|---|---|---|---|---|
| A | 7440 | 6280 | 0 | 0 | 0.00% | 0.00% | 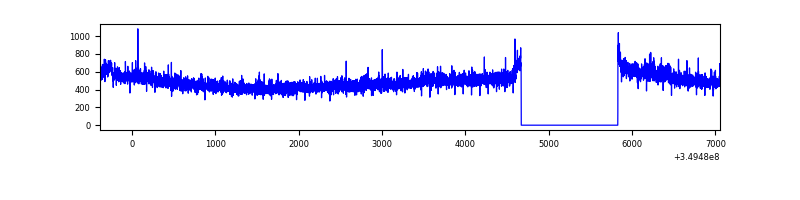 |
| B | 7440 | 6280 | 63 | 63 | 0.85% | 1.00% | 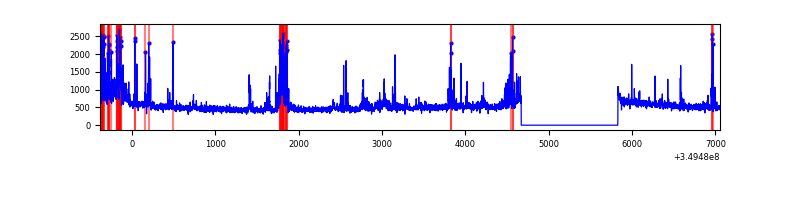 |
| C | 7440 | 6280 | 2 | 2 | 0.03% | 0.03% | 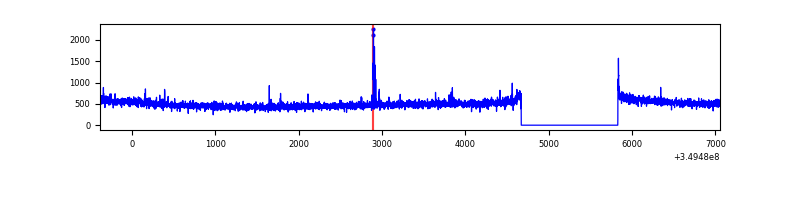 |
| D | 7440 | 6280 | 2283 | 2283 | 30.69% | 36.35% | 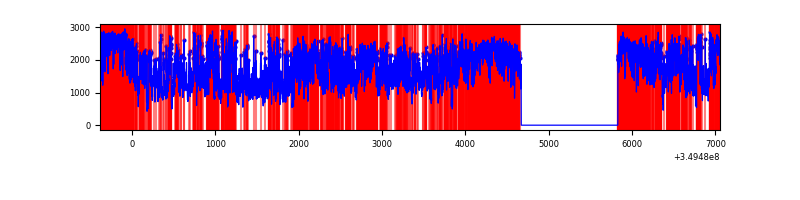 |
Top three noisy pixels from each quadrant. If the there are fewer than three noisy pixels in the level2.evt file, extra rows are filled as -1
| Pixel properties | Quadrant properties | ||||||
|---|---|---|---|---|---|---|---|
| Quadrant | DetID | PixID | Counts | Sigma | Mean | Median | Sigma |
| A | 7 | 192 | 19801 | 123.57 | 780 | 765 | 154.0 |
| A | 5 | 98 | 17171 | 106.5 | 780 | 765 | 154.0 |
| A | 13 | 254 | 12949 | 79.09 | 780 | 765 | 154.0 |
| B | 10 | 246 | 214074 | 1475.61 | 780 | 762 | 144.6 |
| B | 5 | 172 | 165898 | 1142.35 | 780 | 762 | 144.6 |
| B | 5 | 255 | 70925 | 485.36 | 780 | 762 | 144.6 |
| C | 14 | 238 | 129538 | 734.99 | 754 | 760 | 175.2 |
| C | 3 | 233 | 18722 | 102.52 | 754 | 760 | 175.2 |
| C | 0 | 207 | 18070 | 98.79 | 754 | 760 | 175.2 |
| D | 8 | 195 | 4634190 | 29844.2 | 658 | 640 | 155.3 |
| D | 1 | 52 | 1894590 | 12198.73 | 658 | 640 | 155.3 |
| D | 13 | 104 | 1890682 | 12173.56 | 658 | 640 | 155.3 |
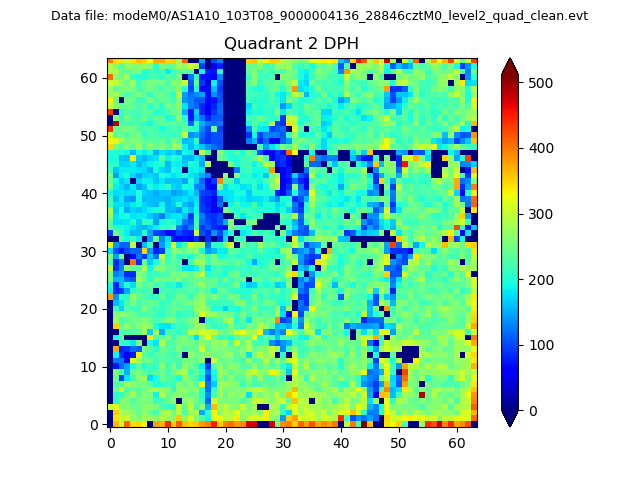
Histogram calculated using DETX and DETY for each event in the final _common_clean file
| Quadrant A | 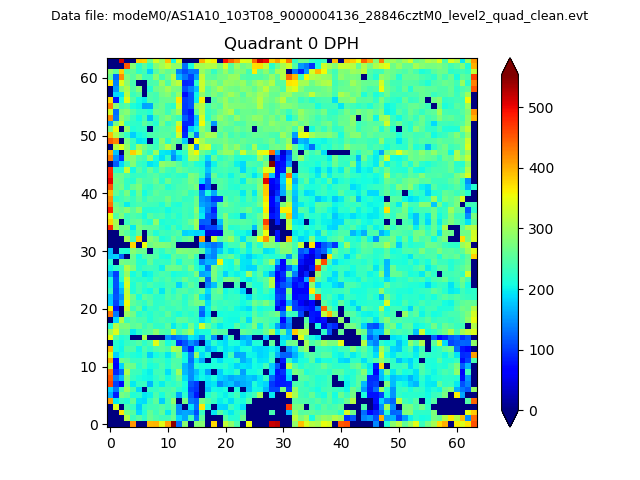 |
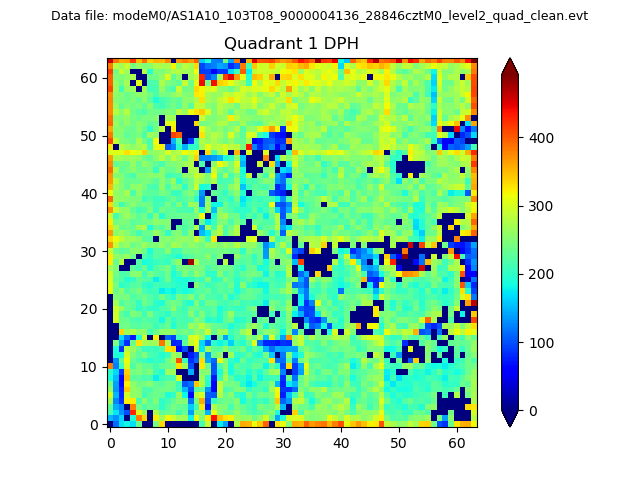 |
Quadrant B |
|---|---|---|---|
| Quadrant D | 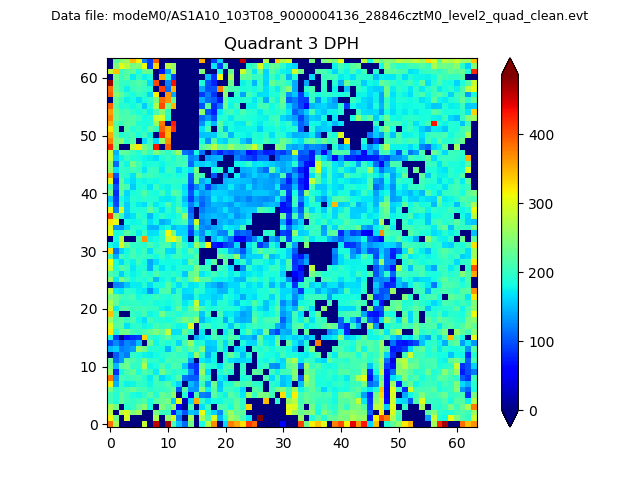 |
 |
Quadrant C |
| Plot type | Count rate plots | Images |
|---|---|---|
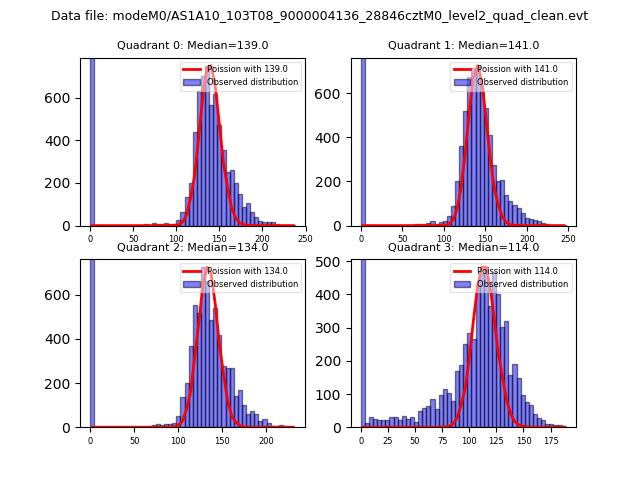
| Comparison with Poisson distribution Blue bars denote a histogram of data divided into 1 sec bins. Red curve is a Poisson curve with rate = median count rate of data. |
 |
 |
| Quadrant-wise count rates Data is divided into 100 sec bins |
 |
|
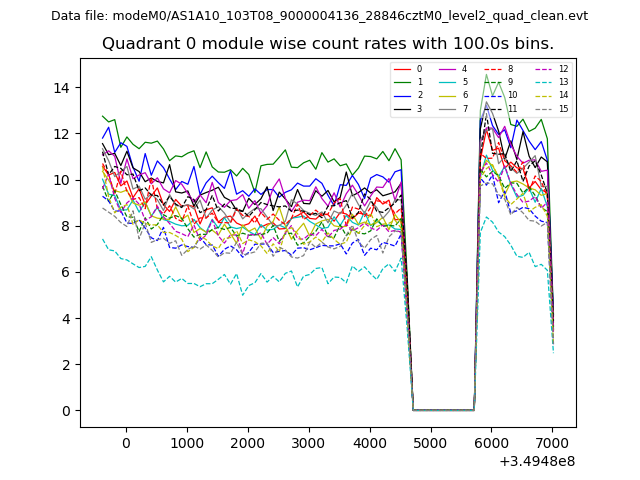
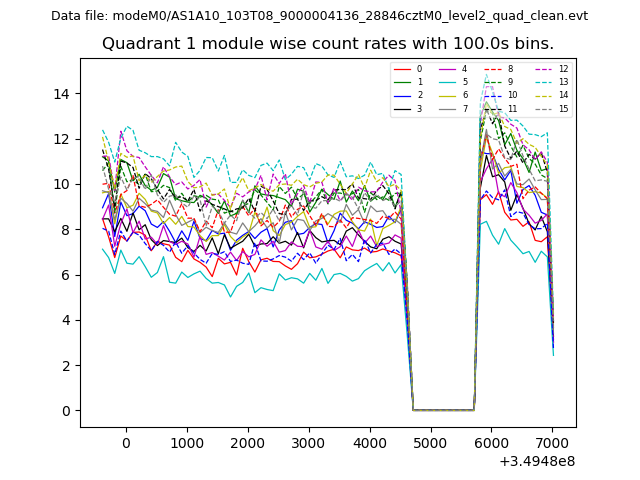
| Module-wise count rates for Quadrant A Data is divided into 100 sec bins |
 |
 |
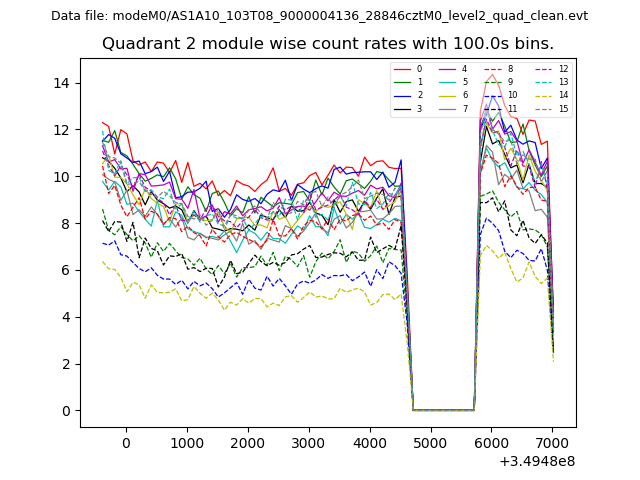
| Module-wise count rates for Quadrant B Data is divided into 100 sec bins |
 |
 |
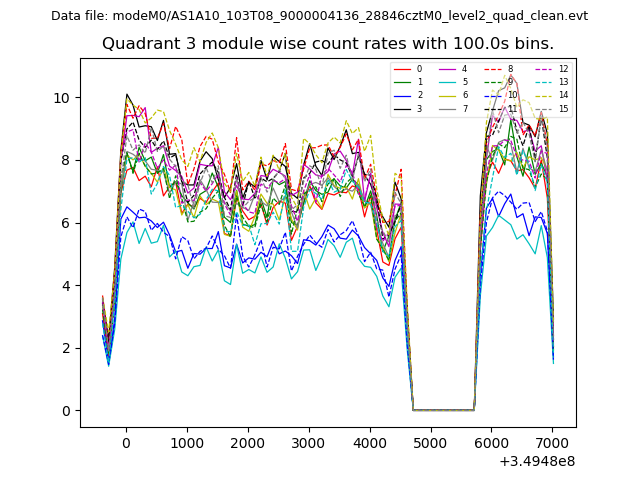
| Module-wise count rates for Quadrant C Data is divided into 100 sec bins |
 |
 |
| Module-wise count rates for Quadrant D Data is divided into 100 sec bins |
 |
 |
| Parameter | Plot |
|---|---|
| CZT HV Monitor | 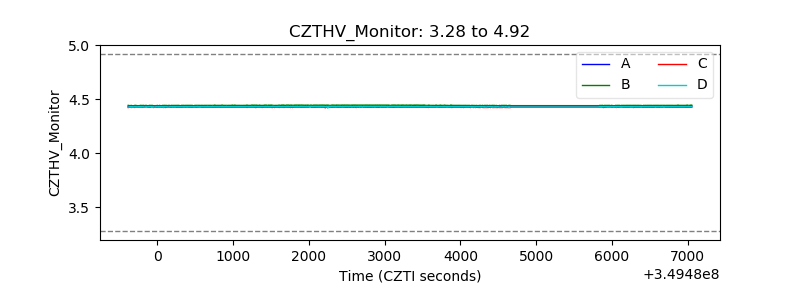 |
| D_VDD | 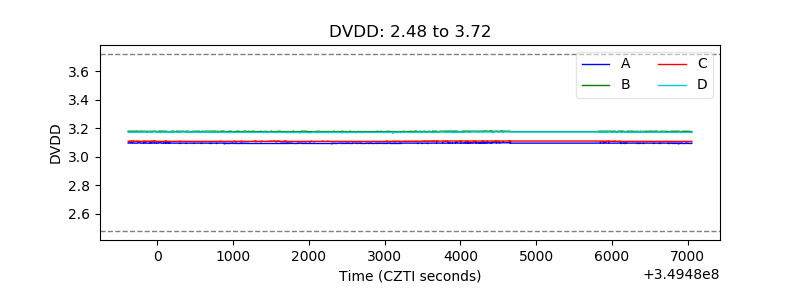 |
| Temperature 1 | 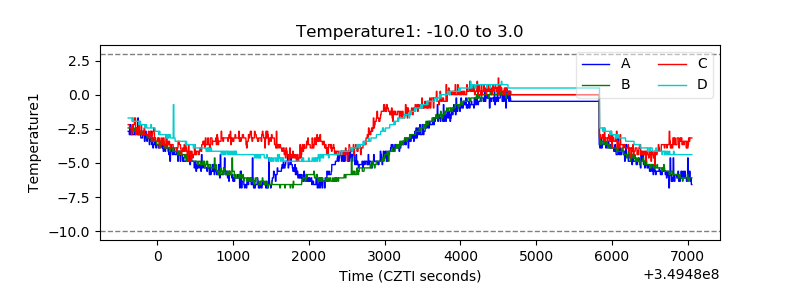 |
| Veto HV Monitor | 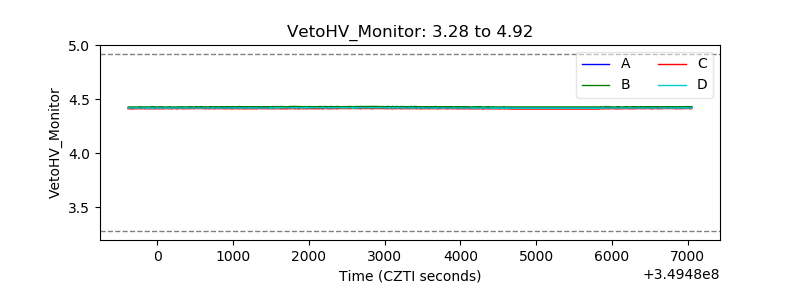 |
| Veto LLD | 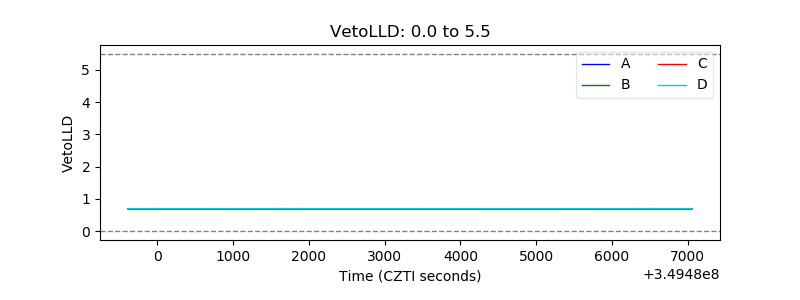 |
| Alpha Counter | 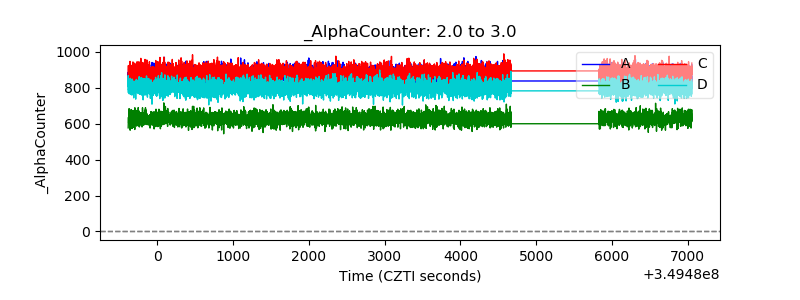 |
| _CPM_Rate | 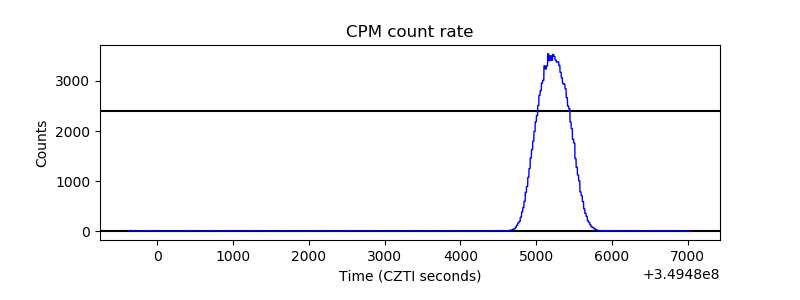 |
| CZT Counter | 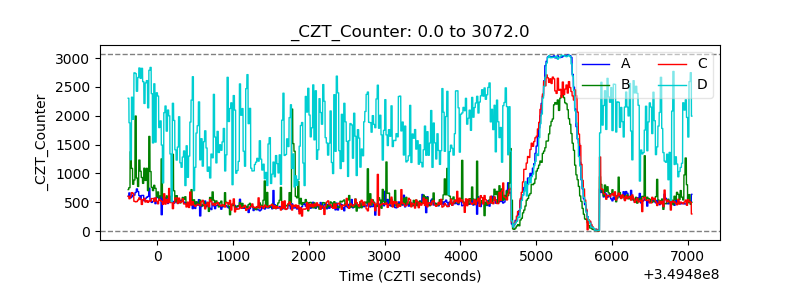 |
| +2.5 Volts monitor |  |
| +5 Volts monitor | 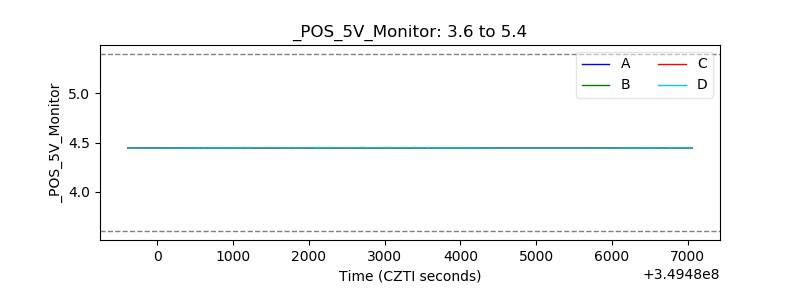 |
| _ROLL_ROT | 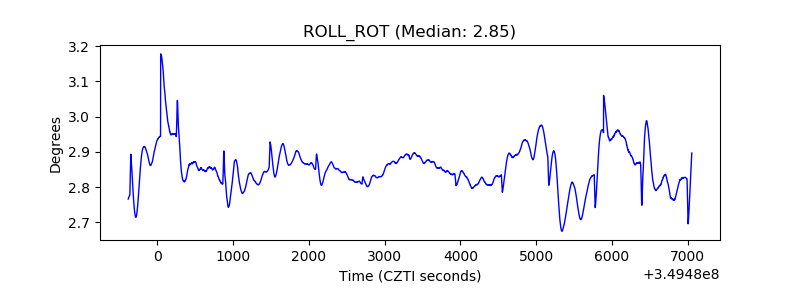 |
| _Roll_DEC | 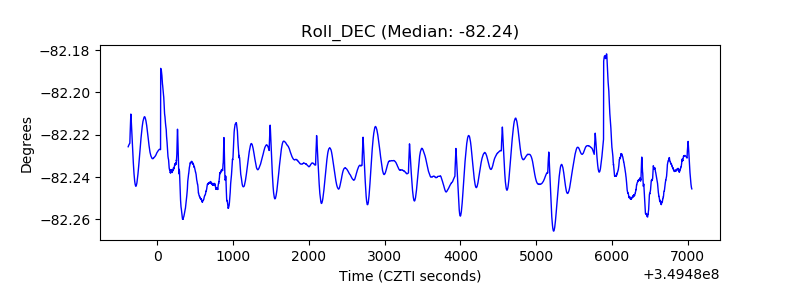 |
| _Roll_RA | 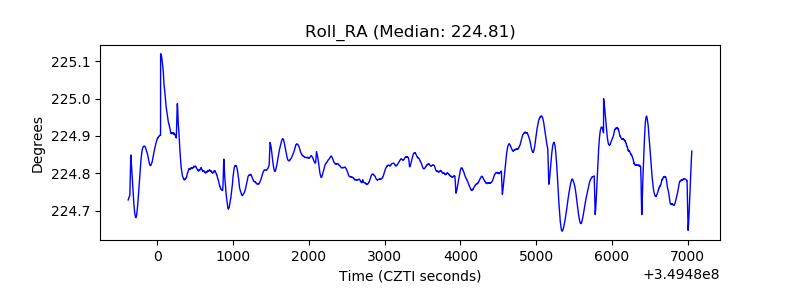 |
| Veto Counter | 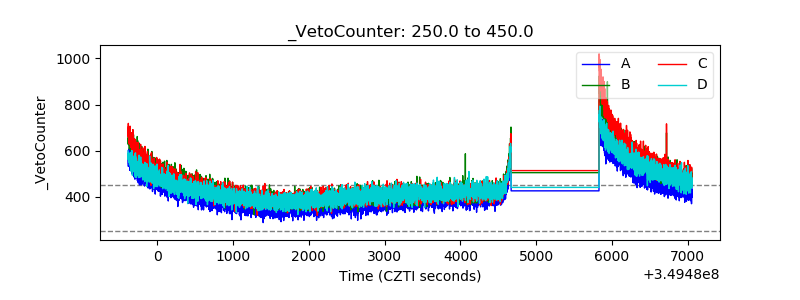 |