| Param | Original file | Final file |
|---|---|---|
| Filename | modeM0/AS1A10_103T08_9000004136_28847cztM0_level2.evt | modeM0/AS1A10_103T08_9000004136_28847cztM0_level2_quad_clean.evt |
| Size (bytes) | 742,901,760 | 137,744,640 |
| Size | 708.5 MB | 131.4 MB |
| Events in quadrant A | 3,304,895 | 989,096 |
| Events in quadrant B | 3,832,474 | 1,012,073 |
| Events in quadrant C | 3,416,682 | 969,361 |
| Events in quadrant D | 11,502,612 | 743,834 |
| Mode SS | |||
|---|---|---|---|
| Quadrant | BADHDUFLAG | Total packets | Discarded packets |
| A | 0 | 134 | 0 |
| B | 0 | 134 | 0 |
| C | 0 | 134 | 0 |
| D | 0 | 134 | 0 |
| Mode M9 | |||
|---|---|---|---|
| Quadrant | BADHDUFLAG | Total packets | Discarded packets |
| A | 0 | 14 | 0 |
| B | 0 | 15 | 0 |
| C | 0 | 15 | 0 |
| D | 0 | 15 | 0 |
| Mode M0 | |||
|---|---|---|---|
| Quadrant | BADHDUFLAG | Total packets | Discarded packets |
| A | 0 | 13860 | 2 |
| B | 0 | 15581 | 2 |
| C | 0 | 14068 | 2 |
| D | 0 | 38734 | 2 |
| Quadrant | Total seconds | Saturated seconds | Saturation percentage |
|---|---|---|---|
| A | 6542 | 8 | 0.122287% |
| B | 6542 | 135 | 2.063589% |
| C | 6542 | 74 | 1.131153% |
| D | 6542 | 2765 | 42.265362% |
Noise dominated data is calculated using 1-second bins in cleaned event files. If a bin has >2000 counts, and if more than 50% of those come from <1% of pixels, then it is considered to be noise-dominated and hence unusable.
| Quadrant | # 1 sec bins | Bins with >0 counts | Bins with >2000 counts | High rate bins dominated by noise | Noise dominated (total time) | Noise dominated (detector-on time) | Marked lightcurve |
|---|---|---|---|---|---|---|---|
| A | 7792 | 6543 | 0 | 0 | 0.00% | 0.00% |  |
| B | 7792 | 6542 | 73 | 73 | 0.94% | 1.12% | 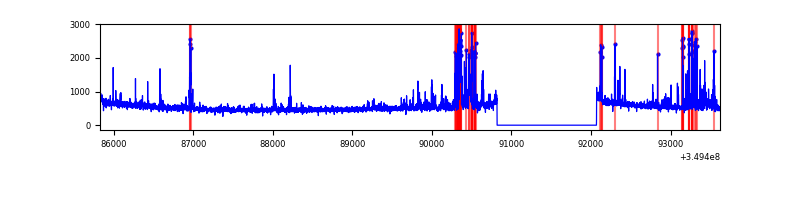 |
| C | 7792 | 6542 | 0 | 0 | 0.00% | 0.00% | 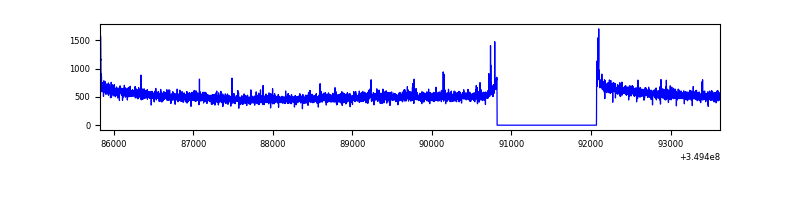 |
| D | 7792 | 6542 | 2682 | 2682 | 34.42% | 41.00% | 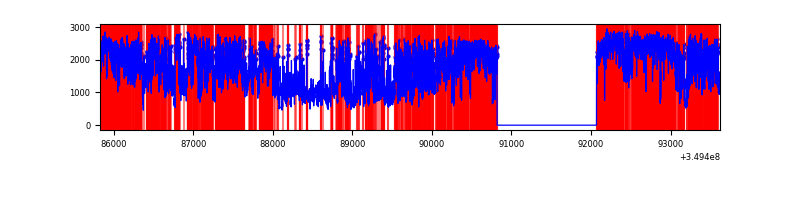 |
Top three noisy pixels from each quadrant. If the there are fewer than three noisy pixels in the level2.evt file, extra rows are filled as -1
| Pixel properties | Quadrant properties | ||||||
|---|---|---|---|---|---|---|---|
| Quadrant | DetID | PixID | Counts | Sigma | Mean | Median | Sigma |
| A | 5 | 98 | 46838 | 275.89 | 842 | 829 | 166.8 |
| A | 13 | 254 | 13177 | 74.04 | 842 | 829 | 166.8 |
| A | 0 | 226 | 7301 | 38.81 | 842 | 829 | 166.8 |
| B | 5 | 255 | 241769 | 1557.86 | 848 | 828 | 154.7 |
| B | 5 | 172 | 183102 | 1178.53 | 848 | 828 | 154.7 |
| B | 10 | 246 | 42492 | 269.39 | 848 | 828 | 154.7 |
| C | 14 | 238 | 139790 | 733.66 | 825 | 833 | 189.4 |
| C | 3 | 233 | 35573 | 183.42 | 825 | 833 | 189.4 |
| C | 14 | 254 | 6139 | 28.01 | 825 | 833 | 189.4 |
| D | 8 | 195 | 5116110 | 31012.33 | 703 | 686 | 164.9 |
| D | 1 | 52 | 3442747 | 20867.54 | 703 | 686 | 164.9 |
| D | 13 | 104 | 134977 | 814.14 | 703 | 686 | 164.9 |
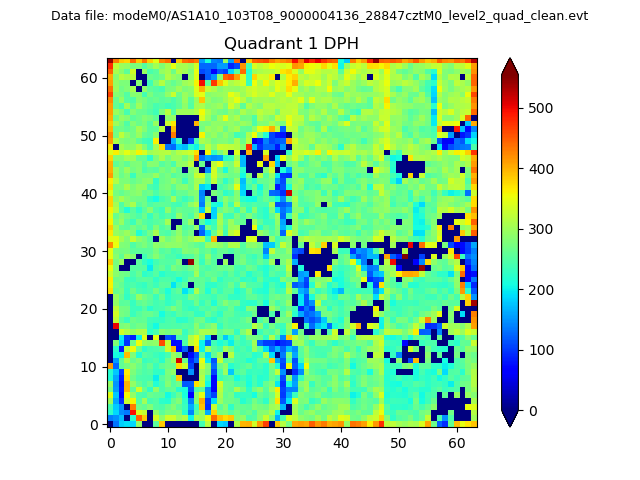
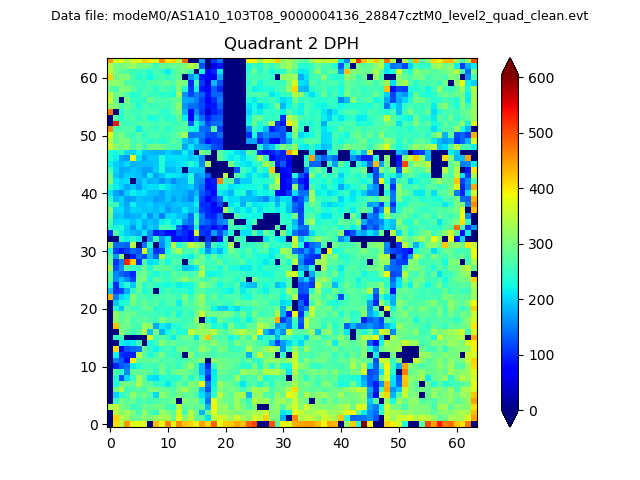
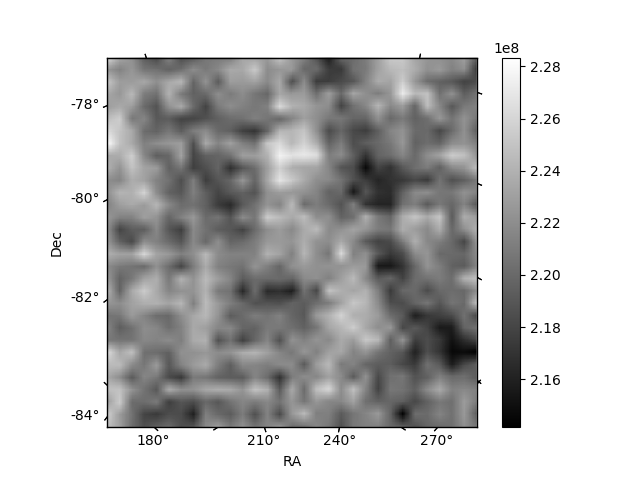
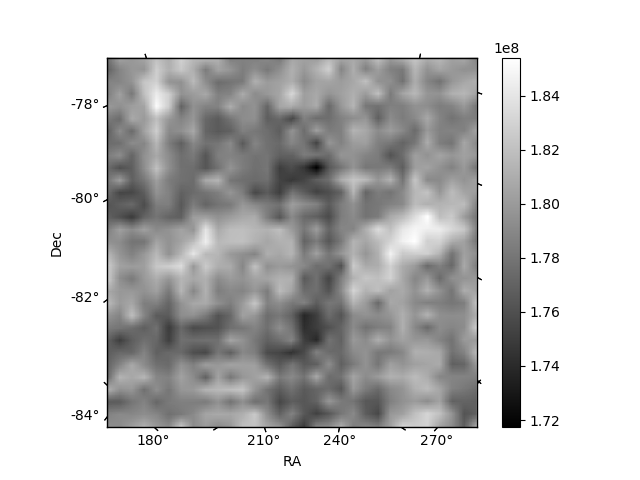
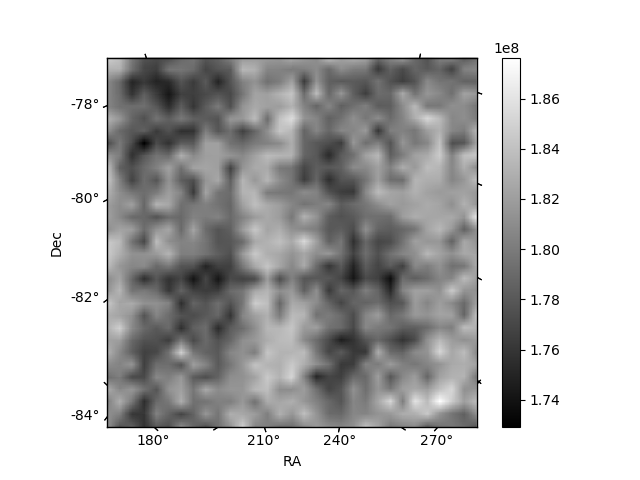
Histogram calculated using DETX and DETY for each event in the final _common_clean file
| Quadrant A |  |
 |
Quadrant B |
|---|---|---|---|
| Quadrant D | 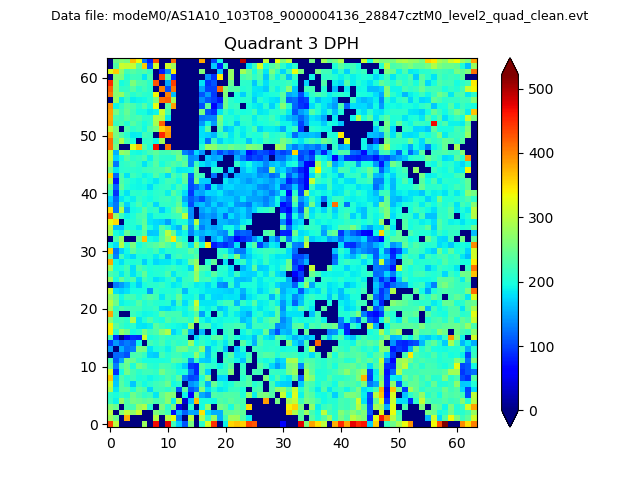 |
 |
Quadrant C |
| Plot type | Count rate plots | Images |
|---|---|---|
| Comparison with Poisson distribution Blue bars denote a histogram of data divided into 1 sec bins. Red curve is a Poisson curve with rate = median count rate of data. |
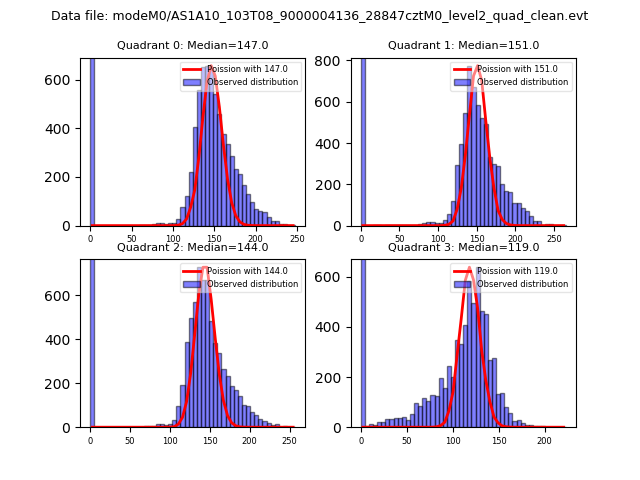 |
 |
| Quadrant-wise count rates Data is divided into 100 sec bins |
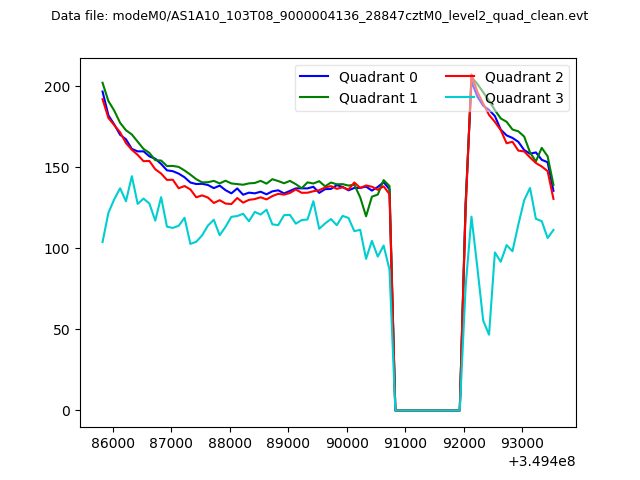 |
|
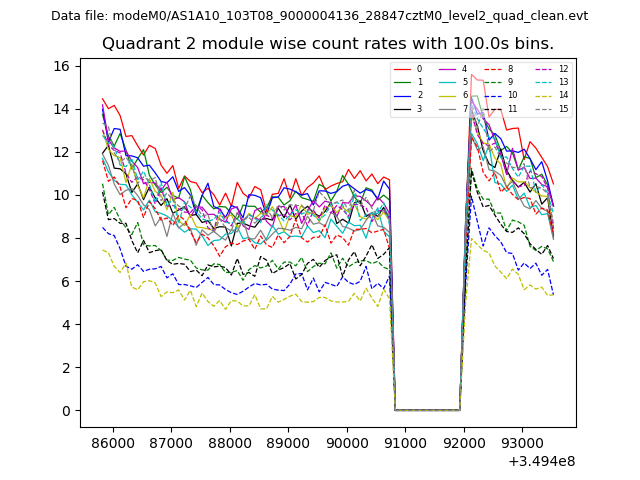
| Module-wise count rates for Quadrant A Data is divided into 100 sec bins |
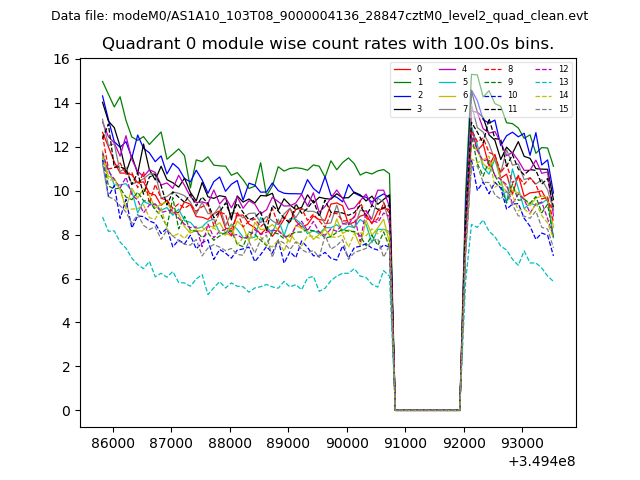 |
 |
| Module-wise count rates for Quadrant B Data is divided into 100 sec bins |
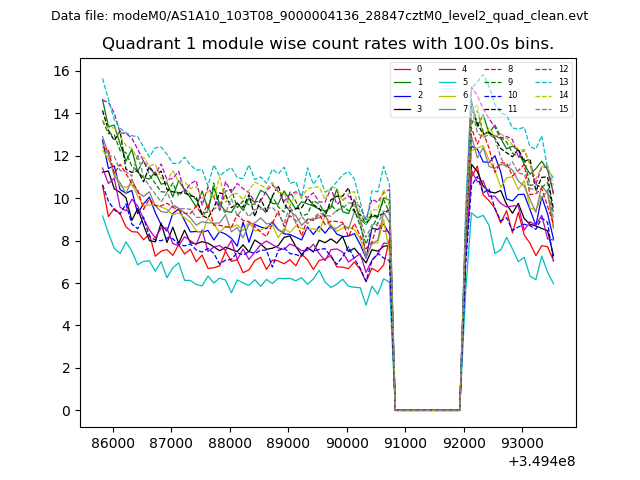 |
 |
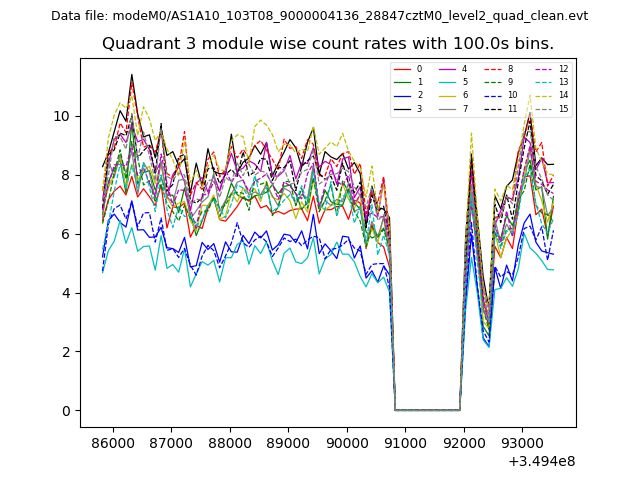
| Module-wise count rates for Quadrant C Data is divided into 100 sec bins |
 |
 |
| Module-wise count rates for Quadrant D Data is divided into 100 sec bins |
 |
 |
| Parameter | Plot |
|---|---|
| CZT HV Monitor | 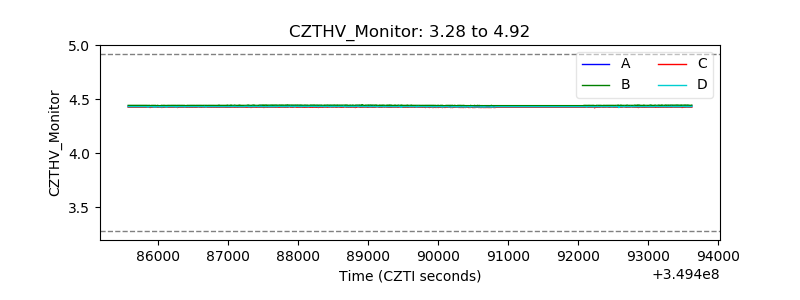 |
| D_VDD | 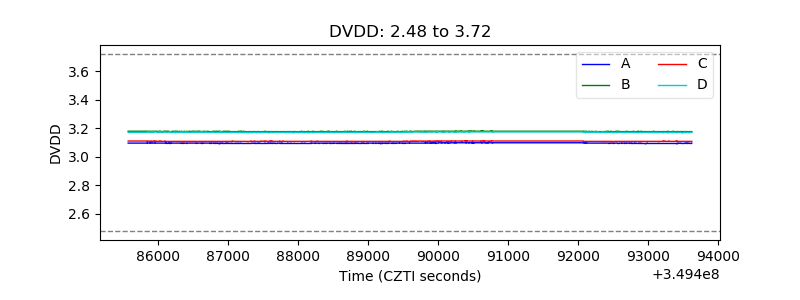 |
| Temperature 1 | 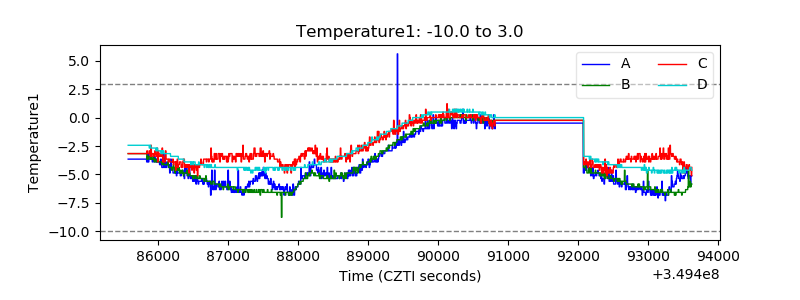 |
| Veto HV Monitor | 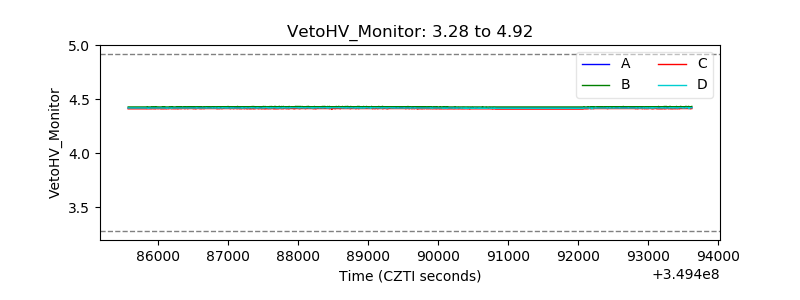 |
| Veto LLD | 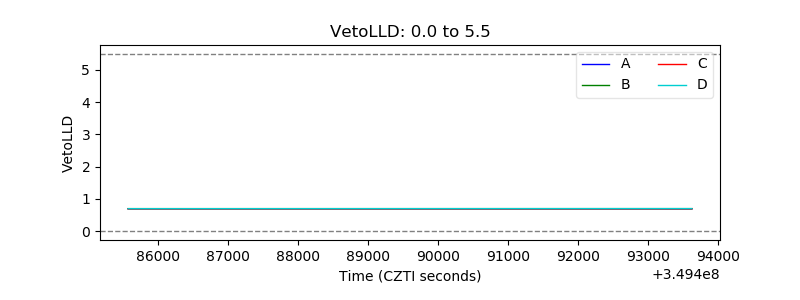 |
| Alpha Counter | 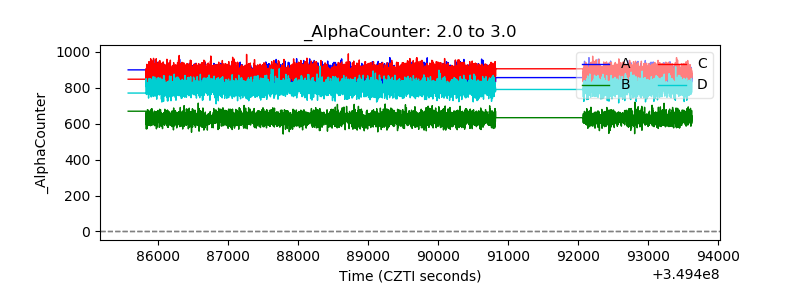 |
| _CPM_Rate | 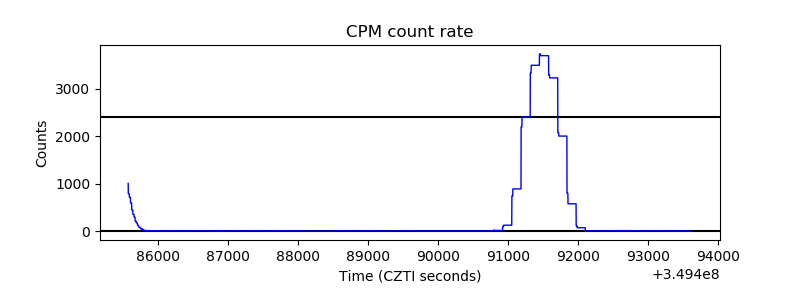 |
| CZT Counter | 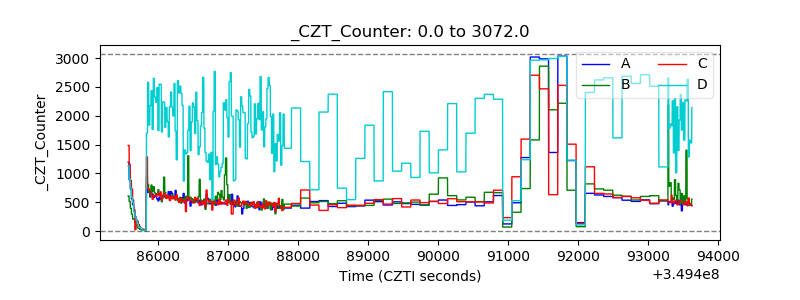 |
| +2.5 Volts monitor | 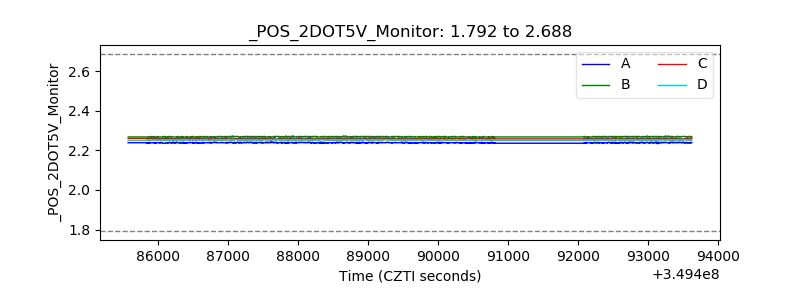 |
| +5 Volts monitor |  |
| _ROLL_ROT | 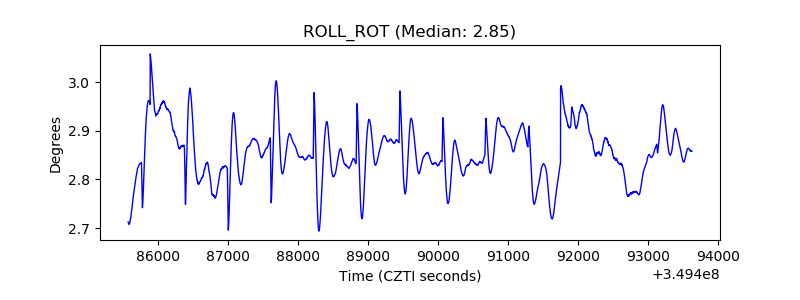 |
| _Roll_DEC | 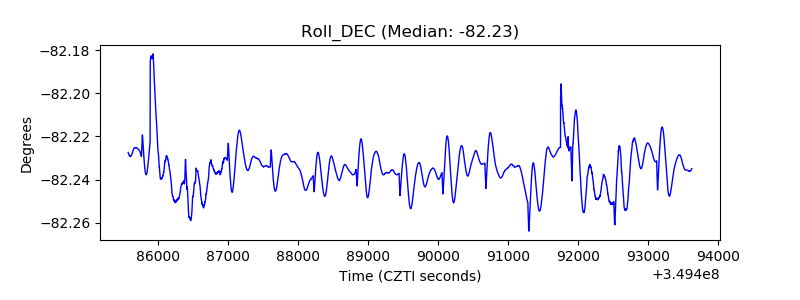 |
| _Roll_RA | 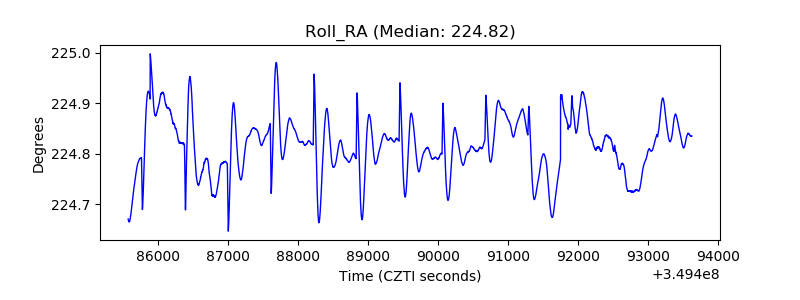 |
| Veto Counter | 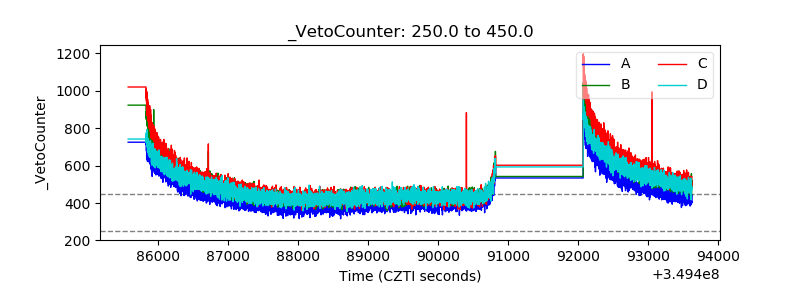 |