| Param | Original file | Final file |
|---|---|---|
| Filename | modeM0/AS1A10_103T08_9000004136_28848cztM0_level2.evt | modeM0/AS1A10_103T08_9000004136_28848cztM0_level2_quad_clean.evt |
| Size (bytes) | 702,031,680 | 125,939,520 |
| Size | 669.5 MB | 120.1 MB |
| Events in quadrant A | 3,010,582 | 909,506 |
| Events in quadrant B | 3,652,282 | 930,904 |
| Events in quadrant C | 3,154,778 | 897,854 |
| Events in quadrant D | 11,043,451 | 661,780 |
| Mode SS | |||
|---|---|---|---|
| Quadrant | BADHDUFLAG | Total packets | Discarded packets |
| A | 0 | 120 | 0 |
| B | 0 | 120 | 0 |
| C | 0 | 120 | 0 |
| D | 0 | 120 | 0 |
| Mode M9 | |||
|---|---|---|---|
| Quadrant | BADHDUFLAG | Total packets | Discarded packets |
| A | 0 | 13 | 0 |
| B | 0 | 13 | 0 |
| C | 0 | 13 | 0 |
| D | 0 | 13 | 0 |
| Mode M0 | |||
|---|---|---|---|
| Quadrant | BADHDUFLAG | Total packets | Discarded packets |
| A | 0 | 12430 | 1 |
| B | 0 | 14561 | 1 |
| C | 0 | 12811 | 1 |
| D | 0 | 36846 | 1 |
| Quadrant | Total seconds | Saturated seconds | Saturation percentage |
|---|---|---|---|
| A | 5912 | 17 | 0.287551% |
| B | 5913 | 138 | 2.333841% |
| C | 5913 | 96 | 1.623541% |
| D | 5913 | 3189 | 53.932014% |
Noise dominated data is calculated using 1-second bins in cleaned event files. If a bin has >2000 counts, and if more than 50% of those come from <1% of pixels, then it is considered to be noise-dominated and hence unusable.
| Quadrant | # 1 sec bins | Bins with >0 counts | Bins with >2000 counts | High rate bins dominated by noise | Noise dominated (total time) | Noise dominated (detector-on time) | Marked lightcurve |
|---|---|---|---|---|---|---|---|
| A | 7227 | 5912 | 0 | 0 | 0.00% | 0.00% | 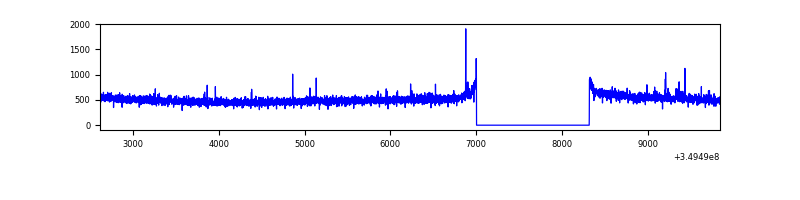 |
| B | 7228 | 5913 | 68 | 68 | 0.94% | 1.15% | 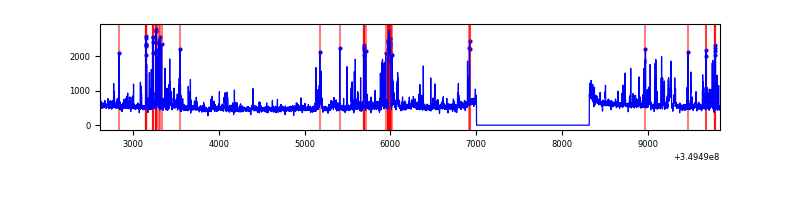 |
| C | 7228 | 5913 | 2 | 2 | 0.03% | 0.03% | 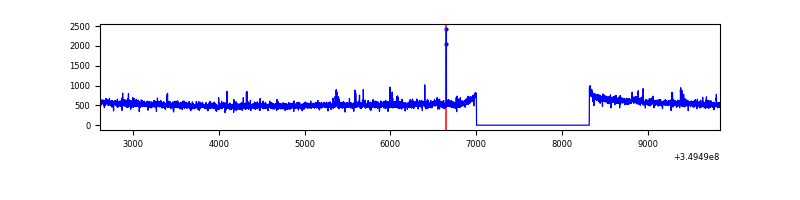 |
| D | 7228 | 5913 | 3209 | 3209 | 44.40% | 54.27% | 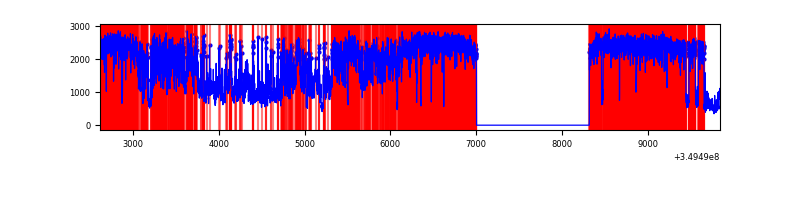 |
Top three noisy pixels from each quadrant. If the there are fewer than three noisy pixels in the level2.evt file, extra rows are filled as -1
| Pixel properties | Quadrant properties | ||||||
|---|---|---|---|---|---|---|---|
| Quadrant | DetID | PixID | Counts | Sigma | Mean | Median | Sigma |
| A | 5 | 98 | 19878 | 125.84 | 770 | 757 | 151.9 |
| A | 13 | 254 | 11649 | 71.69 | 770 | 757 | 151.9 |
| A | 12 | 16 | 7942 | 47.29 | 770 | 757 | 151.9 |
| B | 5 | 255 | 373603 | 2684.28 | 771 | 755 | 138.9 |
| B | 5 | 172 | 100170 | 715.73 | 771 | 755 | 138.9 |
| B | 0 | 156 | 38853 | 274.28 | 771 | 755 | 138.9 |
| C | 14 | 238 | 135329 | 773.01 | 759 | 769 | 174.1 |
| C | 3 | 233 | 25950 | 144.66 | 759 | 769 | 174.1 |
| C | 14 | 254 | 18687 | 102.93 | 759 | 769 | 174.1 |
| D | 8 | 195 | 6817473 | 46557.87 | 625 | 609 | 146.4 |
| D | 1 | 52 | 1787693 | 12205.44 | 625 | 609 | 146.4 |
| D | 2 | 250 | 45109 | 303.93 | 625 | 609 | 146.4 |
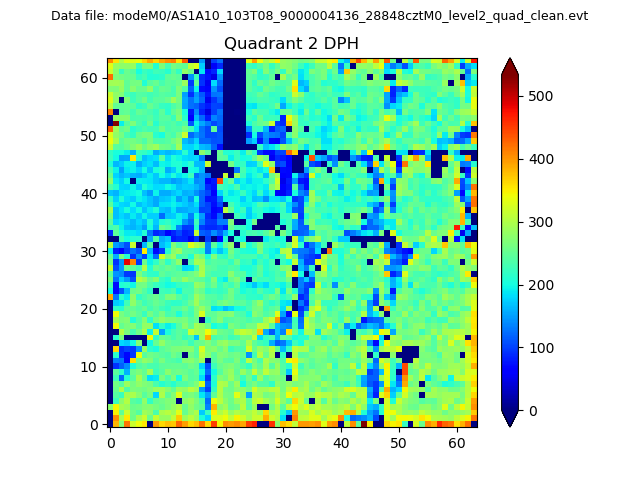
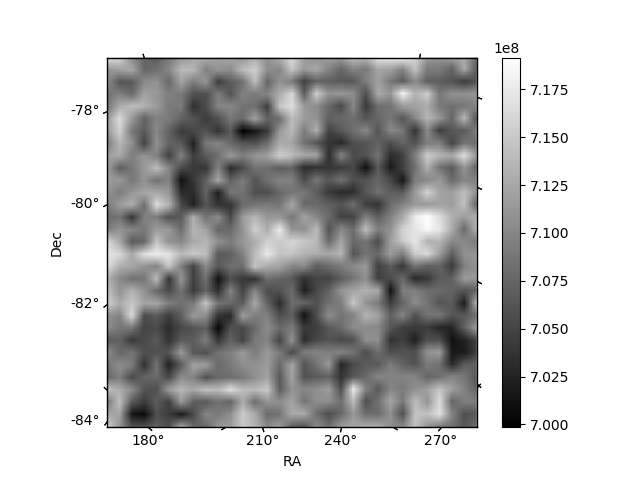
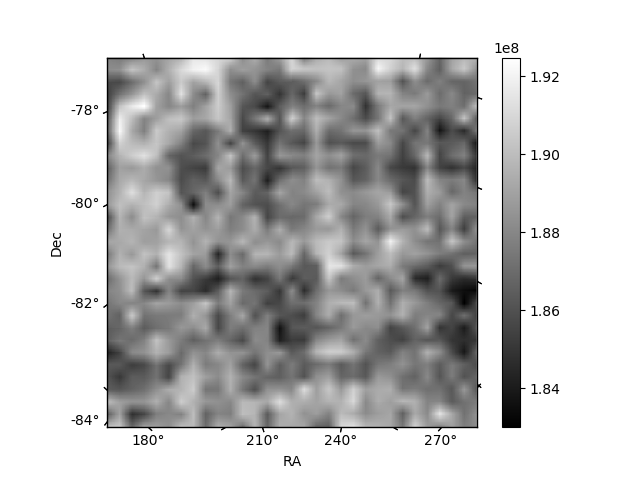
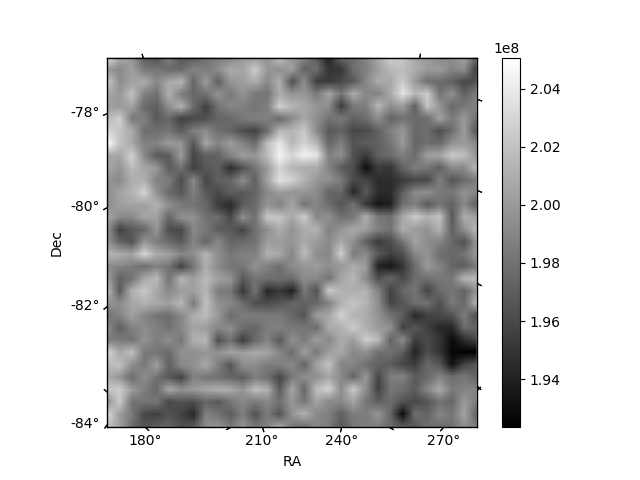
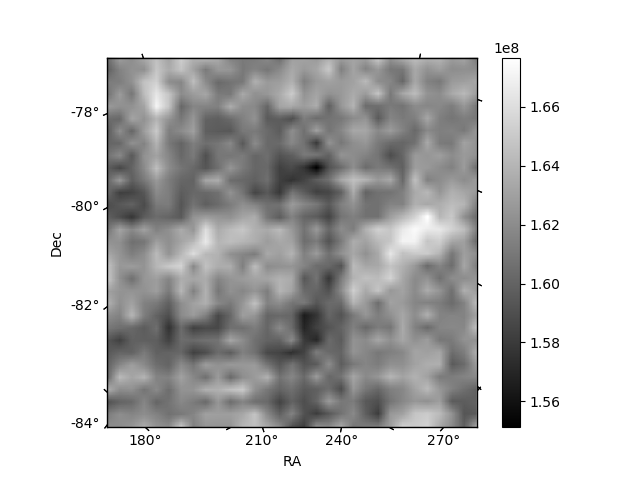
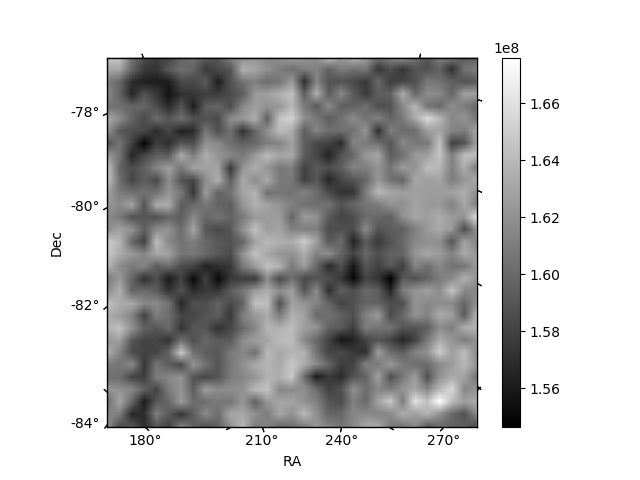
Histogram calculated using DETX and DETY for each event in the final _common_clean file
| Quadrant A | 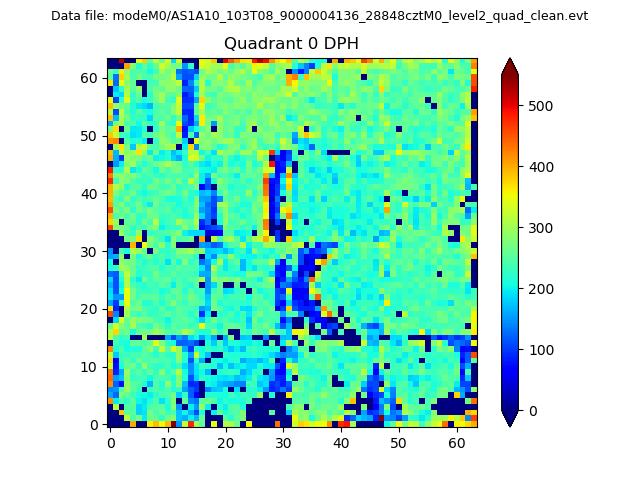 |
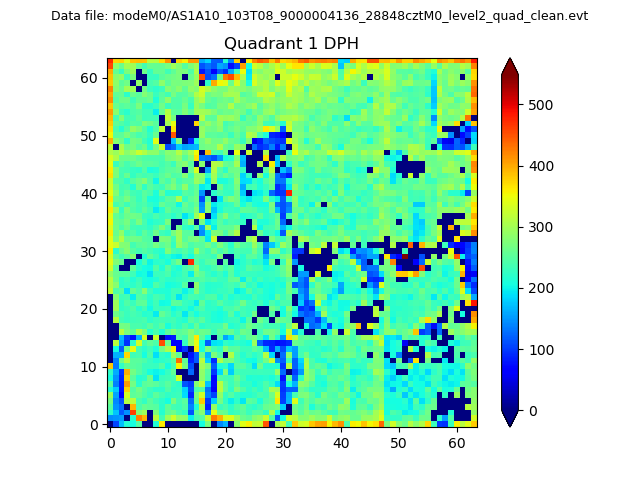 |
Quadrant B |
|---|---|---|---|
| Quadrant D | 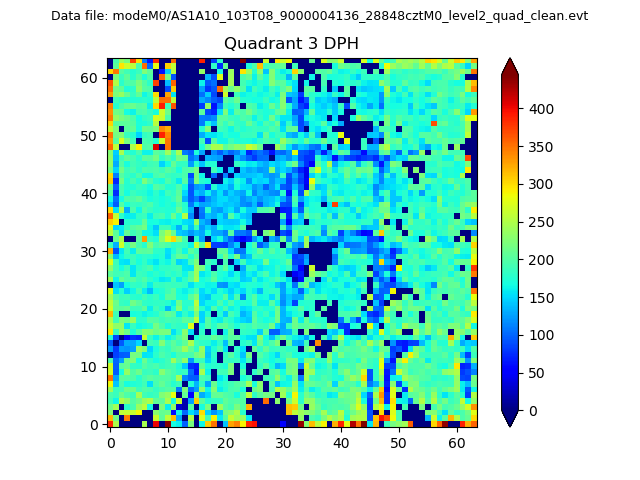 |
 |
Quadrant C |
| Plot type | Count rate plots | Images |
|---|---|---|
| Comparison with Poisson distribution Blue bars denote a histogram of data divided into 1 sec bins. Red curve is a Poisson curve with rate = median count rate of data. |
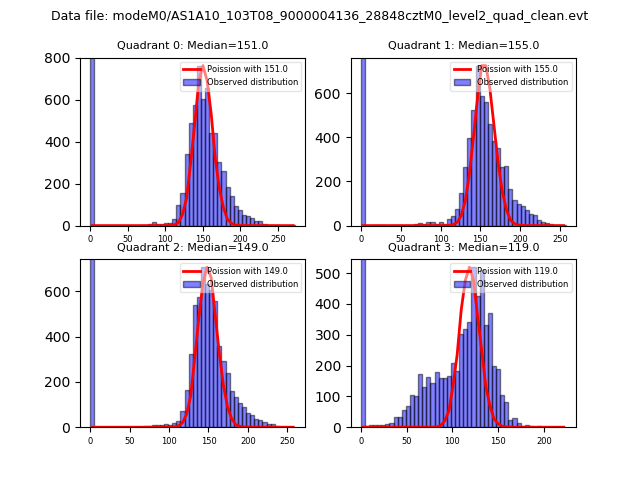 |
 |
| Quadrant-wise count rates Data is divided into 100 sec bins |
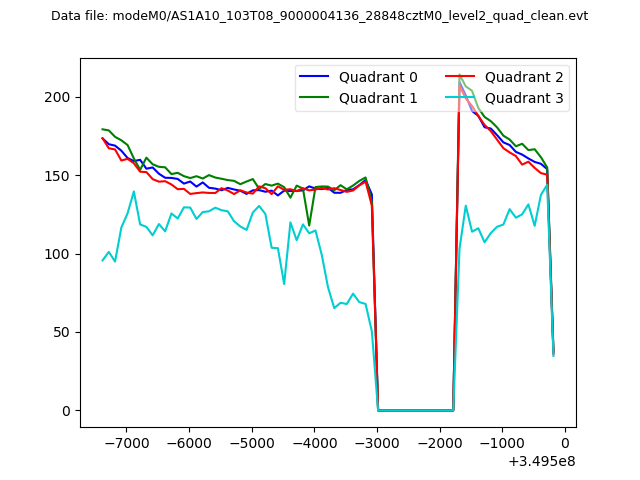 |
|
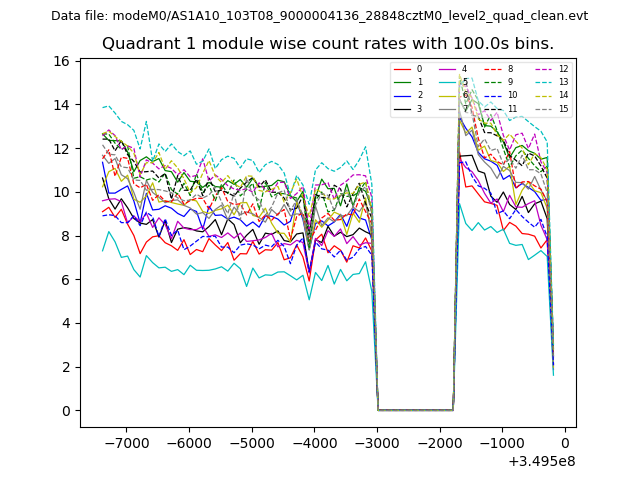
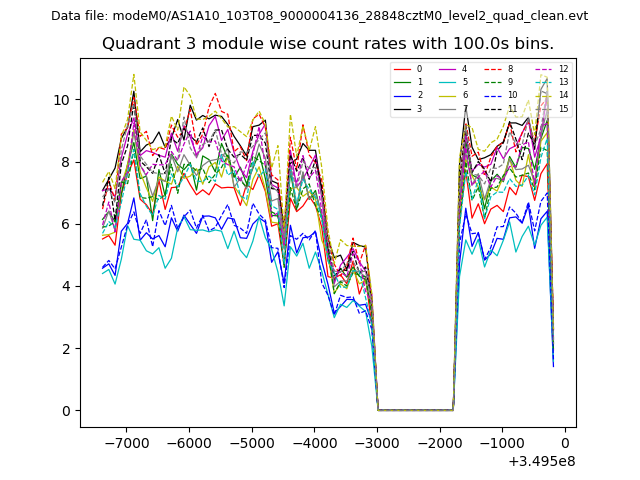
| Module-wise count rates for Quadrant A Data is divided into 100 sec bins |
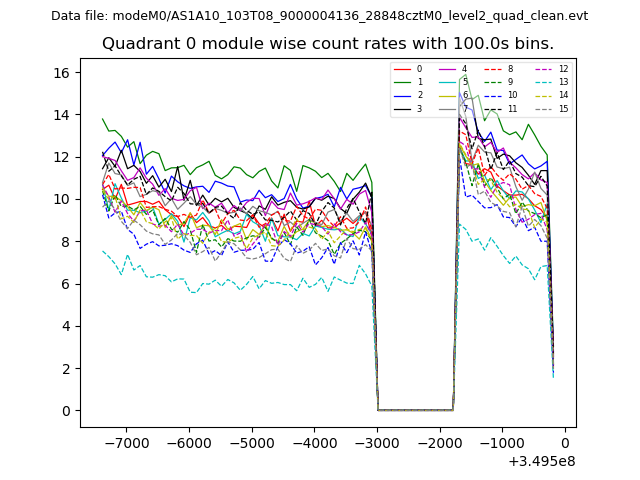 |
 |
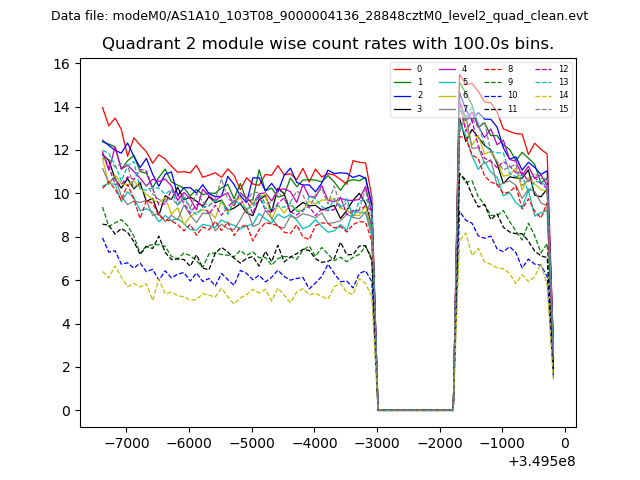
| Module-wise count rates for Quadrant B Data is divided into 100 sec bins |
 |
 |
| Module-wise count rates for Quadrant C Data is divided into 100 sec bins |
 |
 |
| Module-wise count rates for Quadrant D Data is divided into 100 sec bins |
 |
 |
| Parameter | Plot |
|---|---|
| CZT HV Monitor | 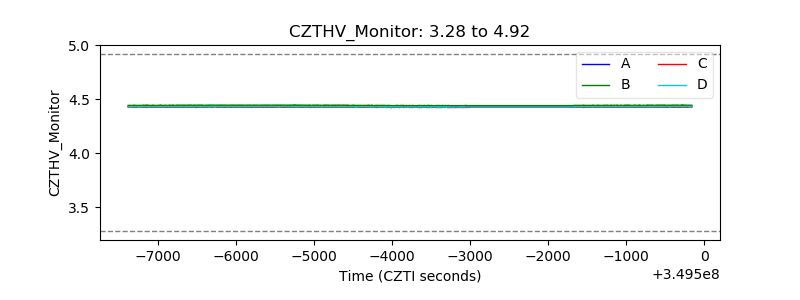 |
| D_VDD | 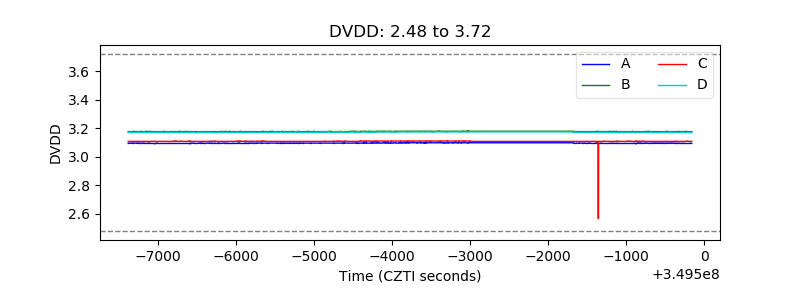 |
| Temperature 1 | 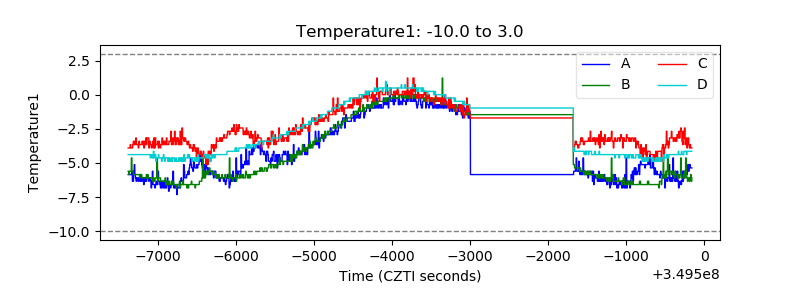 |
| Veto HV Monitor | 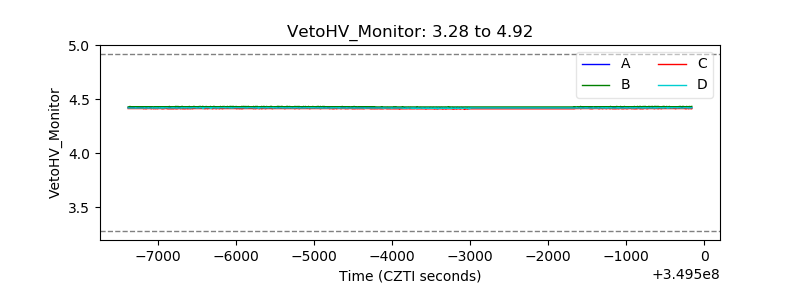 |
| Veto LLD | 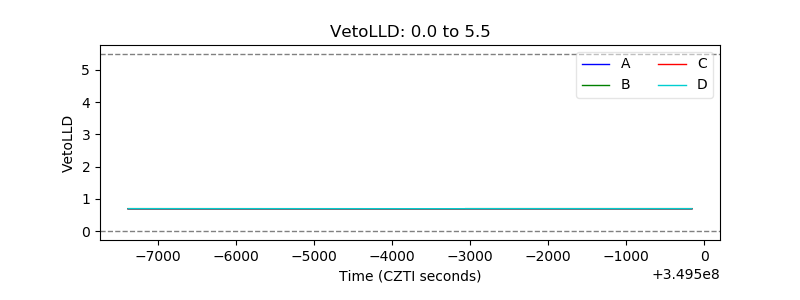 |
| Alpha Counter | 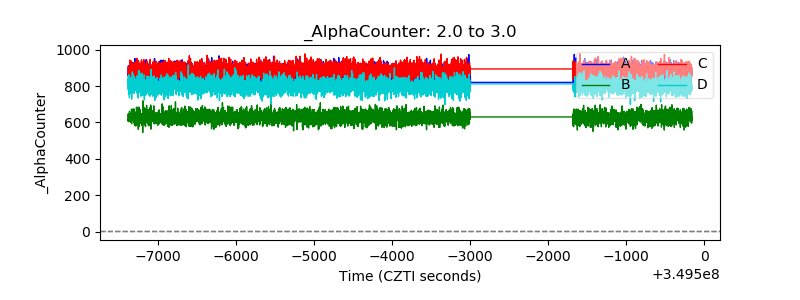 |
| _CPM_Rate | 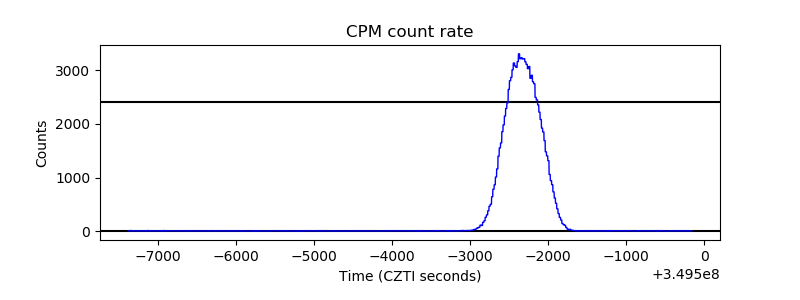 |
| CZT Counter | 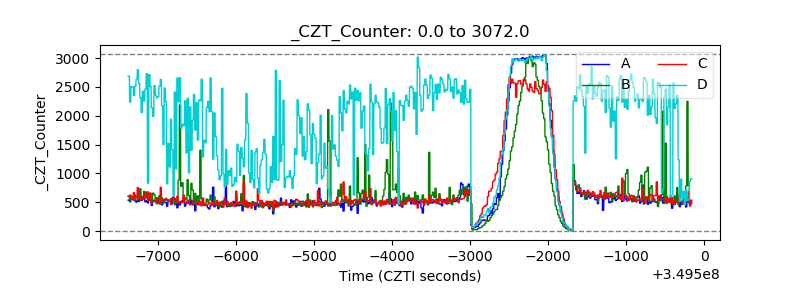 |
| +2.5 Volts monitor | 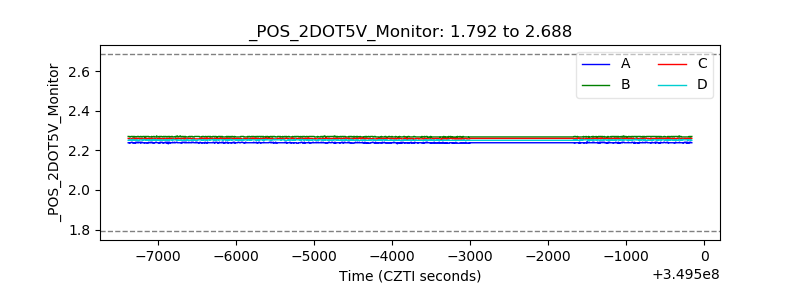 |
| +5 Volts monitor | 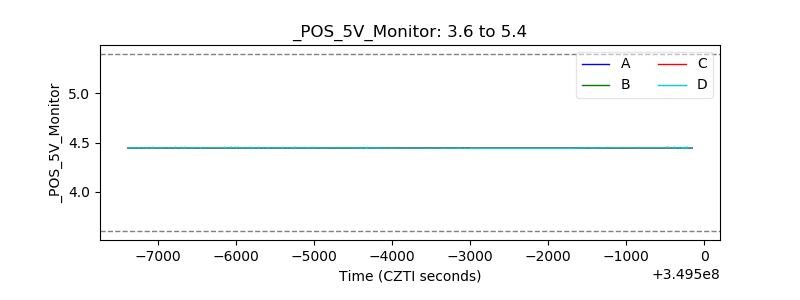 |
| _ROLL_ROT | 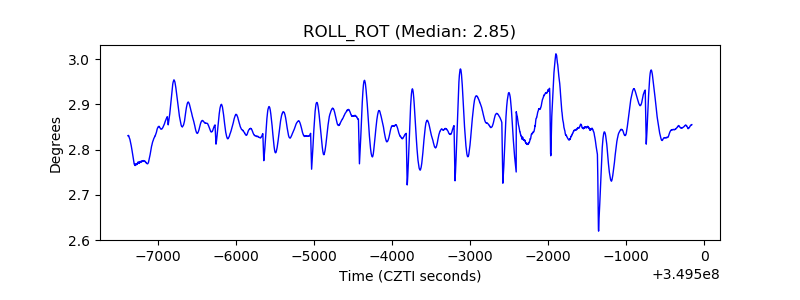 |
| _Roll_DEC | 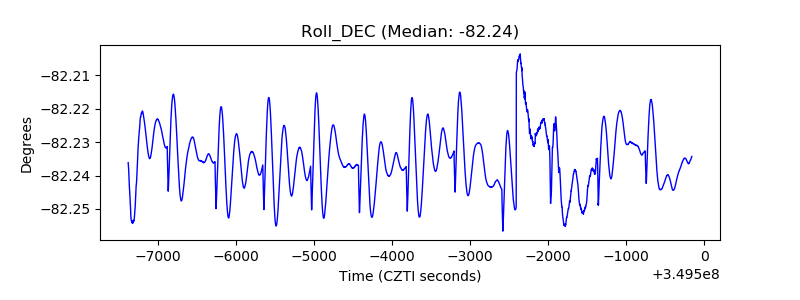 |
| _Roll_RA | 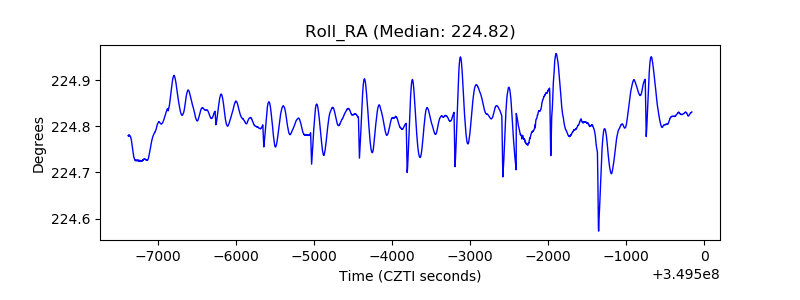 |
| Veto Counter | 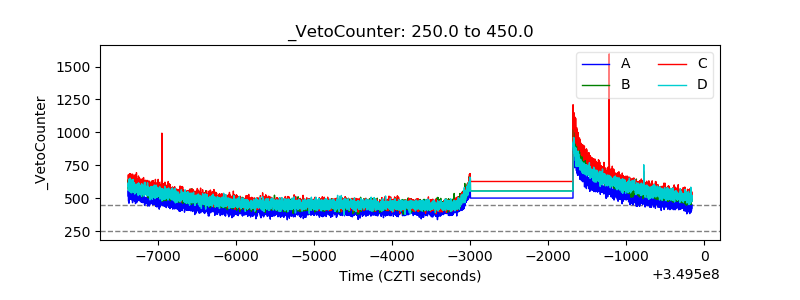 |