| Param | Original file | Final file |
|---|---|---|
| Filename | modeM0/AS1A10_103T08_9000004136_28849cztM0_level2.evt | modeM0/AS1A10_103T08_9000004136_28849cztM0_level2_quad_clean.evt |
| Size (bytes) | 816,540,480 | 135,527,040 |
| Size | 778.7 MB | 129.2 MB |
| Events in quadrant A | 3,320,639 | 988,981 |
| Events in quadrant B | 4,290,767 | 1,002,985 |
| Events in quadrant C | 3,518,333 | 980,137 |
| Events in quadrant D | 13,170,560 | 688,406 |
| Mode SS | |||
|---|---|---|---|
| Quadrant | BADHDUFLAG | Total packets | Discarded packets |
| A | 0 | 128 | 0 |
| B | 0 | 128 | 0 |
| C | 0 | 128 | 0 |
| D | 0 | 128 | 0 |
| Mode M9 | |||
|---|---|---|---|
| Quadrant | BADHDUFLAG | Total packets | Discarded packets |
| A | 0 | 15 | 0 |
| B | 0 | 16 | 0 |
| C | 0 | 16 | 0 |
| D | 0 | 16 | 0 |
| Mode M0 | |||
|---|---|---|---|
| Quadrant | BADHDUFLAG | Total packets | Discarded packets |
| A | 0 | 13603 | 2 |
| B | 0 | 16763 | 2 |
| C | 0 | 14247 | 2 |
| D | 0 | 43384 | 2 |
| Quadrant | Total seconds | Saturated seconds | Saturation percentage |
|---|---|---|---|
| A | 6341 | 8 | 0.126163% |
| B | 6341 | 265 | 4.179152% |
| C | 6341 | 102 | 1.608579% |
| D | 6341 | 4773 | 75.272039% |
Noise dominated data is calculated using 1-second bins in cleaned event files. If a bin has >2000 counts, and if more than 50% of those come from <1% of pixels, then it is considered to be noise-dominated and hence unusable.
| Quadrant | # 1 sec bins | Bins with >0 counts | Bins with >2000 counts | High rate bins dominated by noise | Noise dominated (total time) | Noise dominated (detector-on time) | Marked lightcurve |
|---|---|---|---|---|---|---|---|
| A | 7711 | 6342 | 0 | 0 | 0.00% | 0.00% | 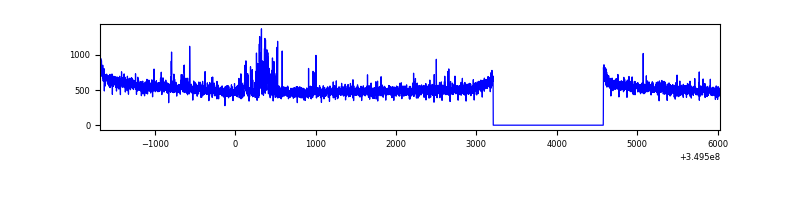 |
| B | 7711 | 6342 | 167 | 167 | 2.17% | 2.63% | 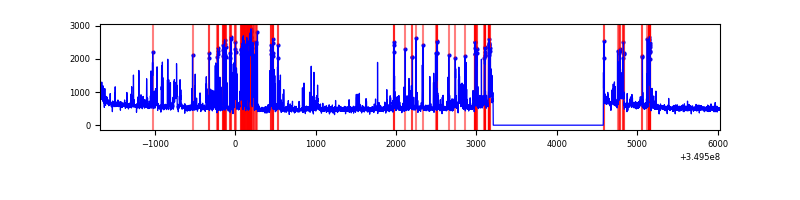 |
| C | 7711 | 6341 | 0 | 0 | 0.00% | 0.00% | 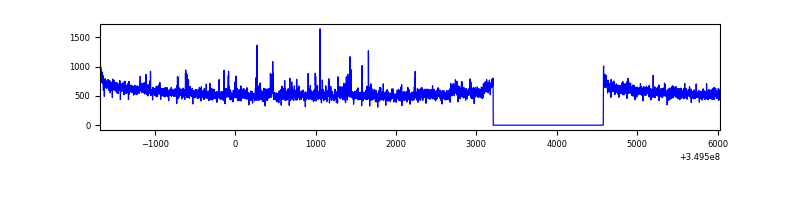 |
| D | 7710 | 6340 | 4907 | 4907 | 63.64% | 77.40% | 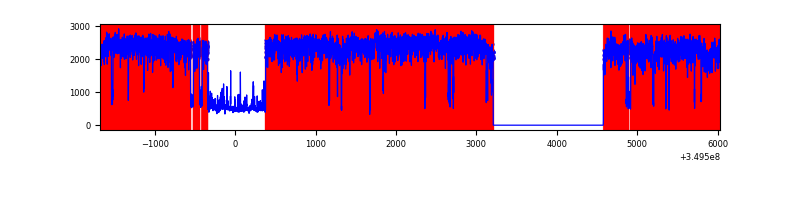 |
Top three noisy pixels from each quadrant. If the there are fewer than three noisy pixels in the level2.evt file, extra rows are filled as -1
| Pixel properties | Quadrant properties | ||||||
|---|---|---|---|---|---|---|---|
| Quadrant | DetID | PixID | Counts | Sigma | Mean | Median | Sigma |
| A | 5 | 98 | 94077 | 567.86 | 835 | 820 | 164.2 |
| A | 13 | 254 | 12247 | 69.58 | 835 | 820 | 164.2 |
| A | 0 | 226 | 7216 | 38.95 | 835 | 820 | 164.2 |
| B | 5 | 255 | 653468 | 4390.09 | 830 | 812 | 148.7 |
| B | 5 | 172 | 202283 | 1355.19 | 830 | 812 | 148.7 |
| B | 10 | 246 | 111989 | 747.83 | 830 | 812 | 148.7 |
| C | 14 | 238 | 148291 | 788.26 | 824 | 830 | 187.1 |
| C | 3 | 233 | 119240 | 632.97 | 824 | 830 | 187.1 |
| C | 14 | 254 | 20845 | 106.99 | 824 | 830 | 187.1 |
| D | 8 | 195 | 9501052 | 62623.62 | 655 | 641 | 151.7 |
| D | 1 | 52 | 1093715 | 7205.19 | 655 | 641 | 151.7 |
| D | 2 | 250 | 36988 | 239.59 | 655 | 641 | 151.7 |
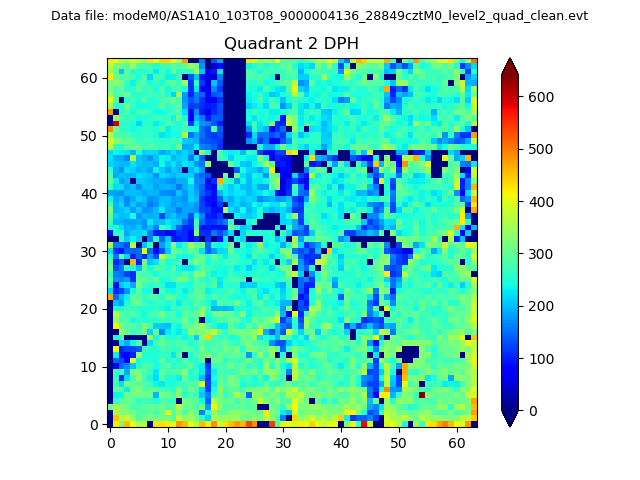
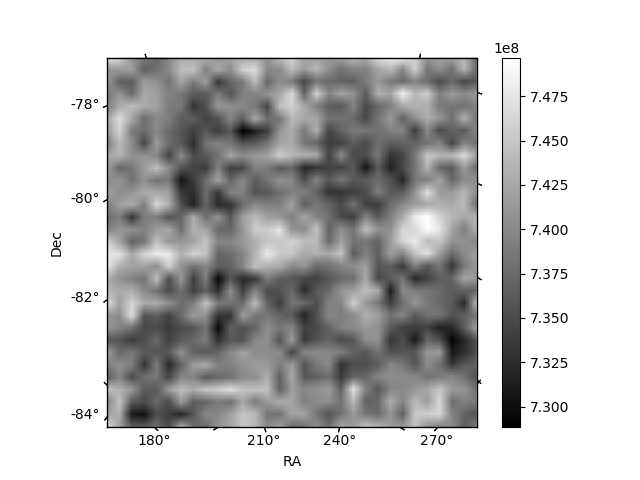
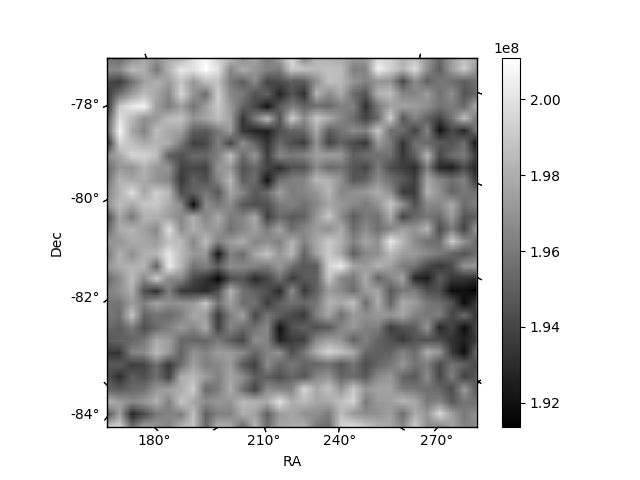
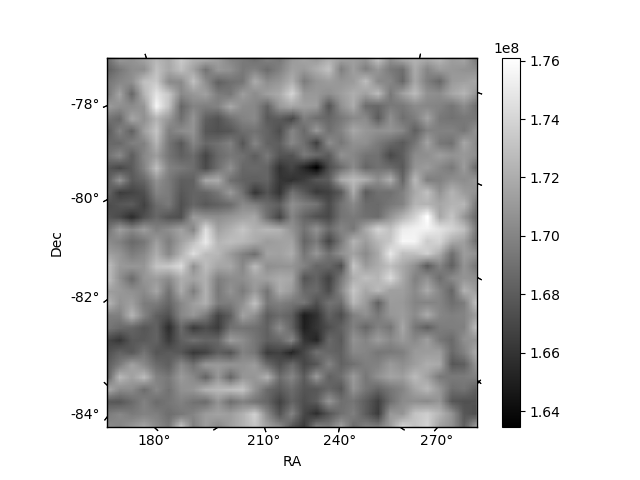
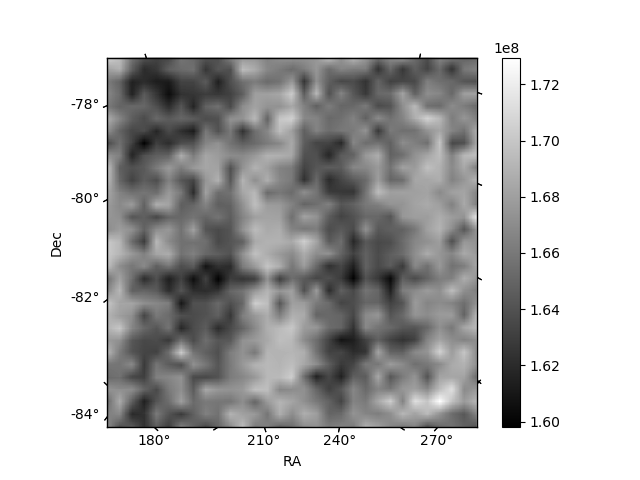
Histogram calculated using DETX and DETY for each event in the final _common_clean file
| Quadrant A | 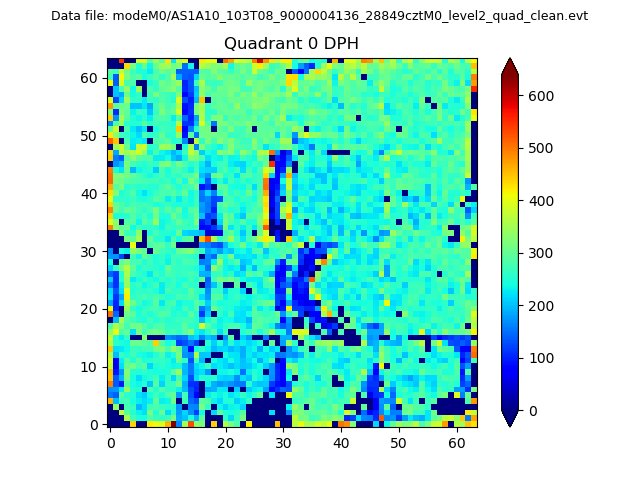 |
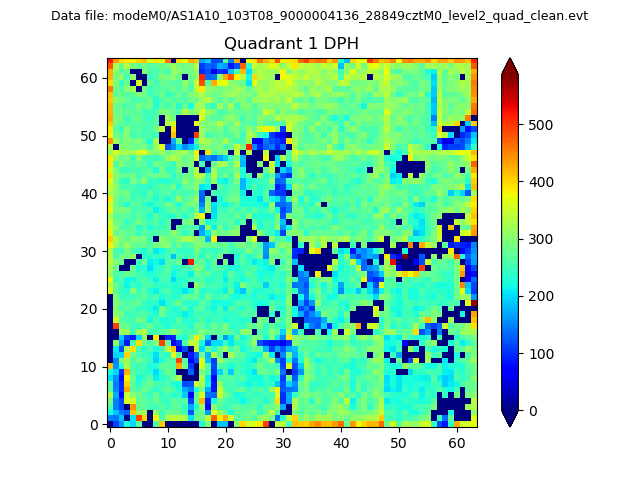 |
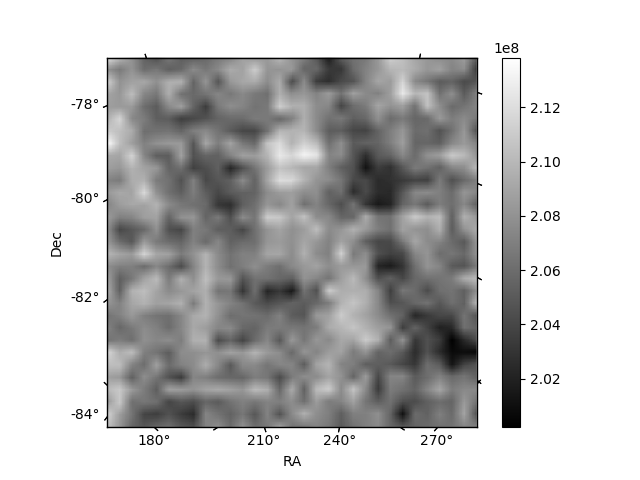
Quadrant B |
|---|---|---|---|
| Quadrant D | 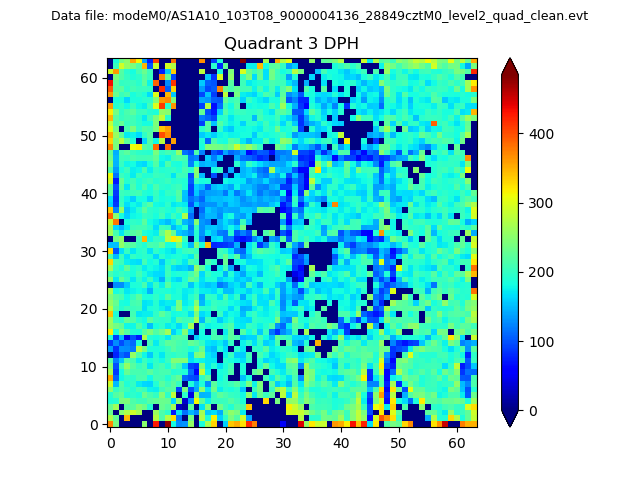 |
 |
Quadrant C |
| Plot type | Count rate plots | Images |
|---|---|---|
| Comparison with Poisson distribution Blue bars denote a histogram of data divided into 1 sec bins. Red curve is a Poisson curve with rate = median count rate of data. |
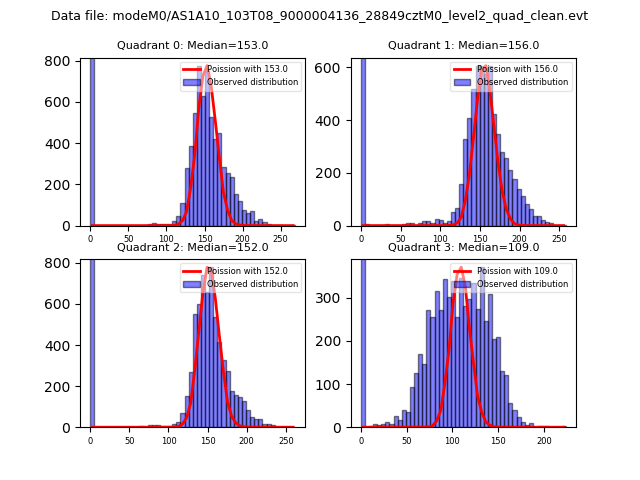 |
 |
| Quadrant-wise count rates Data is divided into 100 sec bins |
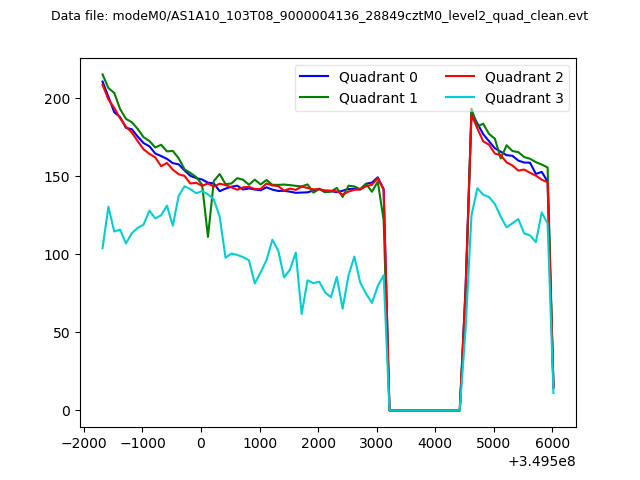 |
|
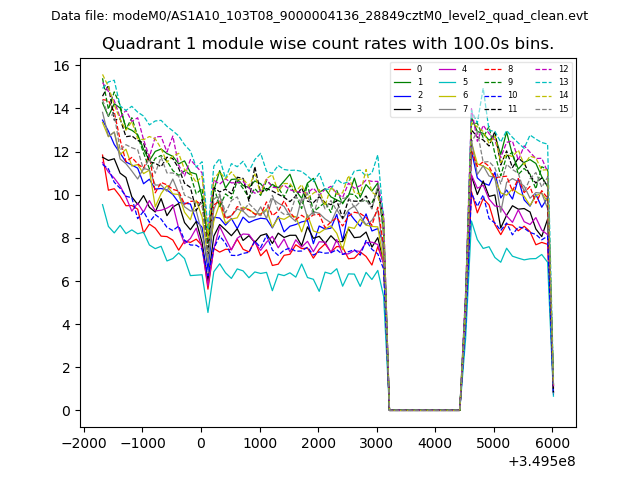
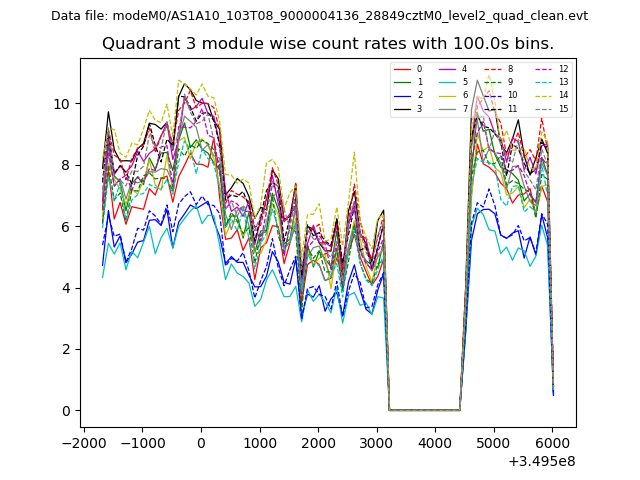
| Module-wise count rates for Quadrant A Data is divided into 100 sec bins |
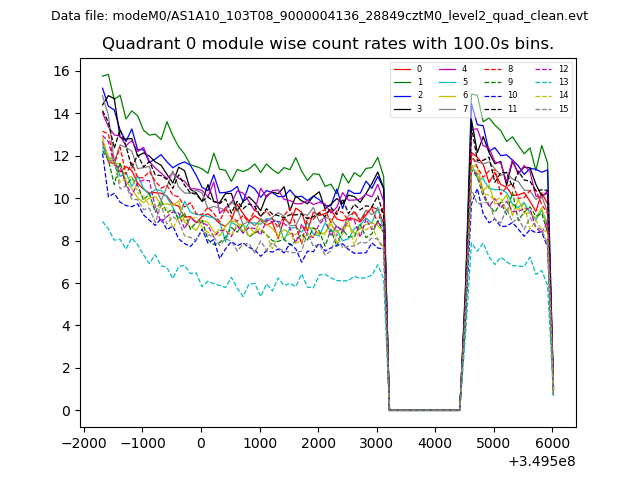 |
 |
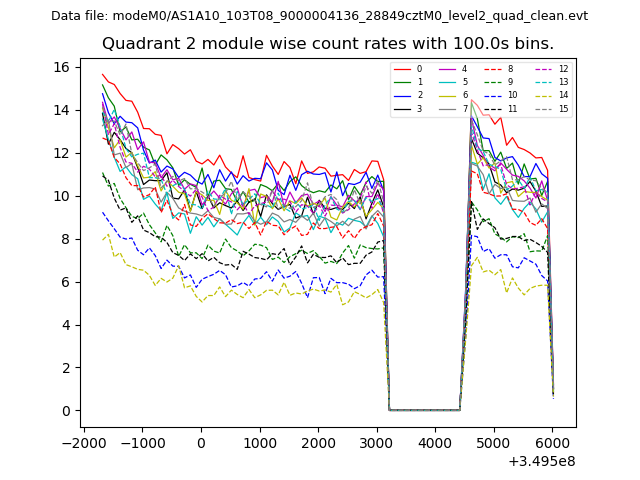
| Module-wise count rates for Quadrant B Data is divided into 100 sec bins |
 |
 |
| Module-wise count rates for Quadrant C Data is divided into 100 sec bins |
 |
 |
| Module-wise count rates for Quadrant D Data is divided into 100 sec bins |
 |
 |
| Parameter | Plot |
|---|---|
| CZT HV Monitor | 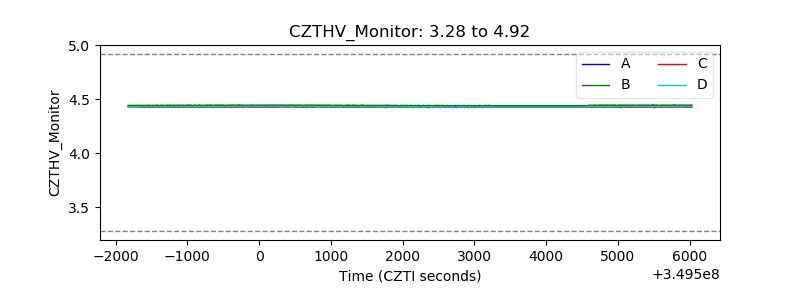 |
| D_VDD | 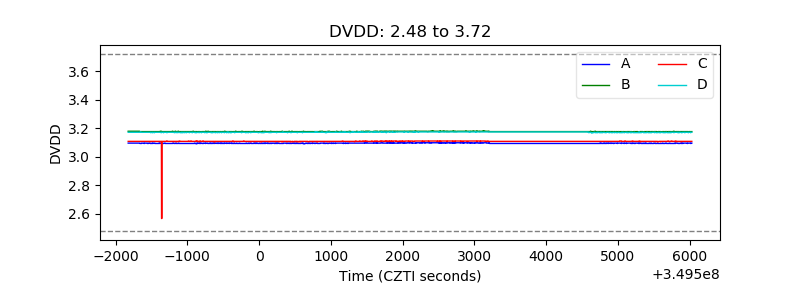 |
| Temperature 1 | 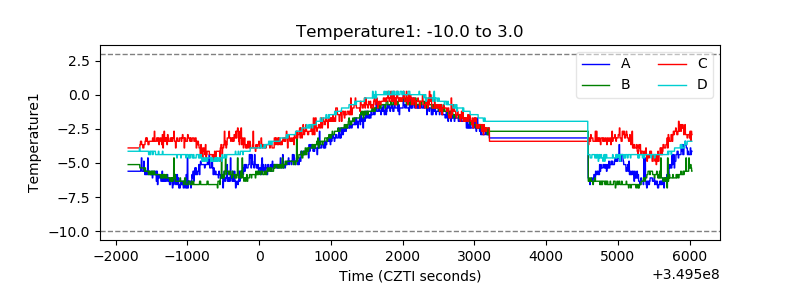 |
| Veto HV Monitor | 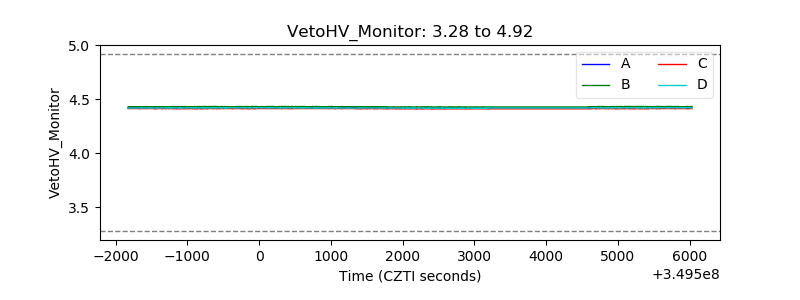 |
| Veto LLD | 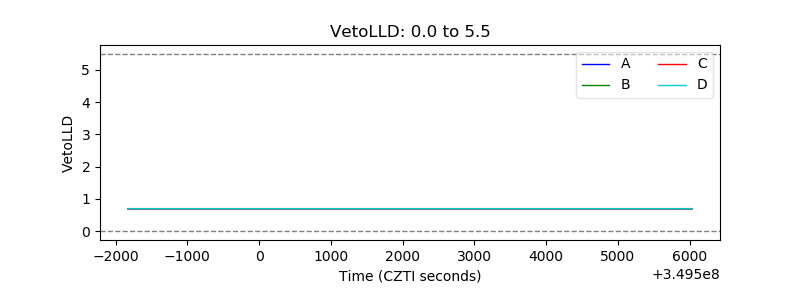 |
| Alpha Counter | 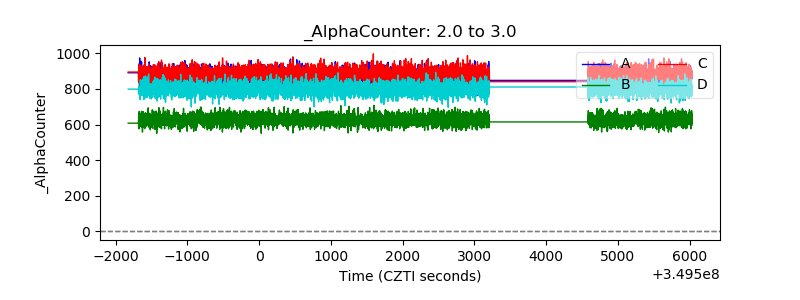 |
| _CPM_Rate | 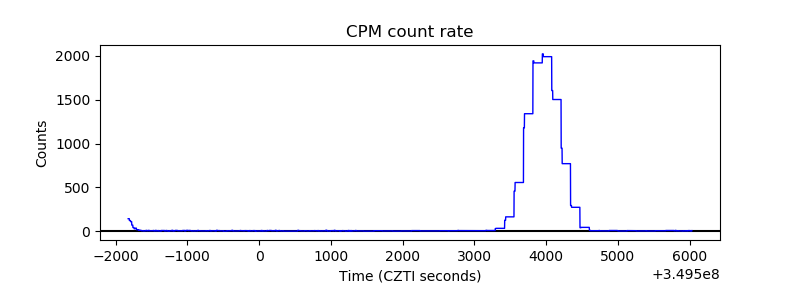 |
| CZT Counter | 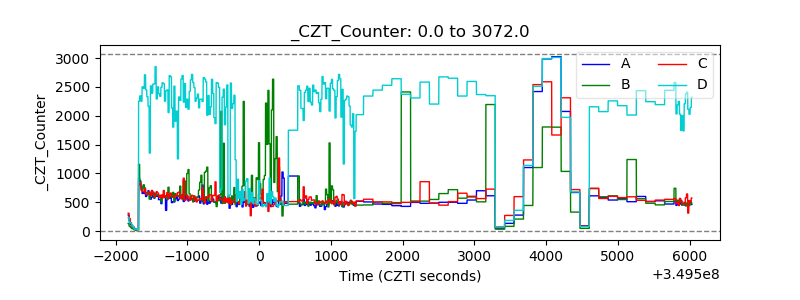 |
| +2.5 Volts monitor |  |
| +5 Volts monitor |  |
| _ROLL_ROT | 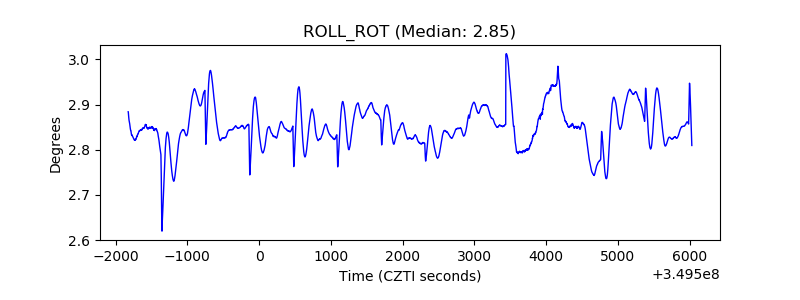 |
| _Roll_DEC | 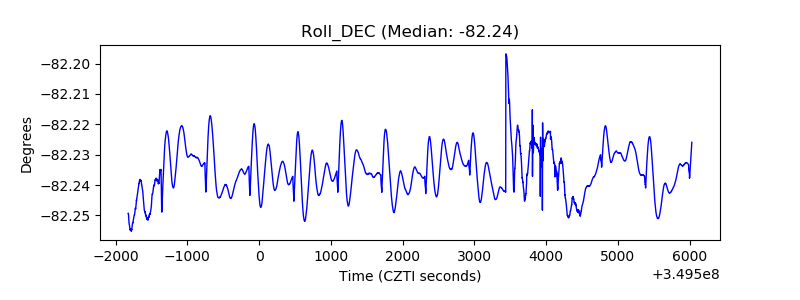 |
| _Roll_RA | 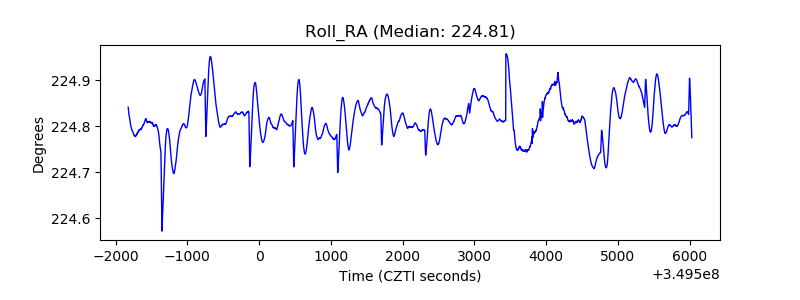 |
| Veto Counter | 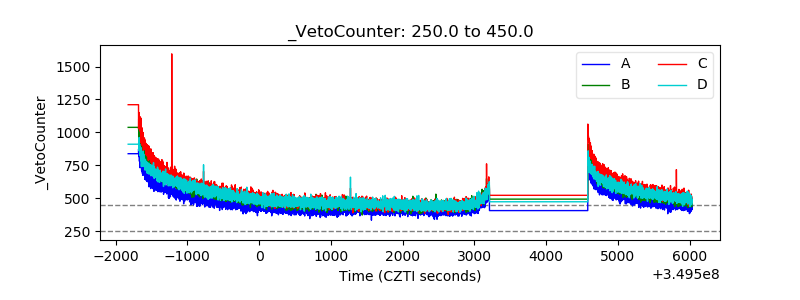 |