| Param | Original file | Final file |
|---|---|---|
| Filename | modeM0/AS1A10_103T08_9000004136_28850cztM0_level2.evt | modeM0/AS1A10_103T08_9000004136_28850cztM0_level2_quad_clean.evt |
| Size (bytes) | 790,453,440 | 121,239,360 |
| Size | 753.8 MB | 115.6 MB |
| Events in quadrant A | 2,973,147 | 888,222 |
| Events in quadrant B | 3,300,572 | 907,449 |
| Events in quadrant C | 3,447,818 | 871,527 |
| Events in quadrant D | 13,808,458 | 580,651 |
| Mode SS | |||
|---|---|---|---|
| Quadrant | BADHDUFLAG | Total packets | Discarded packets |
| A | 0 | 122 | 0 |
| B | 0 | 122 | 0 |
| C | 0 | 122 | 0 |
| D | 0 | 122 | 0 |
| Mode M9 | |||
|---|---|---|---|
| Quadrant | BADHDUFLAG | Total packets | Discarded packets |
| A | 0 | 12 | 0 |
| B | 0 | 12 | 0 |
| C | 0 | 12 | 0 |
| D | 0 | 12 | 0 |
| Mode M0 | |||
|---|---|---|---|
| Quadrant | BADHDUFLAG | Total packets | Discarded packets |
| A | 0 | 12401 | 1 |
| B | 0 | 13431 | 1 |
| C | 0 | 13911 | 1 |
| D | 0 | 45104 | 6 |
| Quadrant | Total seconds | Saturated seconds | Saturation percentage |
|---|---|---|---|
| A | 6042 | 27 | 0.446872% |
| B | 6043 | 94 | 1.555519% |
| C | 6043 | 128 | 2.118153% |
| D | 6042 | 5106 | 84.508441% |
Noise dominated data is calculated using 1-second bins in cleaned event files. If a bin has >2000 counts, and if more than 50% of those come from <1% of pixels, then it is considered to be noise-dominated and hence unusable.
| Quadrant | # 1 sec bins | Bins with >0 counts | Bins with >2000 counts | High rate bins dominated by noise | Noise dominated (total time) | Noise dominated (detector-on time) | Marked lightcurve |
|---|---|---|---|---|---|---|---|
| A | 7257 | 6043 | 0 | 0 | 0.00% | 0.00% | 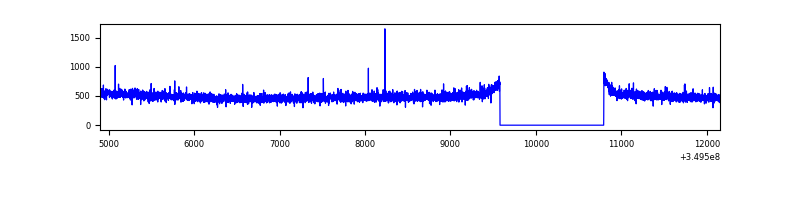 |
| B | 7258 | 6044 | 43 | 43 | 0.59% | 0.71% | 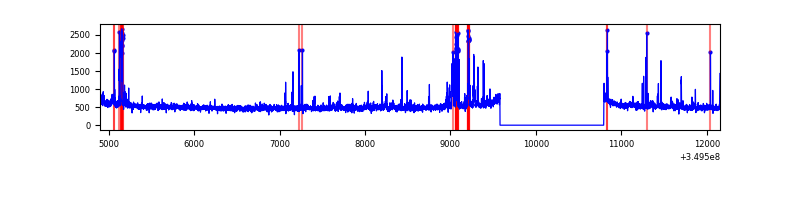 |
| C | 7258 | 6044 | 0 | 0 | 0.00% | 0.00% | 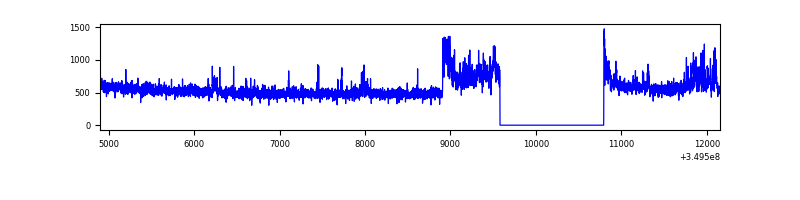 |
| D | 7256 | 6041 | 5276 | 5276 | 72.71% | 87.34% | 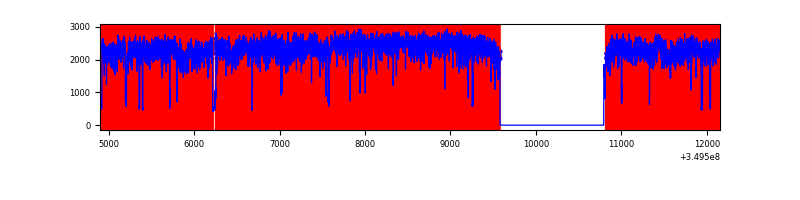 |
Top three noisy pixels from each quadrant. If the there are fewer than three noisy pixels in the level2.evt file, extra rows are filled as -1
| Pixel properties | Quadrant properties | ||||||
|---|---|---|---|---|---|---|---|
| Quadrant | DetID | PixID | Counts | Sigma | Mean | Median | Sigma |
| A | 13 | 254 | 12042 | 74.54 | 769 | 754 | 151.4 |
| A | 0 | 226 | 6670 | 39.07 | 769 | 754 | 151.4 |
| A | 3 | 137 | 6542 | 38.22 | 769 | 754 | 151.4 |
| B | 5 | 172 | 128119 | 910.03 | 765 | 747 | 140.0 |
| B | 10 | 246 | 99251 | 703.78 | 765 | 747 | 140.0 |
| B | 5 | 255 | 46704 | 328.35 | 765 | 747 | 140.0 |
| C | 3 | 233 | 371283 | 2140.76 | 751 | 755 | 173.1 |
| C | 14 | 238 | 130266 | 748.26 | 751 | 755 | 173.1 |
| C | 14 | 254 | 11743 | 63.48 | 751 | 755 | 173.1 |
| D | 8 | 195 | 9471553 | 70223.38 | 574 | 560 | 134.9 |
| D | 1 | 52 | 2091337 | 15502.22 | 574 | 560 | 134.9 |
| D | 13 | 104 | 21432 | 154.76 | 574 | 560 | 134.9 |
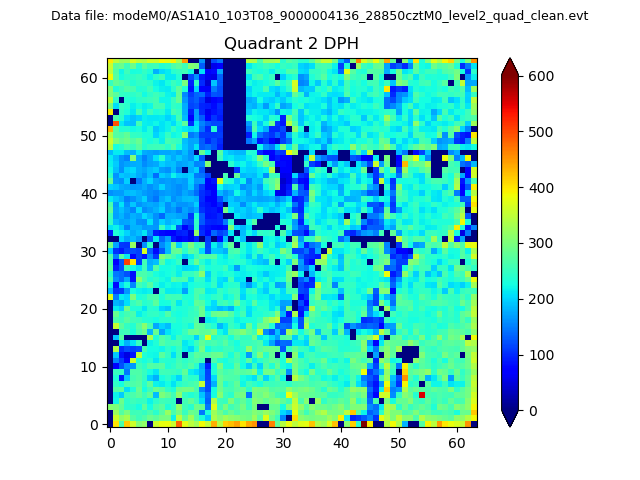
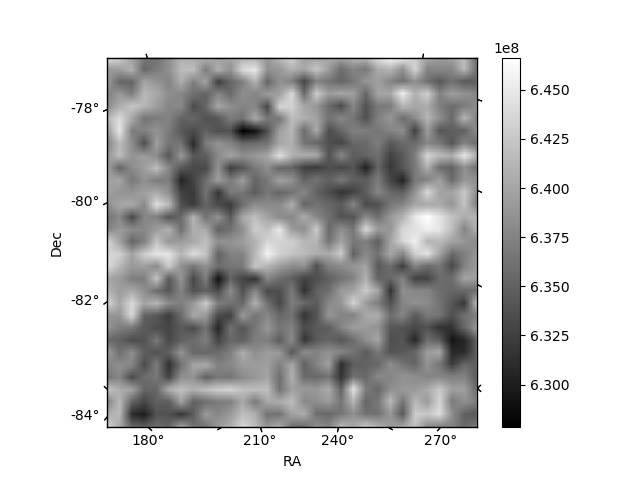
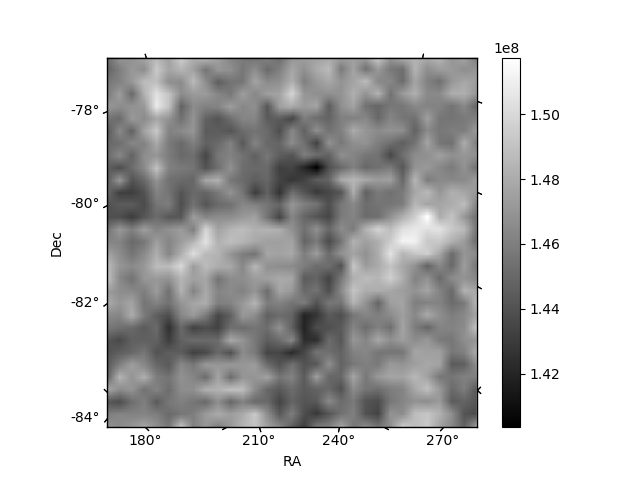
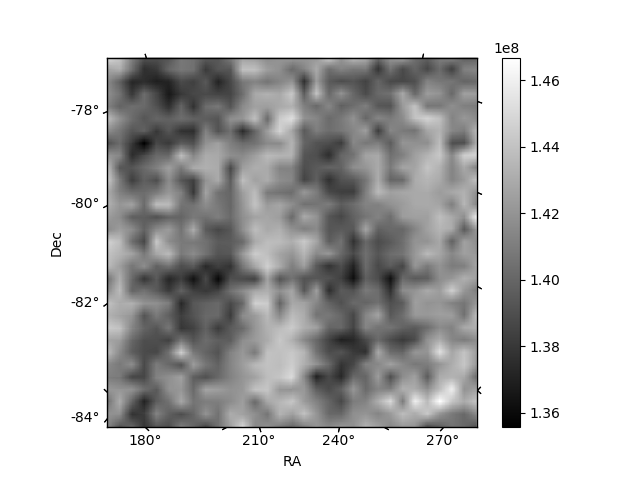
Histogram calculated using DETX and DETY for each event in the final _common_clean file
| Quadrant A | 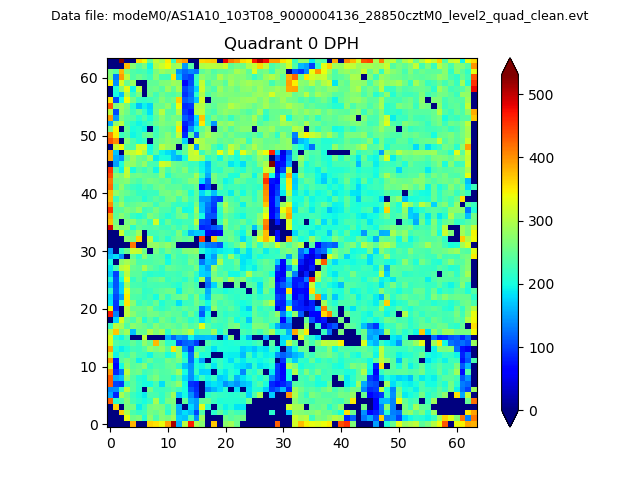 |
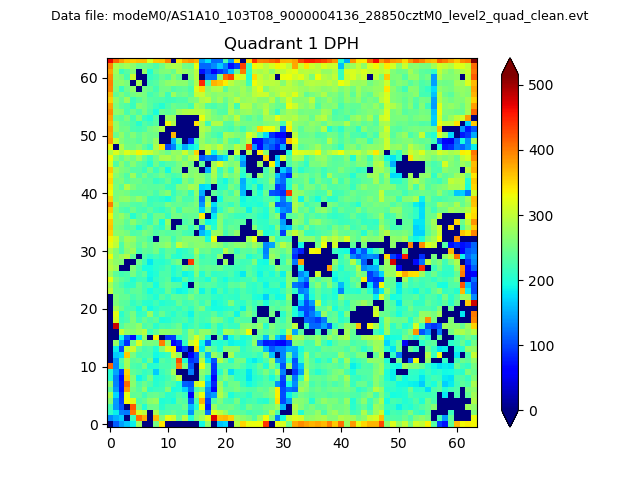 |
Quadrant B |
|---|---|---|---|
| Quadrant D | 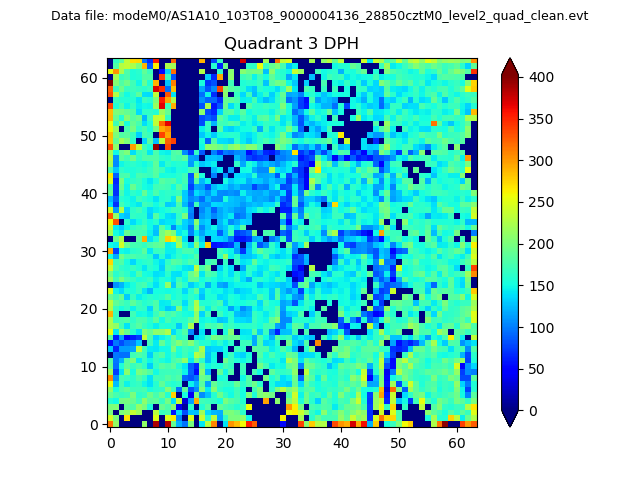 |
 |
Quadrant C |
| Plot type | Count rate plots | Images |
|---|---|---|
| Comparison with Poisson distribution Blue bars denote a histogram of data divided into 1 sec bins. Red curve is a Poisson curve with rate = median count rate of data. |
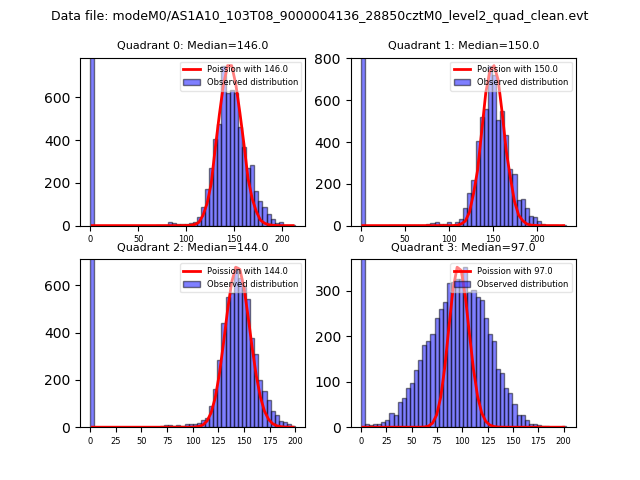 |
 |
| Quadrant-wise count rates Data is divided into 100 sec bins |
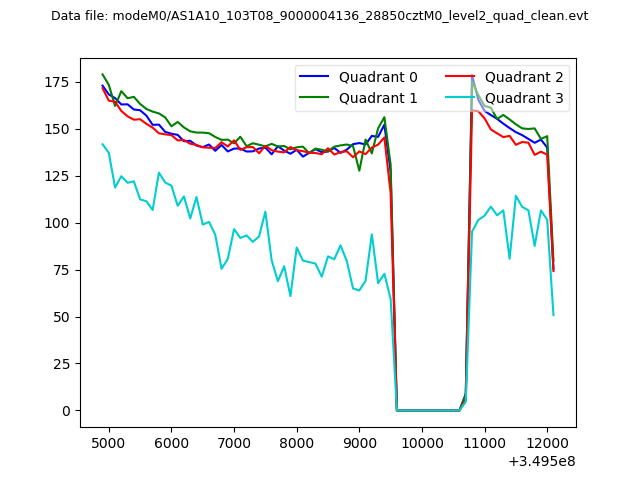 |
|
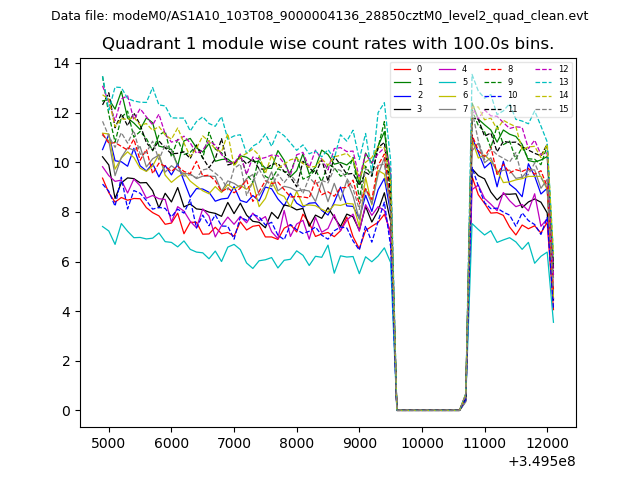
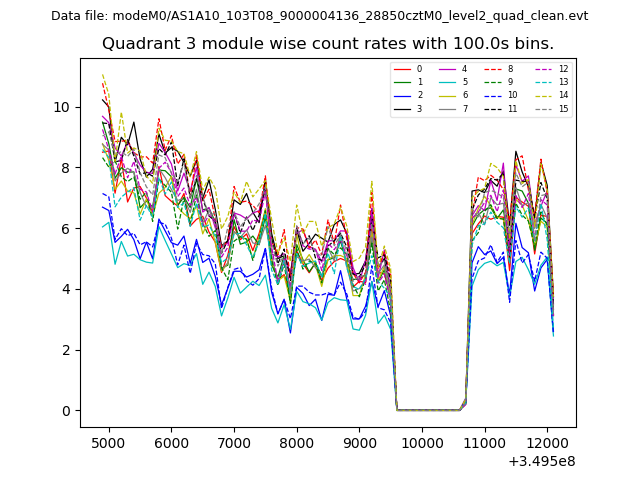
| Module-wise count rates for Quadrant A Data is divided into 100 sec bins |
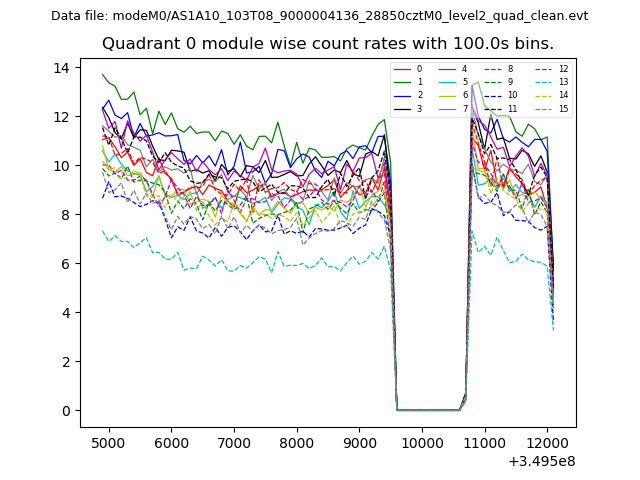 |
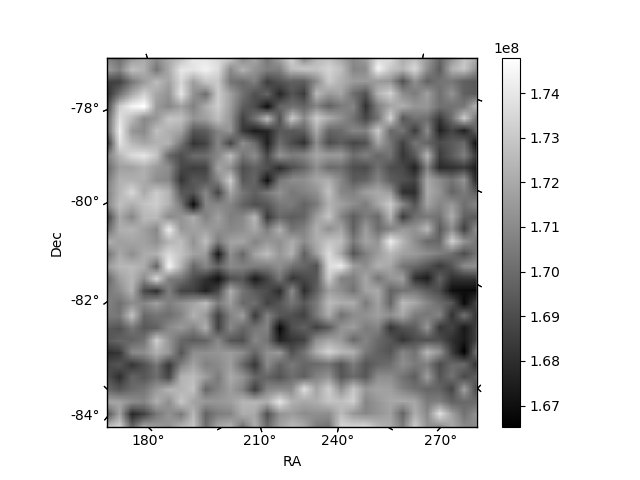 |
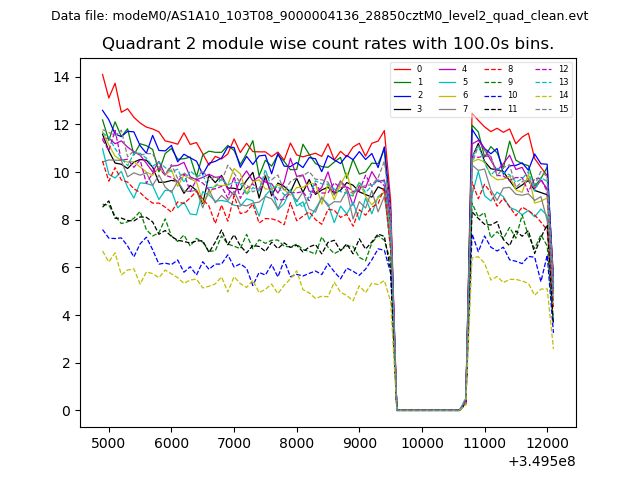
| Module-wise count rates for Quadrant B Data is divided into 100 sec bins |
 |
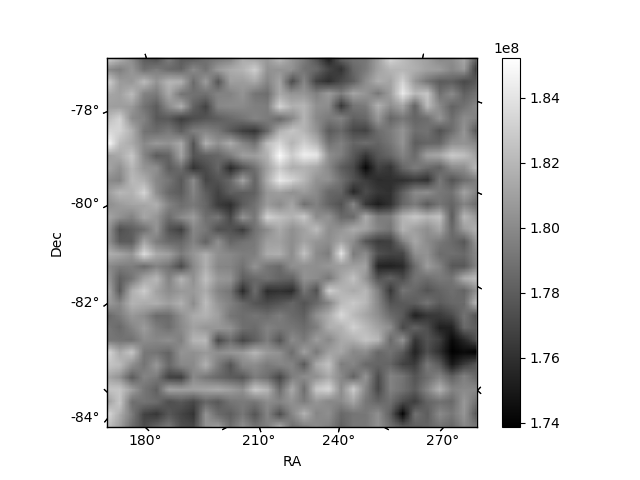 |
| Module-wise count rates for Quadrant C Data is divided into 100 sec bins |
 |
 |
| Module-wise count rates for Quadrant D Data is divided into 100 sec bins |
 |
 |
| Parameter | Plot |
|---|---|
| CZT HV Monitor | 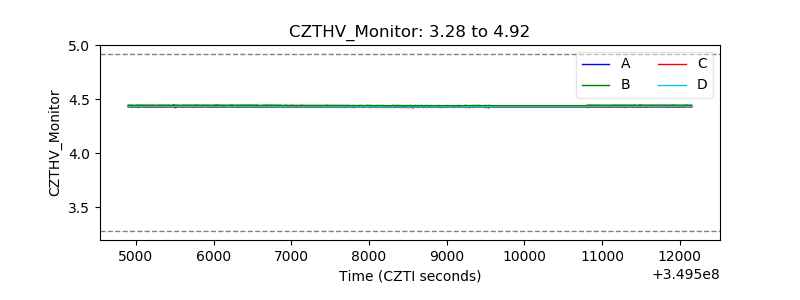 |
| D_VDD | 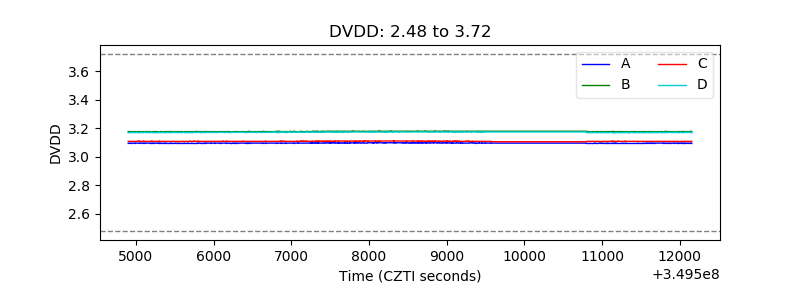 |
| Temperature 1 | 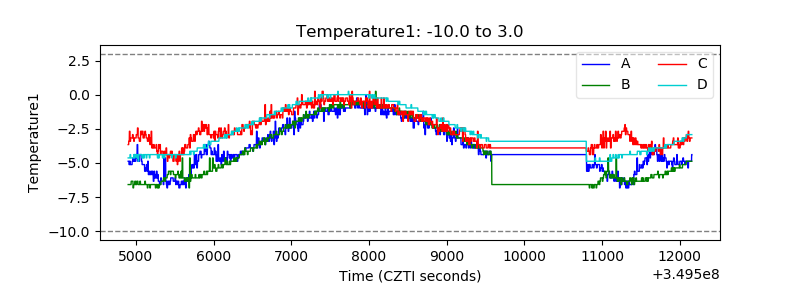 |
| Veto HV Monitor | 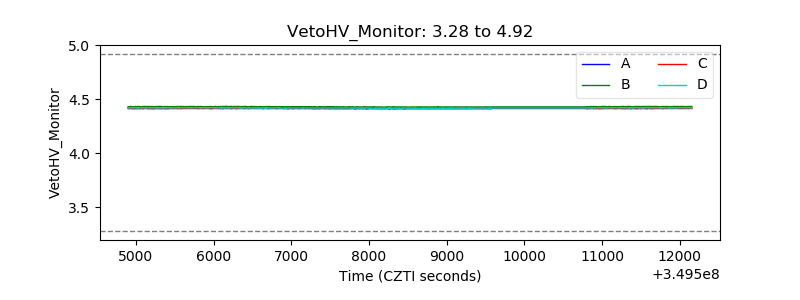 |
| Veto LLD | 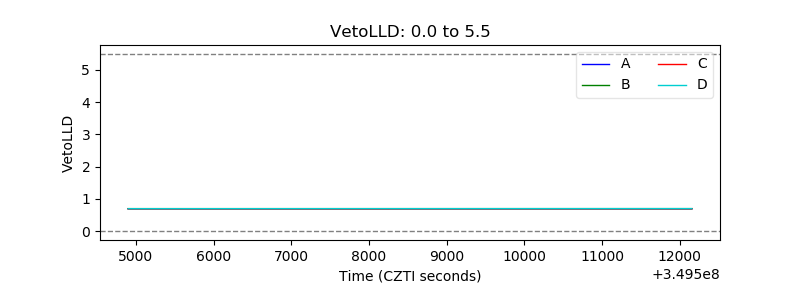 |
| Alpha Counter | 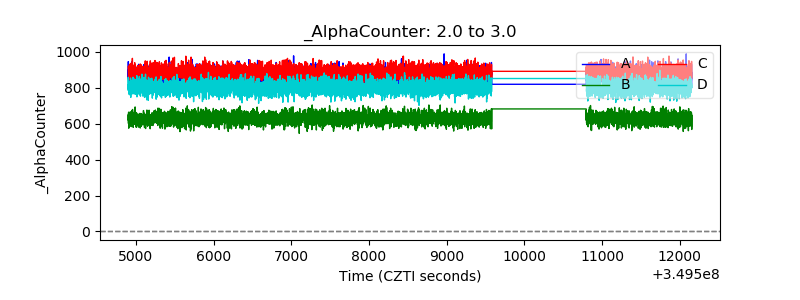 |
| _CPM_Rate | 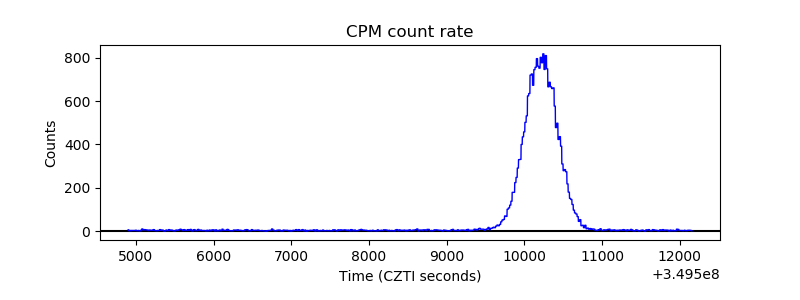 |
| CZT Counter | 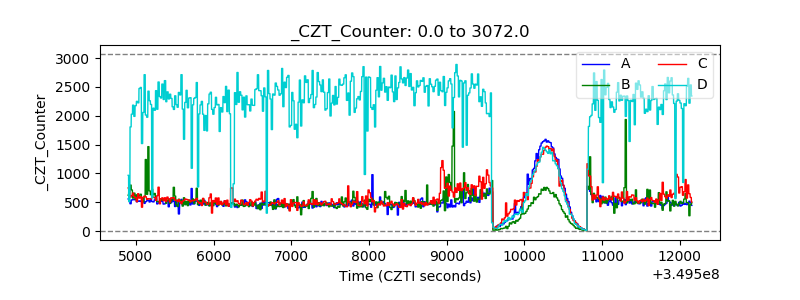 |
| +2.5 Volts monitor |  |
| +5 Volts monitor |  |
| _ROLL_ROT | 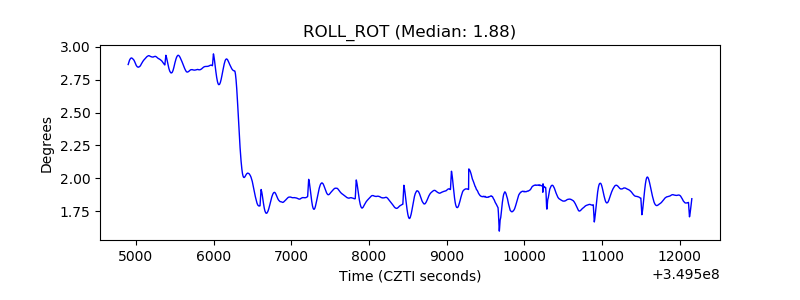 |
| _Roll_DEC | 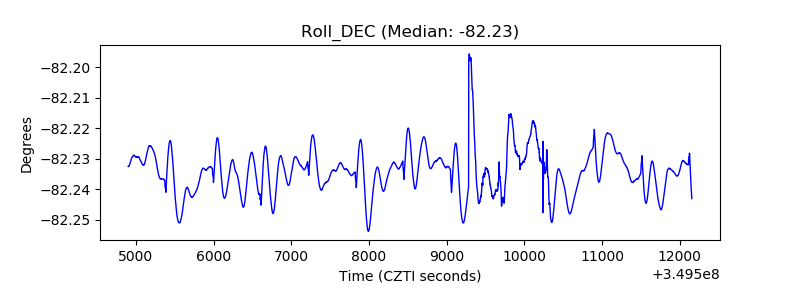 |
| _Roll_RA | 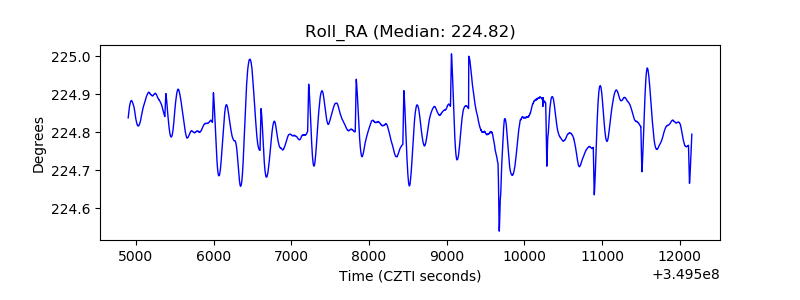 |
| Veto Counter | 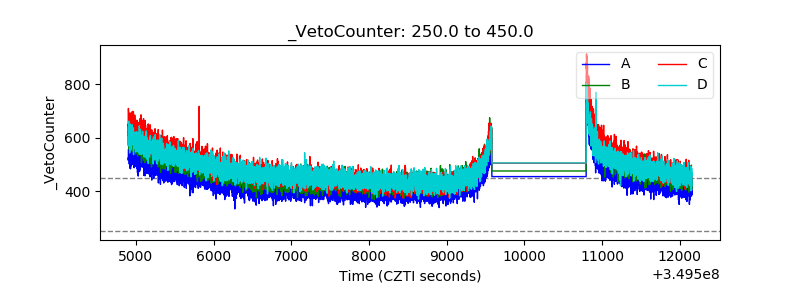 |