| Param | Original file | Final file |
|---|---|---|
| Filename | modeM0/AS1A10_103T08_9000004136_28852cztM0_level2.evt | modeM0/AS1A10_103T08_9000004136_28852cztM0_level2_quad_clean.evt |
| Size (bytes) | 871,908,480 | 118,883,520 |
| Size | 831.5 MB | 113.4 MB |
| Events in quadrant A | 3,136,623 | 863,654 |
| Events in quadrant B | 3,419,639 | 873,921 |
| Events in quadrant C | 4,456,406 | 833,982 |
| Events in quadrant D | 14,945,584 | 564,931 |
| Mode SS | |||
|---|---|---|---|
| Quadrant | BADHDUFLAG | Total packets | Discarded packets |
| A | 0 | 134 | 0 |
| B | 0 | 134 | 0 |
| C | 0 | 134 | 0 |
| D | 0 | 134 | 0 |
| Mode M9 | |||
|---|---|---|---|
| Quadrant | BADHDUFLAG | Total packets | Discarded packets |
| A | 0 | 4 | 0 |
| B | 0 | 4 | 0 |
| C | 0 | 4 | 0 |
| D | 0 | 4 | 0 |
| Mode M0 | |||
|---|---|---|---|
| Quadrant | BADHDUFLAG | Total packets | Discarded packets |
| A | 0 | 13649 | 1 |
| B | 0 | 14404 | 1 |
| C | 0 | 17675 | 1 |
| D | 0 | 48843 | 1 |
| Quadrant | Total seconds | Saturated seconds | Saturation percentage |
|---|---|---|---|
| A | 6615 | 184 | 2.781557% |
| B | 6616 | 248 | 3.748489% |
| C | 6616 | 291 | 4.398428% |
| D | 6616 | 5712 | 86.336155% |
Noise dominated data is calculated using 1-second bins in cleaned event files. If a bin has >2000 counts, and if more than 50% of those come from <1% of pixels, then it is considered to be noise-dominated and hence unusable.
| Quadrant | # 1 sec bins | Bins with >0 counts | Bins with >2000 counts | High rate bins dominated by noise | Noise dominated (total time) | Noise dominated (detector-on time) | Marked lightcurve |
|---|---|---|---|---|---|---|---|
| A | 7035 | 6615 | 0 | 0 | 0.00% | 0.00% |  |
| B | 7036 | 6616 | 39 | 39 | 0.55% | 0.59% |  |
| C | 7036 | 6616 | 3 | 3 | 0.04% | 0.05% |  |
| D | 7035 | 6615 | 5537 | 5537 | 78.71% | 83.70% | 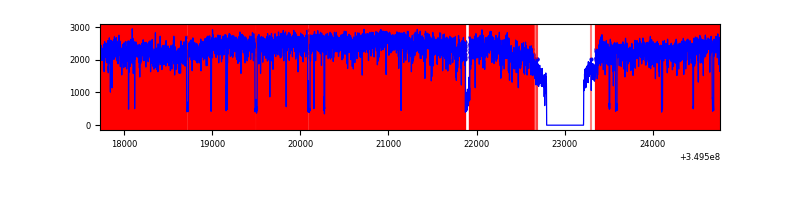 |
Top three noisy pixels from each quadrant. If the there are fewer than three noisy pixels in the level2.evt file, extra rows are filled as -1
| Pixel properties | Quadrant properties | ||||||
|---|---|---|---|---|---|---|---|
| Quadrant | DetID | PixID | Counts | Sigma | Mean | Median | Sigma |
| A | 14 | 235 | 38997 | 236.48 | 796 | 777 | 161.6 |
| A | 1 | 113 | 26708 | 160.44 | 796 | 777 | 161.6 |
| A | 13 | 254 | 12585 | 73.06 | 796 | 777 | 161.6 |
| B | 5 | 172 | 190410 | 1273.13 | 789 | 768 | 149.0 |
| B | 5 | 255 | 69767 | 463.21 | 789 | 768 | 149.0 |
| B | 10 | 246 | 21166 | 136.94 | 789 | 768 | 149.0 |
| C | 3 | 233 | 1331342 | 7525.39 | 764 | 767 | 176.8 |
| C | 14 | 238 | 128844 | 724.37 | 764 | 767 | 176.8 |
| C | 14 | 254 | 8296 | 42.58 | 764 | 767 | 176.8 |
| D | 8 | 195 | 11661820 | 81749.77 | 596 | 580 | 142.6 |
| D | 1 | 52 | 901691 | 6317.13 | 596 | 580 | 142.6 |
| D | 7 | 69 | 37383 | 258.0 | 596 | 580 | 142.6 |
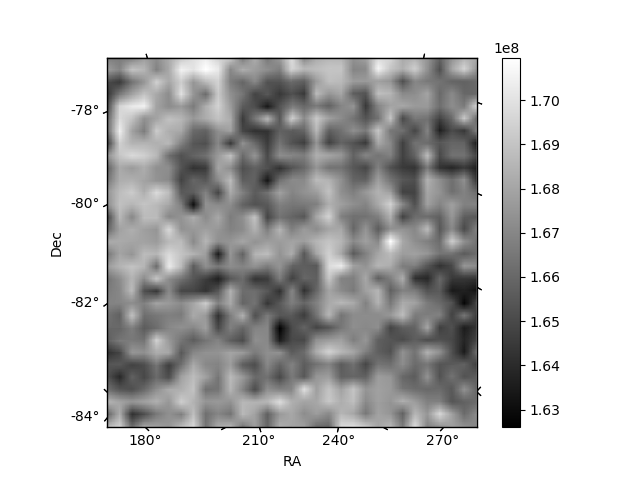
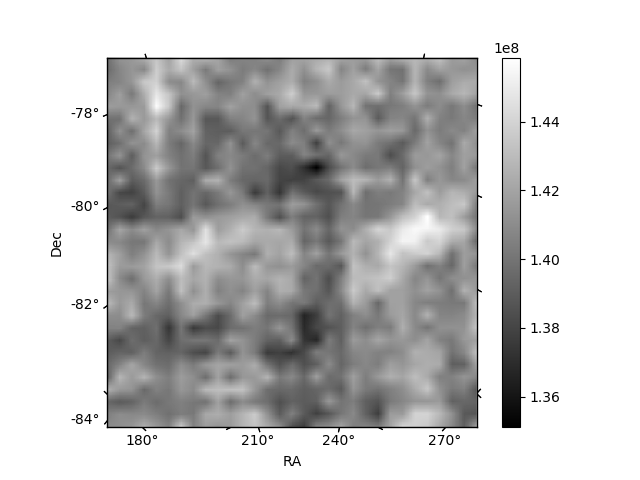
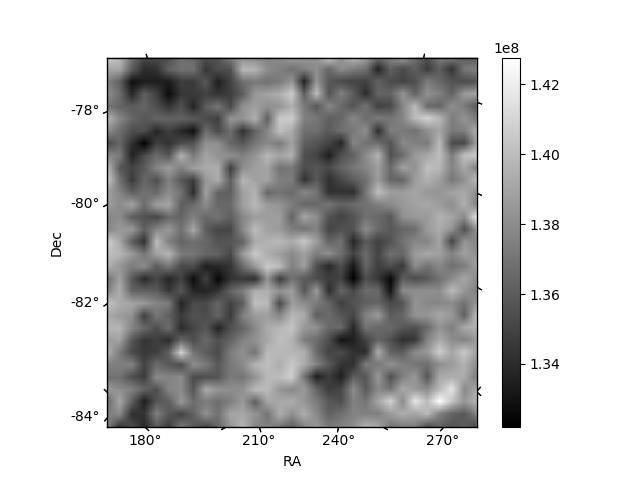
Histogram calculated using DETX and DETY for each event in the final _common_clean file
| Quadrant A | 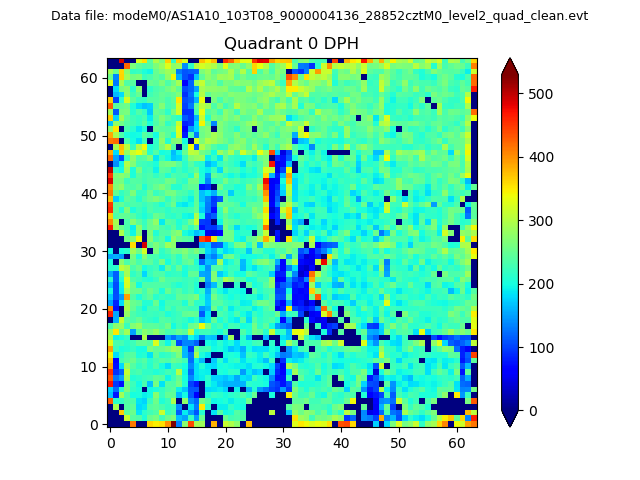 |
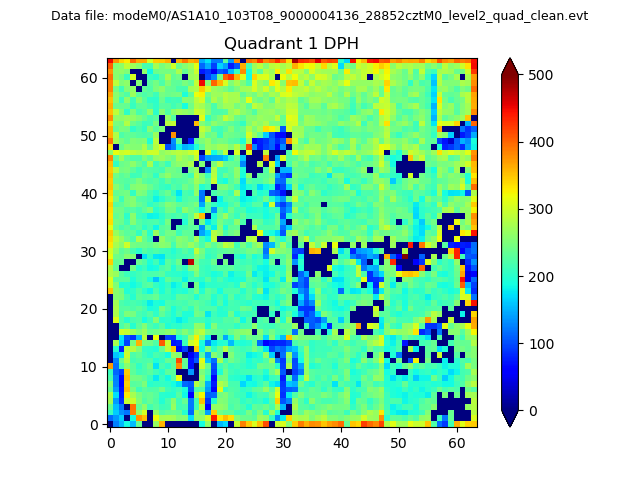 |
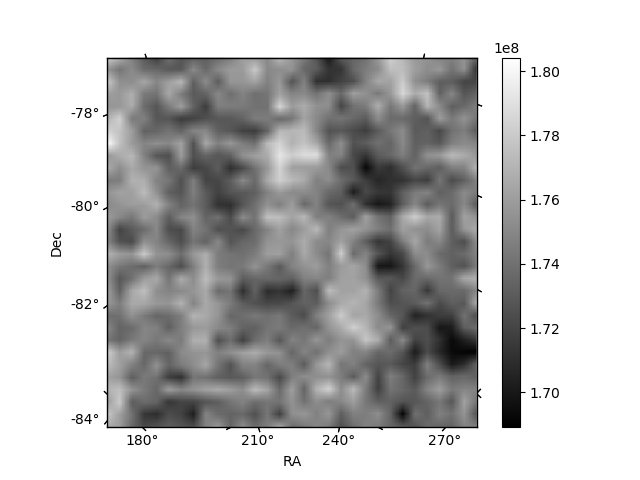
Quadrant B |
|---|---|---|---|
| Quadrant D | 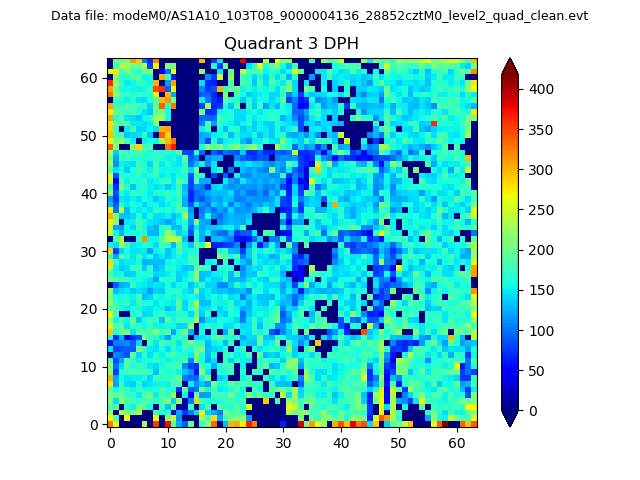 |
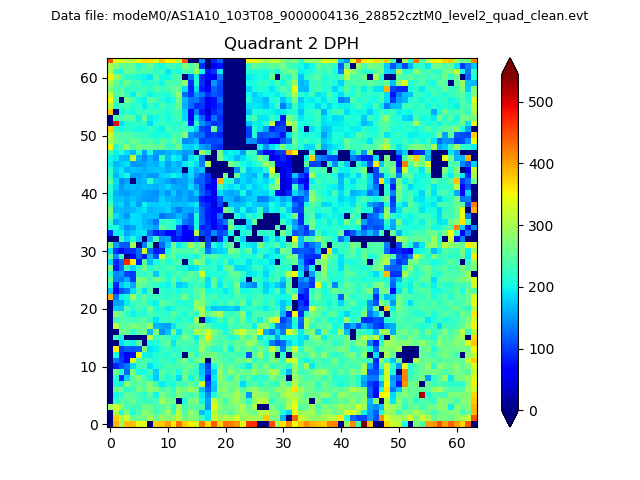 |
Quadrant C |
| Plot type | Count rate plots | Images |
|---|---|---|
| Comparison with Poisson distribution Blue bars denote a histogram of data divided into 1 sec bins. Red curve is a Poisson curve with rate = median count rate of data. |
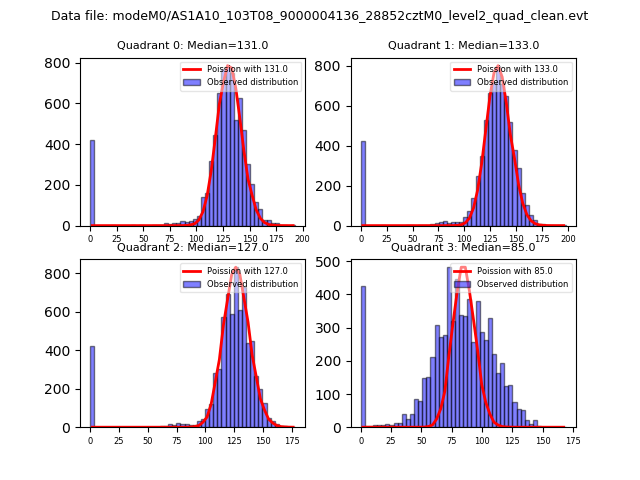 |
 |
| Quadrant-wise count rates Data is divided into 100 sec bins |
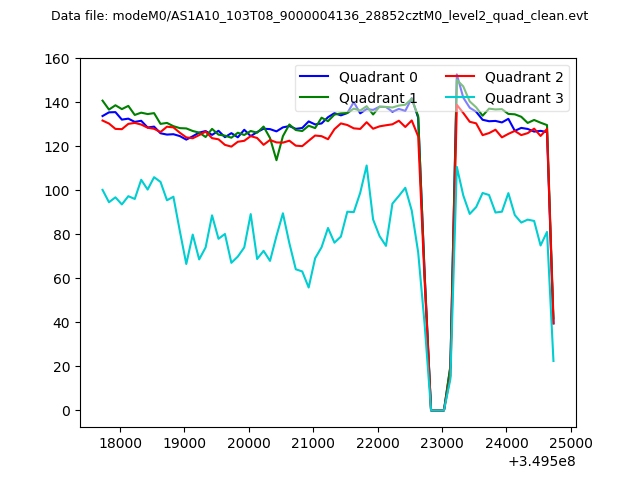 |
|
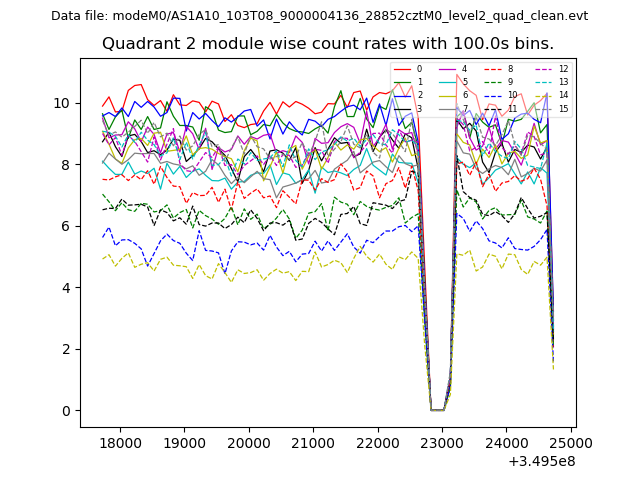
| Module-wise count rates for Quadrant A Data is divided into 100 sec bins |
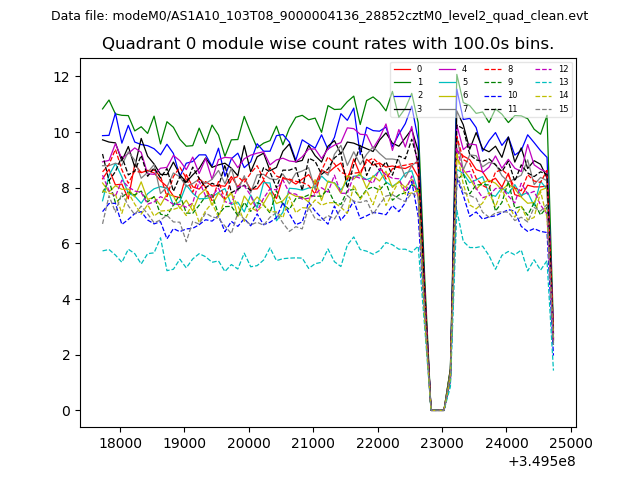 |
 |
| Module-wise count rates for Quadrant B Data is divided into 100 sec bins |
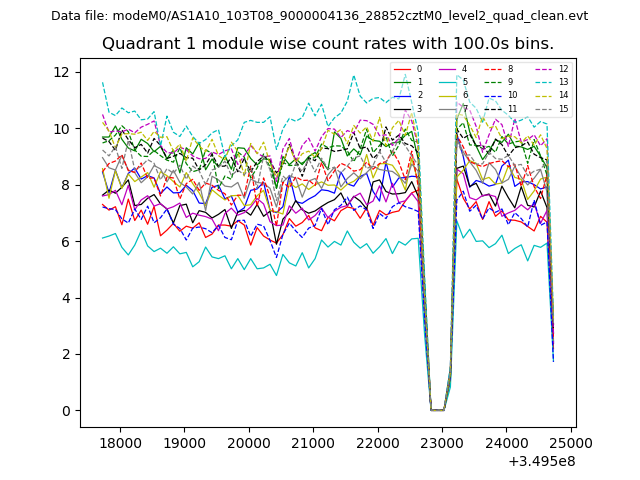 |
 |
| Module-wise count rates for Quadrant C Data is divided into 100 sec bins |
 |
 |
| Module-wise count rates for Quadrant D Data is divided into 100 sec bins |
 |
 |
| Parameter | Plot |
|---|---|
| CZT HV Monitor | 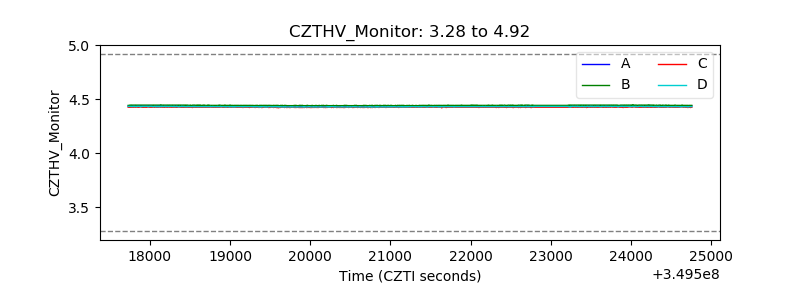 |
| D_VDD | 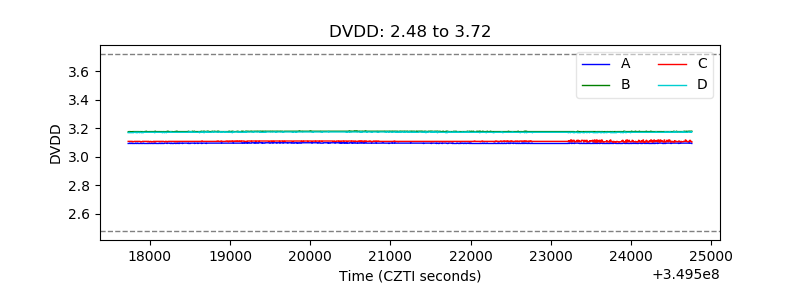 |
| Temperature 1 | 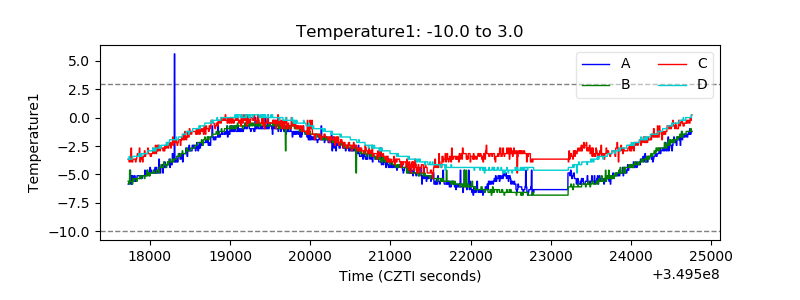 |
| Veto HV Monitor | 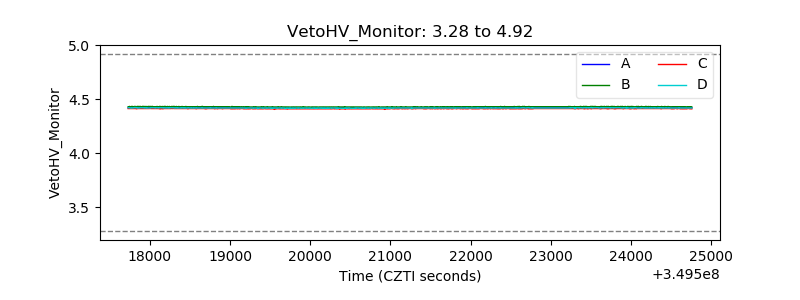 |
| Veto LLD |  |
| Alpha Counter | 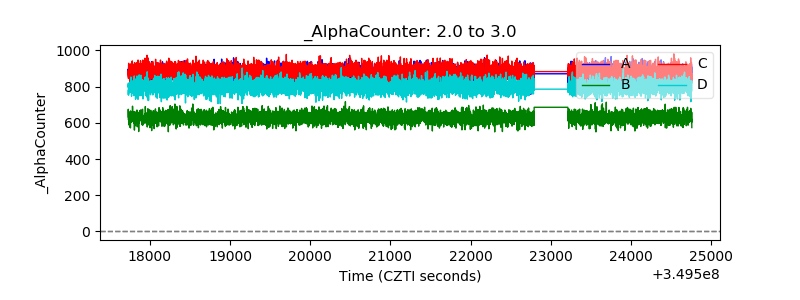 |
| _CPM_Rate | 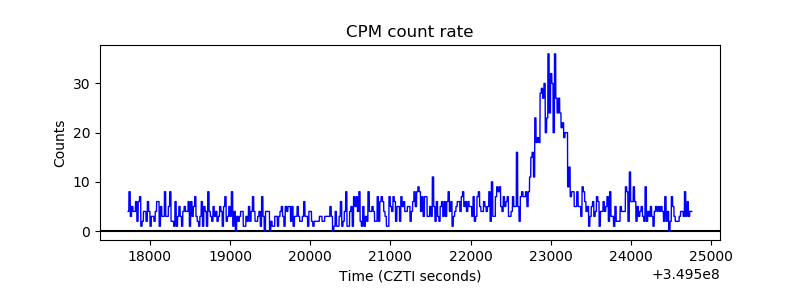 |
| CZT Counter |  |
| +2.5 Volts monitor |  |
| +5 Volts monitor |  |
| _ROLL_ROT | 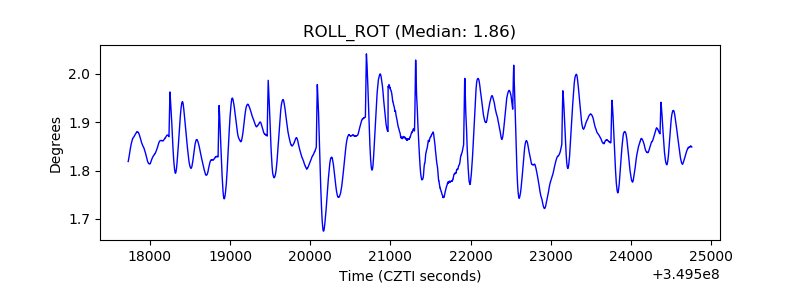 |
| _Roll_DEC | 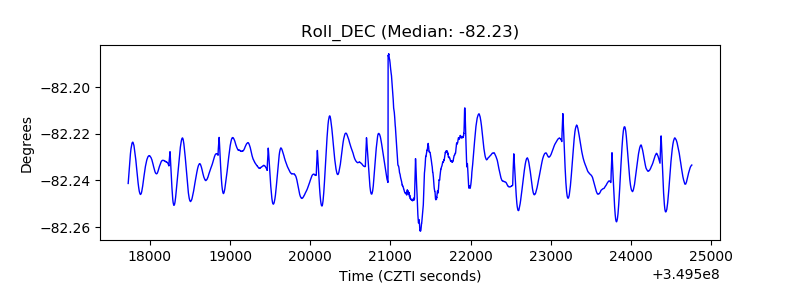 |
| _Roll_RA | 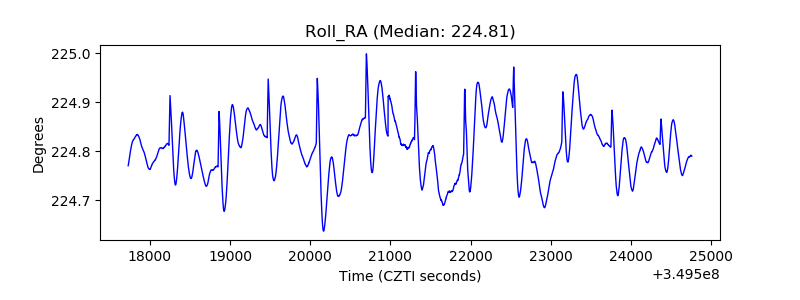 |
| Veto Counter | 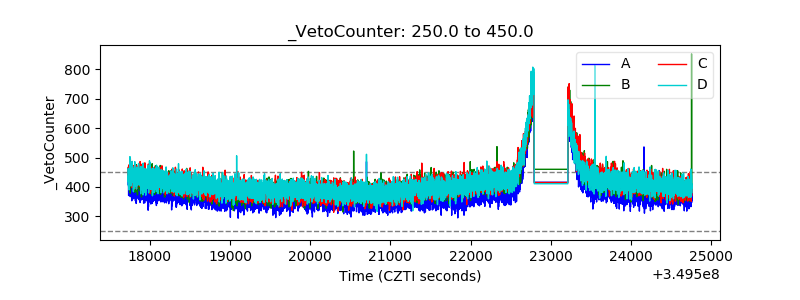 |