| Param | Original file | Final file |
|---|---|---|
| Filename | modeM0/AS1A10_103T08_9000004136_28853cztM0_level2.evt | modeM0/AS1A10_103T08_9000004136_28853cztM0_level2_quad_clean.evt |
| Size (bytes) | 854,778,240 | 130,556,160 |
| Size | 815.2 MB | 124.5 MB |
| Events in quadrant A | 3,500,940 | 933,989 |
| Events in quadrant B | 4,361,582 | 934,308 |
| Events in quadrant C | 4,382,728 | 906,509 |
| Events in quadrant D | 13,147,841 | 668,825 |
| Mode SS | |||
|---|---|---|---|
| Quadrant | BADHDUFLAG | Total packets | Discarded packets |
| A | 0 | 146 | 0 |
| B | 0 | 146 | 0 |
| C | 0 | 146 | 0 |
| D | 0 | 146 | 0 |
| Mode M9 | |||
|---|---|---|---|
| Quadrant | BADHDUFLAG | Total packets | Discarded packets |
| A | 0 | 1 | 0 |
| B | 0 | 1 | 0 |
| C | 0 | 1 | 0 |
| D | 0 | 1 | 0 |
| Mode M0 | |||
|---|---|---|---|
| Quadrant | BADHDUFLAG | Total packets | Discarded packets |
| A | 0 | 15159 | 1 |
| B | 0 | 17719 | 1 |
| C | 0 | 17673 | 1 |
| D | 0 | 43993 | 1 |
| Quadrant | Total seconds | Saturated seconds | Saturation percentage |
|---|---|---|---|
| A | 7308 | 279 | 3.817734% |
| B | 7309 | 523 | 7.155562% |
| C | 7309 | 358 | 4.898071% |
| D | 7309 | 4190 | 57.326584% |
Noise dominated data is calculated using 1-second bins in cleaned event files. If a bin has >2000 counts, and if more than 50% of those come from <1% of pixels, then it is considered to be noise-dominated and hence unusable.
| Quadrant | # 1 sec bins | Bins with >0 counts | Bins with >2000 counts | High rate bins dominated by noise | Noise dominated (total time) | Noise dominated (detector-on time) | Marked lightcurve |
|---|---|---|---|---|---|---|---|
| A | 7368 | 7308 | 0 | 0 | 0.00% | 0.00% |  |
| B | 7369 | 7309 | 173 | 173 | 2.35% | 2.37% |  |
| C | 7369 | 7309 | 12 | 12 | 0.16% | 0.16% |  |
| D | 7368 | 7308 | 4068 | 4068 | 55.21% | 55.67% |  |
Top three noisy pixels from each quadrant. If the there are fewer than three noisy pixels in the level2.evt file, extra rows are filled as -1
| Pixel properties | Quadrant properties | ||||||
|---|---|---|---|---|---|---|---|
| Quadrant | DetID | PixID | Counts | Sigma | Mean | Median | Sigma |
| A | 1 | 113 | 66716 | 371.81 | 881 | 858 | 177.1 |
| A | 14 | 235 | 22980 | 124.89 | 881 | 858 | 177.1 |
| A | 13 | 254 | 14278 | 75.76 | 881 | 858 | 177.1 |
| B | 10 | 246 | 439801 | 2669.69 | 866 | 844 | 164.4 |
| B | 5 | 255 | 292776 | 1775.5 | 866 | 844 | 164.4 |
| B | 5 | 172 | 174102 | 1053.74 | 866 | 844 | 164.4 |
| C | 3 | 233 | 814640 | 4121.93 | 848 | 853 | 197.4 |
| C | 14 | 238 | 139974 | 704.66 | 848 | 853 | 197.4 |
| C | 15 | 208 | 98888 | 496.56 | 848 | 853 | 197.4 |
| D | 8 | 195 | 7223788 | 43225.08 | 705 | 683 | 167.1 |
| D | 1 | 52 | 2893972 | 17314.25 | 705 | 683 | 167.1 |
| D | 2 | 250 | 179386 | 1069.41 | 705 | 683 | 167.1 |
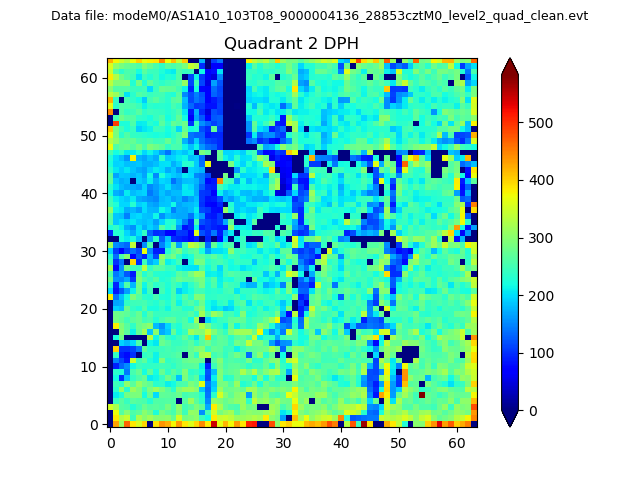
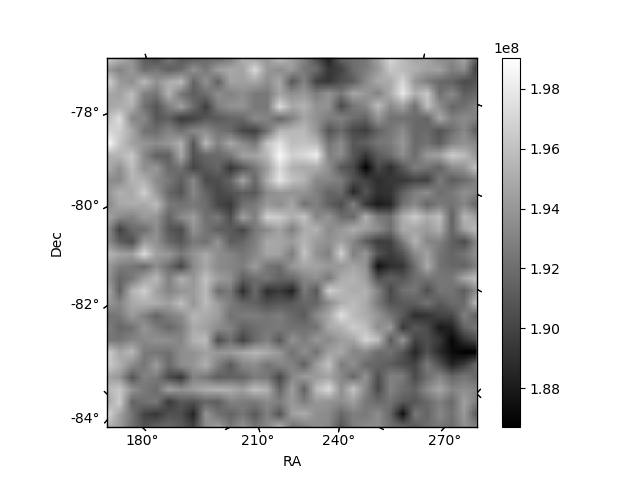
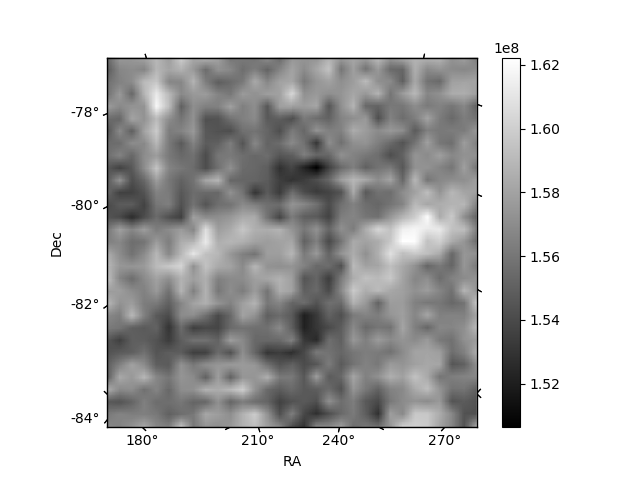
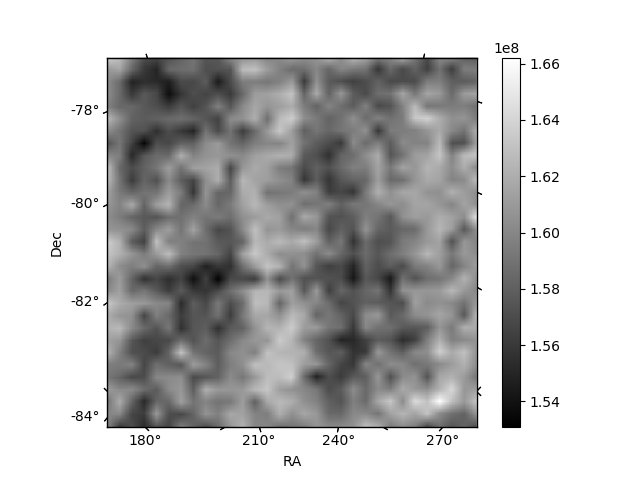
Histogram calculated using DETX and DETY for each event in the final _common_clean file
| Quadrant A | 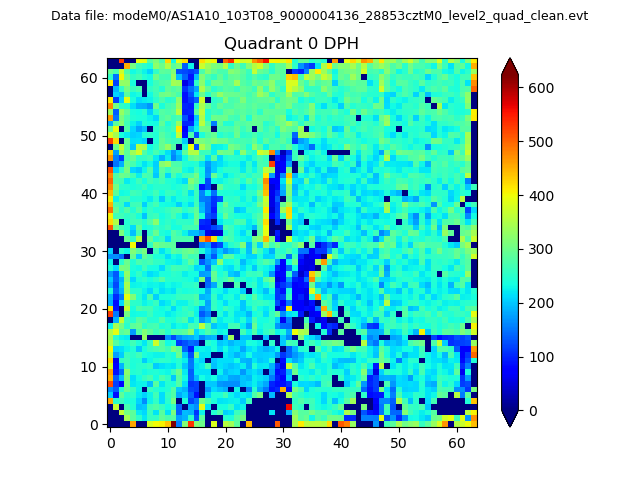 |
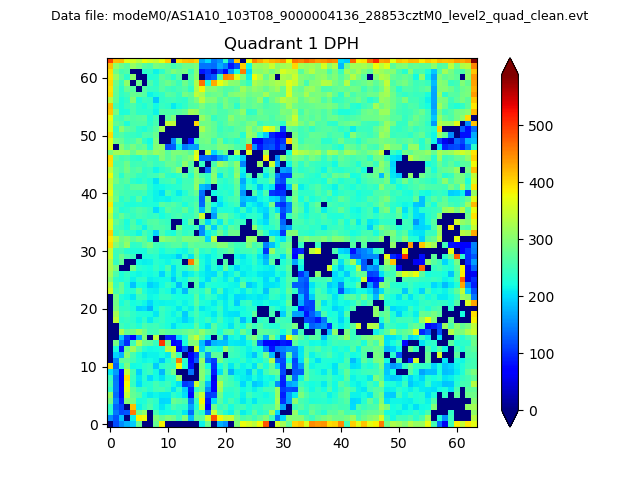 |
Quadrant B |
|---|---|---|---|
| Quadrant D | 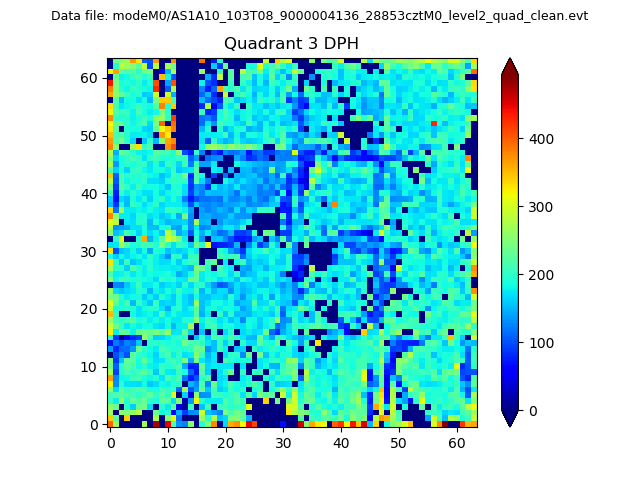 |
 |
Quadrant C |
| Plot type | Count rate plots | Images |
|---|---|---|
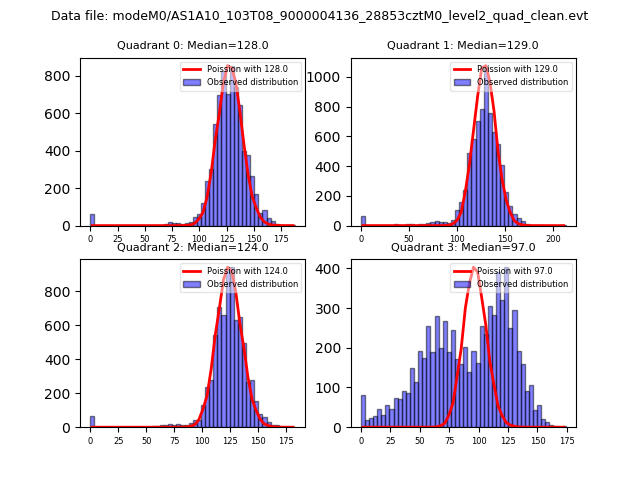
| Comparison with Poisson distribution Blue bars denote a histogram of data divided into 1 sec bins. Red curve is a Poisson curve with rate = median count rate of data. |
 |
 |
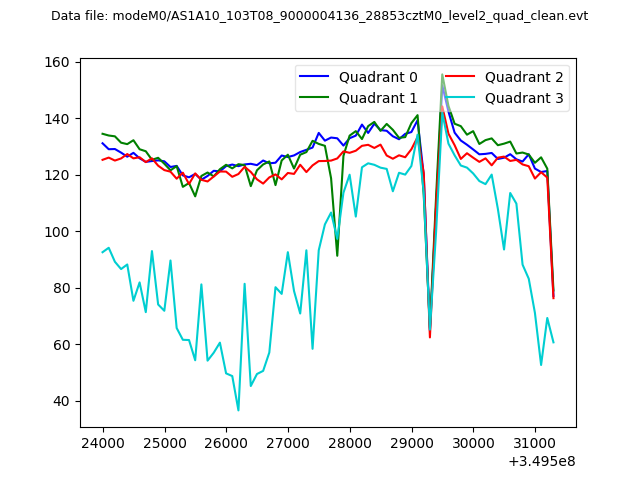
| Quadrant-wise count rates Data is divided into 100 sec bins |
 |
|
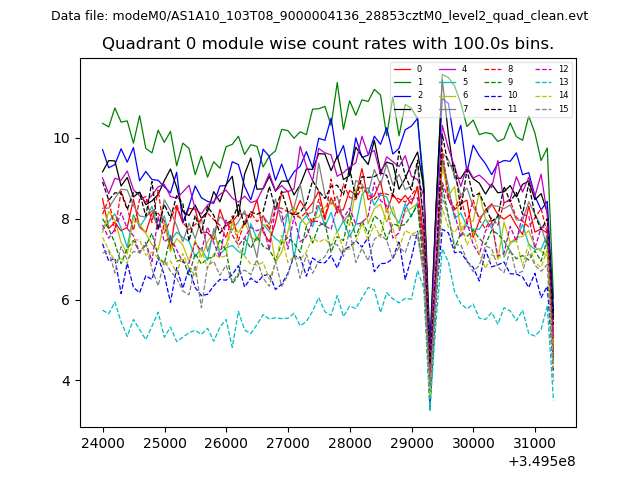
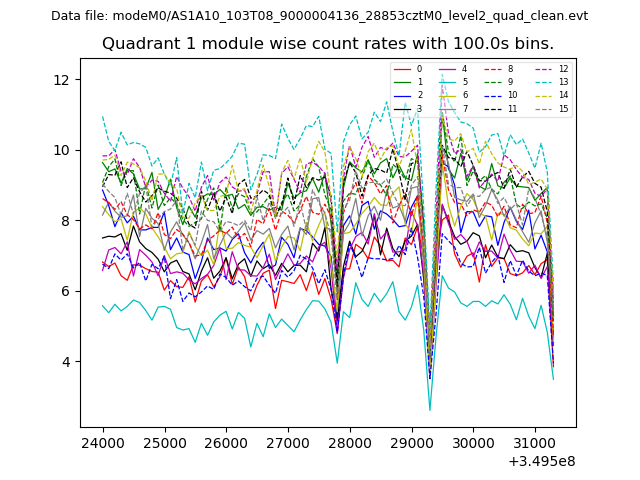
| Module-wise count rates for Quadrant A Data is divided into 100 sec bins |
 |
 |
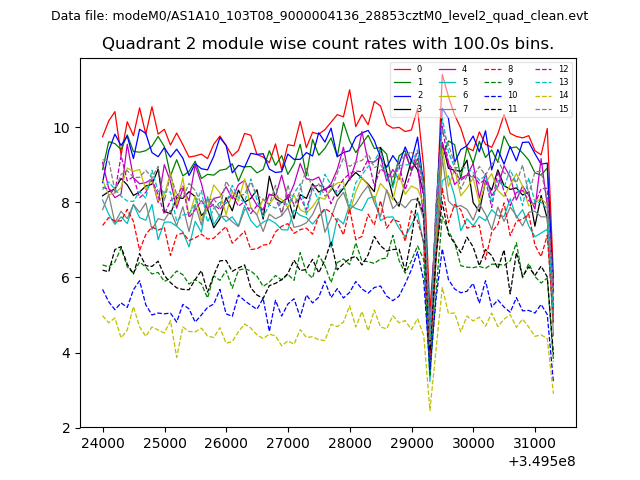
| Module-wise count rates for Quadrant B Data is divided into 100 sec bins |
 |
 |
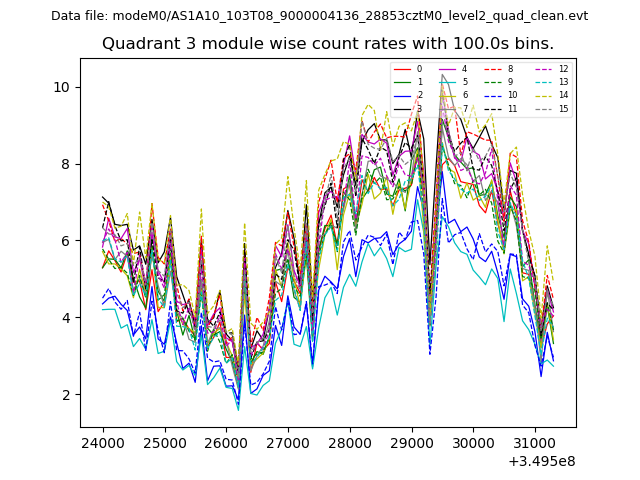
| Module-wise count rates for Quadrant C Data is divided into 100 sec bins |
 |
 |
| Module-wise count rates for Quadrant D Data is divided into 100 sec bins |
 |
 |
| Parameter | Plot |
|---|---|
| CZT HV Monitor | 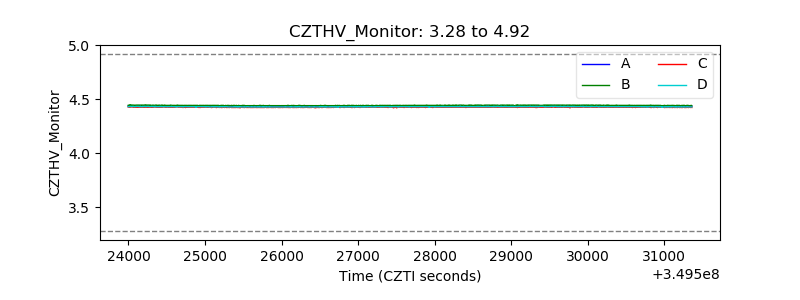 |
| D_VDD | 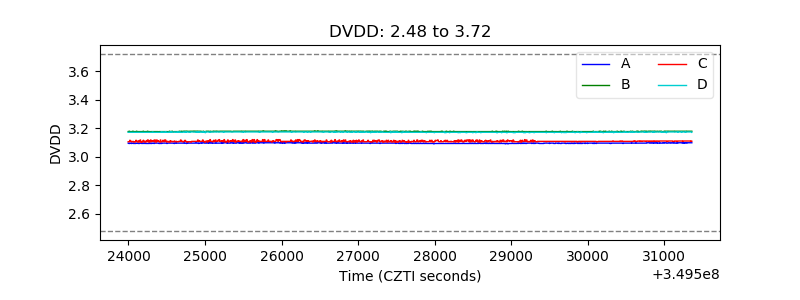 |
| Temperature 1 | 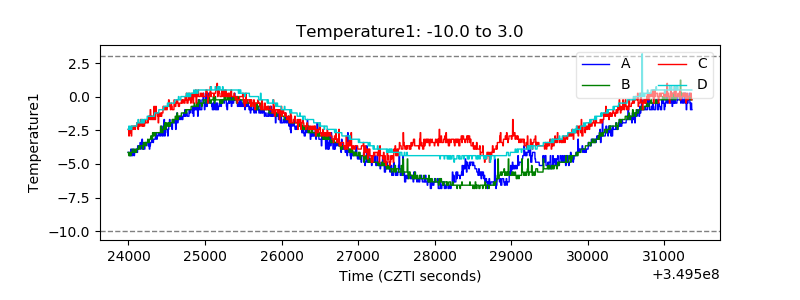 |
| Veto HV Monitor | 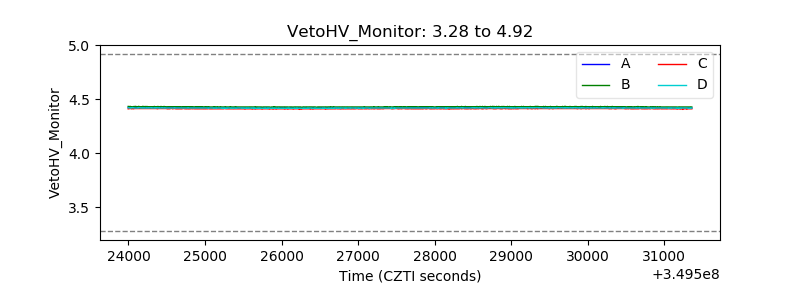 |
| Veto LLD | 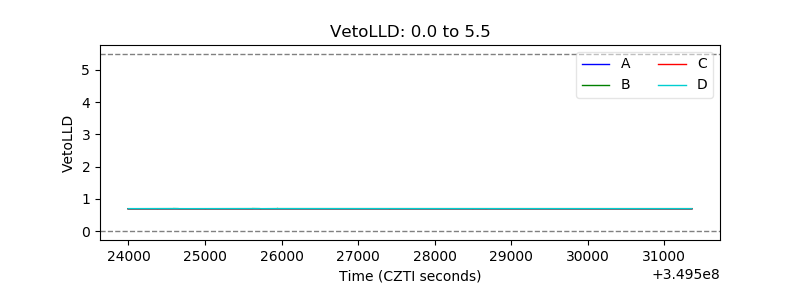 |
| Alpha Counter | 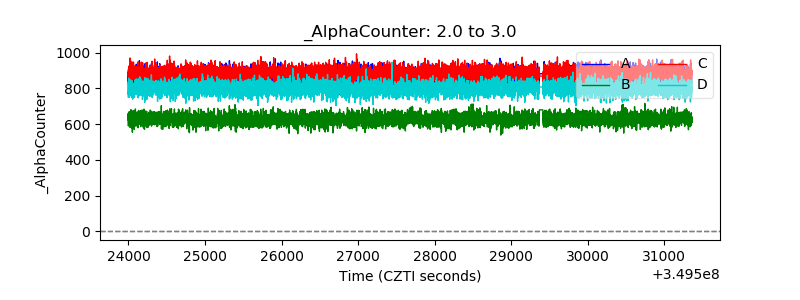 |
| _CPM_Rate | 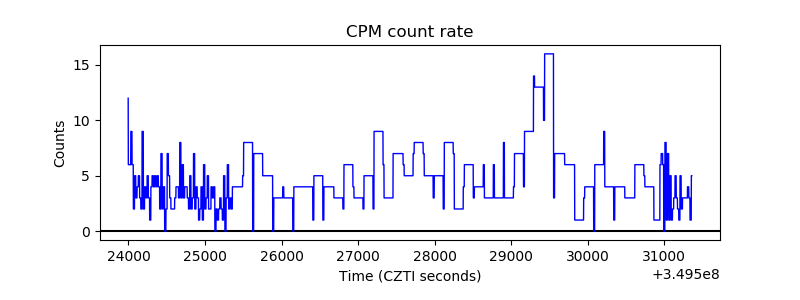 |
| CZT Counter | 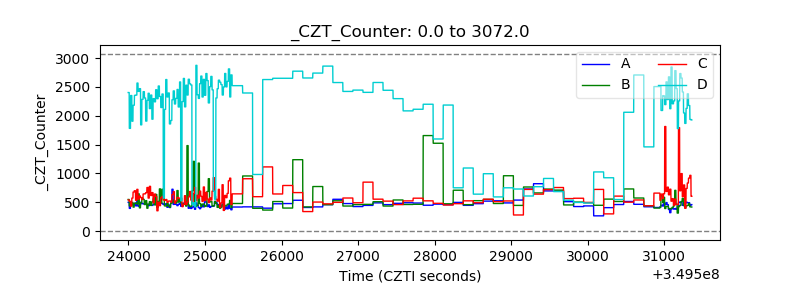 |
| +2.5 Volts monitor |  |
| +5 Volts monitor |  |
| _ROLL_ROT | 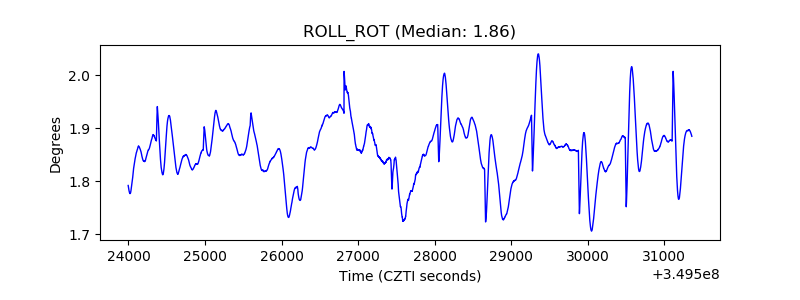 |
| _Roll_DEC | 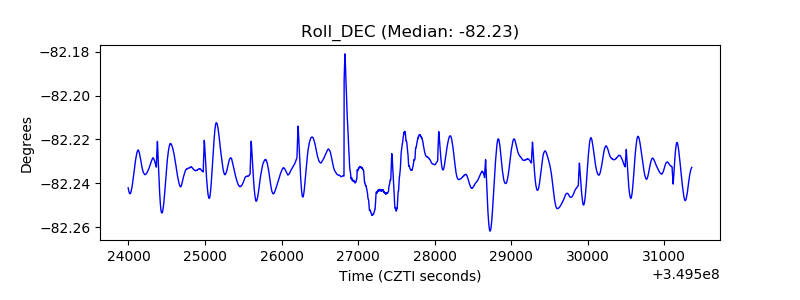 |
| _Roll_RA | 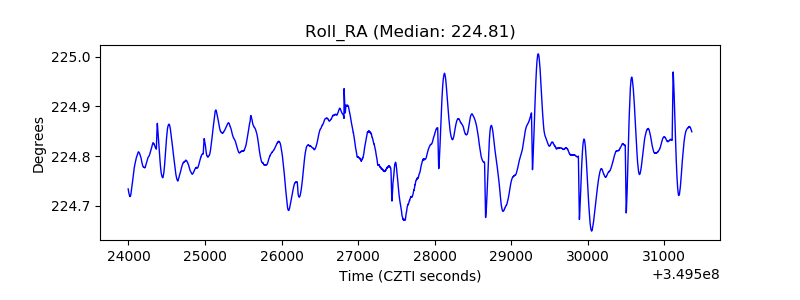 |
| Veto Counter | 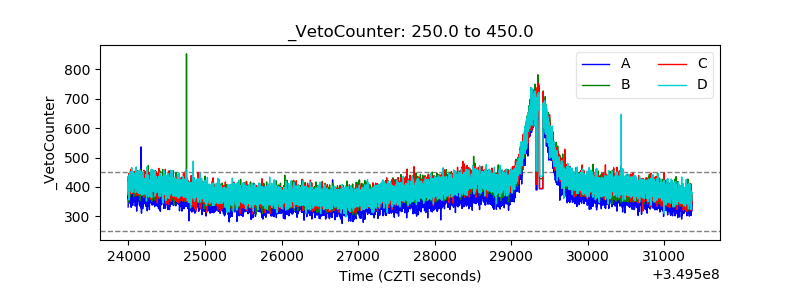 |