| Param | Original file | Final file |
|---|---|---|
| Filename | modeM0/AS1A10_103T08_9000004136_28857cztM0_level2.evt | modeM0/AS1A10_103T08_9000004136_28857cztM0_level2_quad_clean.evt |
| Size (bytes) | 1,885,392,000 | 314,570,880 |
| Size | 1.8 GB | 300.0 MB |
| Events in quadrant A | 9,427,782 | 2,202,978 |
| Events in quadrant B | 9,458,220 | 2,230,249 |
| Events in quadrant C | 12,419,517 | 2,109,088 |
| Events in quadrant D | 24,615,394 | 1,775,621 |
| Mode SS | |||
|---|---|---|---|
| Quadrant | BADHDUFLAG | Total packets | Discarded packets |
| A | 0 | 358 | 0 |
| B | 0 | 358 | 0 |
| C | 0 | 358 | 0 |
| D | 0 | 358 | 0 |
| Mode M9 | |||
|---|---|---|---|
| Quadrant | BADHDUFLAG | Total packets | Discarded packets |
| A | 0 | 18 | 0 |
| B | 0 | 18 | 0 |
| C | 0 | 18 | 0 |
| D | 0 | 18 | 0 |
| Mode M0 | |||
|---|---|---|---|
| Quadrant | BADHDUFLAG | Total packets | Discarded packets |
| A | 0 | 39816 | 3 |
| B | 0 | 39618 | 3 |
| C | 0 | 48752 | 3 |
| D | 0 | 85271 | 3 |
| Quadrant | Total seconds | Saturated seconds | Saturation percentage |
|---|---|---|---|
| A | 17516 | 515 | 2.940169% |
| B | 17517 | 550 | 3.139807% |
| C | 17517 | 646 | 3.687846% |
| D | 17517 | 5307 | 30.296284% |
Noise dominated data is calculated using 1-second bins in cleaned event files. If a bin has >2000 counts, and if more than 50% of those come from <1% of pixels, then it is considered to be noise-dominated and hence unusable.
| Quadrant | # 1 sec bins | Bins with >0 counts | Bins with >2000 counts | High rate bins dominated by noise | Noise dominated (total time) | Noise dominated (detector-on time) | Marked lightcurve |
|---|---|---|---|---|---|---|---|
| A | 19432 | 17516 | 274 | 274 | 1.41% | 1.56% | 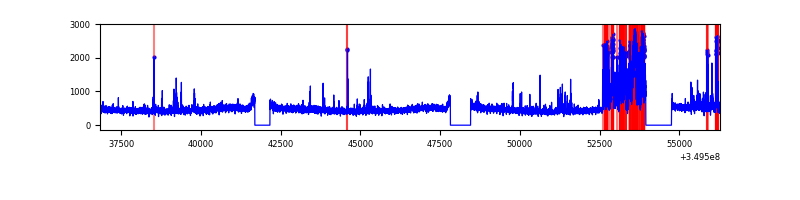 |
| B | 19433 | 17517 | 279 | 279 | 1.44% | 1.59% | 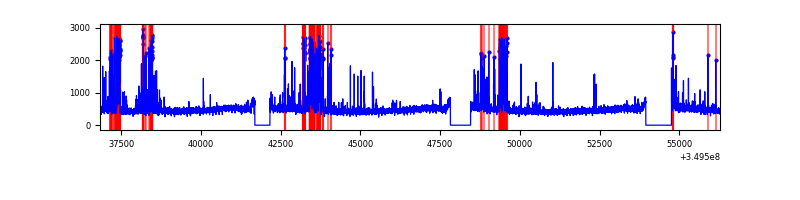 |
| C | 19433 | 17517 | 84 | 84 | 0.43% | 0.48% | 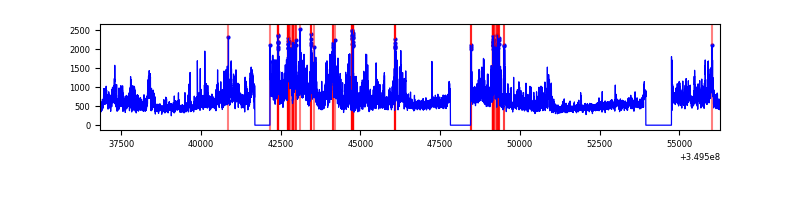 |
| D | 19433 | 17517 | 5224 | 5224 | 26.88% | 29.82% | 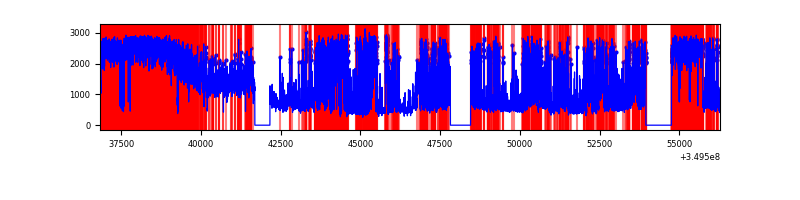 |
Top three noisy pixels from each quadrant. If the there are fewer than three noisy pixels in the level2.evt file, extra rows are filled as -1
| Pixel properties | Quadrant properties | ||||||
|---|---|---|---|---|---|---|---|
| Quadrant | DetID | PixID | Counts | Sigma | Mean | Median | Sigma |
| A | 14 | 235 | 1469738 | 3561.87 | 2051 | 2005 | 412.1 |
| A | 13 | 254 | 34288 | 78.34 | 2051 | 2005 | 412.1 |
| A | 15 | 174 | 27435 | 61.71 | 2051 | 2005 | 412.1 |
| B | 5 | 172 | 850343 | 2216.74 | 2044 | 1992 | 382.7 |
| B | 10 | 246 | 287468 | 745.95 | 2044 | 1992 | 382.7 |
| B | 5 | 255 | 227597 | 589.51 | 2044 | 1992 | 382.7 |
| C | 3 | 233 | 4384194 | 9614.9 | 1963 | 1973 | 455.8 |
| C | 14 | 238 | 332653 | 725.54 | 1963 | 1973 | 455.8 |
| C | 14 | 254 | 32320 | 66.58 | 1963 | 1973 | 455.8 |
| D | 8 | 195 | 8162725 | 19467.57 | 1760 | 1712 | 419.2 |
| D | 1 | 52 | 7787155 | 18571.67 | 1760 | 1712 | 419.2 |
| D | 7 | 80 | 950283 | 2262.75 | 1760 | 1712 | 419.2 |
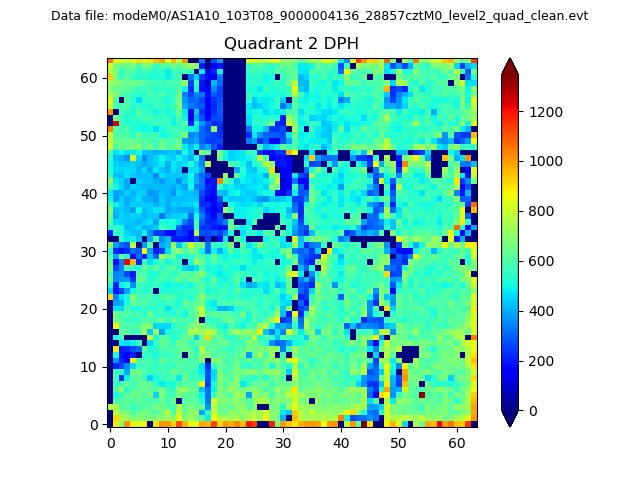
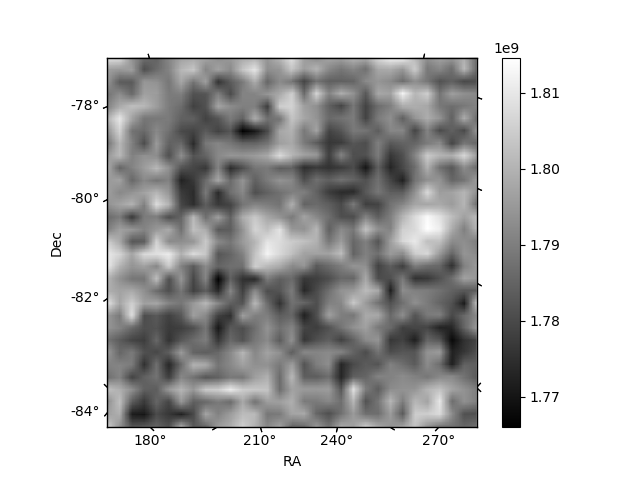
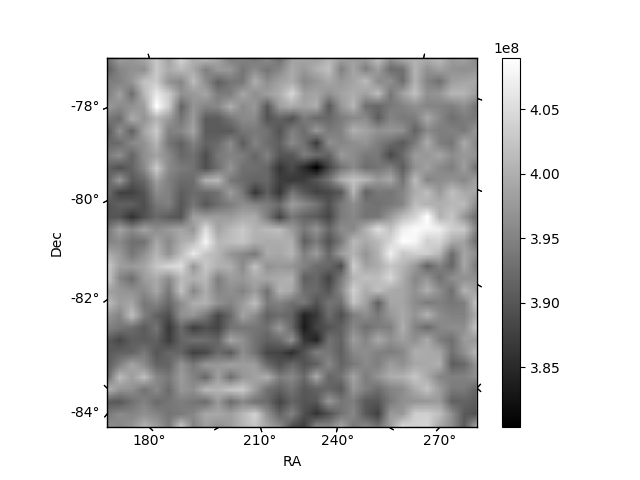
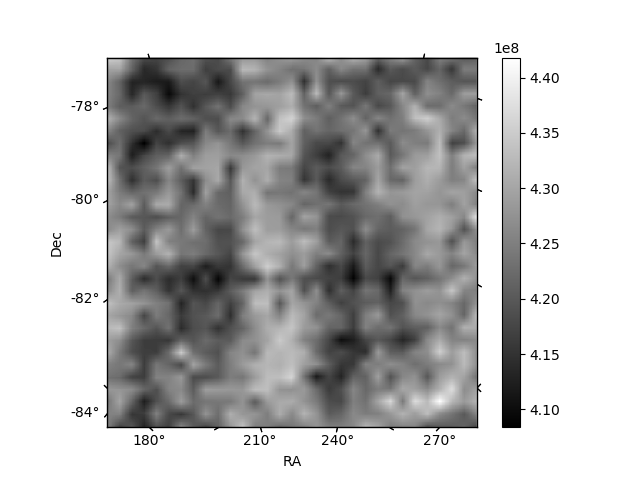
Histogram calculated using DETX and DETY for each event in the final _common_clean file
| Quadrant A | 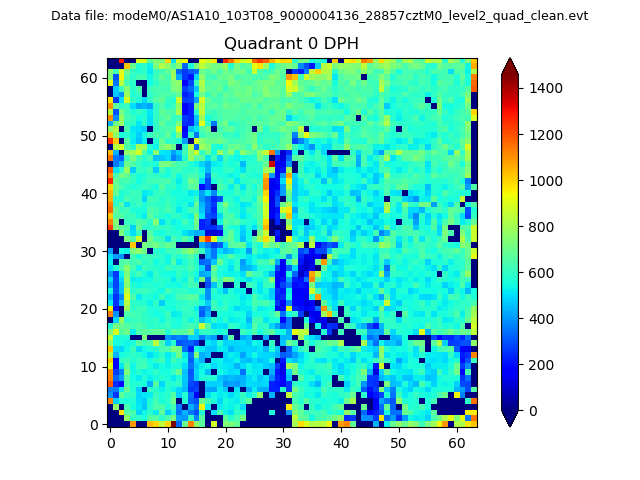 |
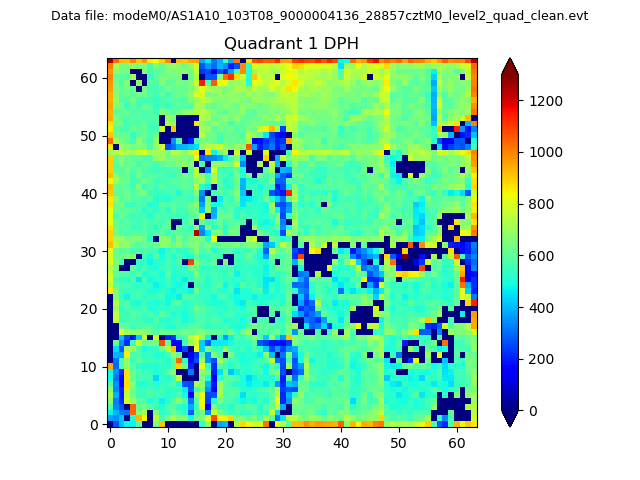 |
Quadrant B |
|---|---|---|---|
| Quadrant D | 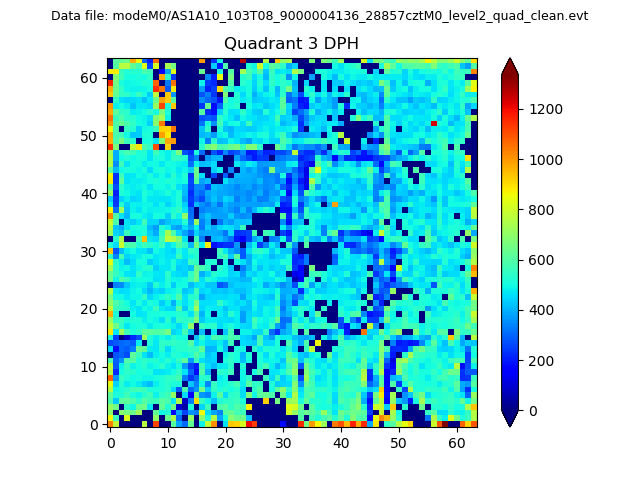 |
 |
Quadrant C |
| Plot type | Count rate plots | Images |
|---|---|---|
| Comparison with Poisson distribution Blue bars denote a histogram of data divided into 1 sec bins. Red curve is a Poisson curve with rate = median count rate of data. |
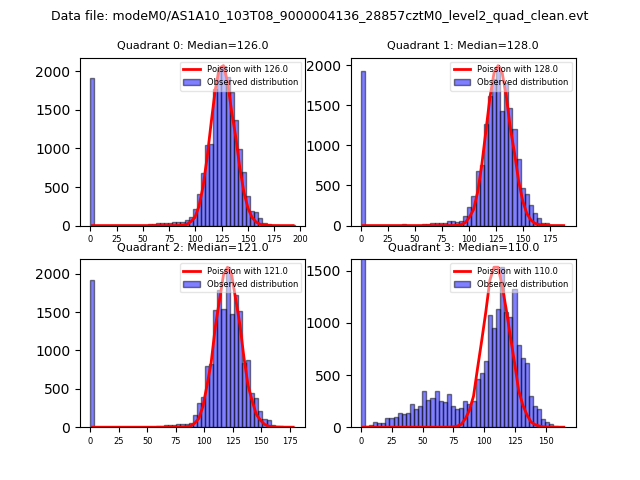 |
 |
| Quadrant-wise count rates Data is divided into 100 sec bins |
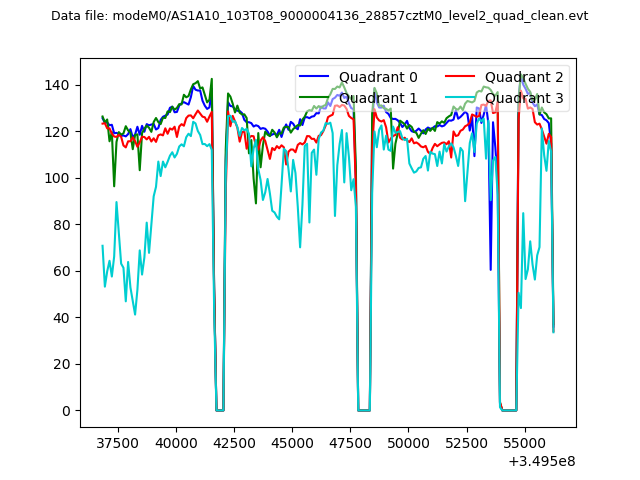 |
|
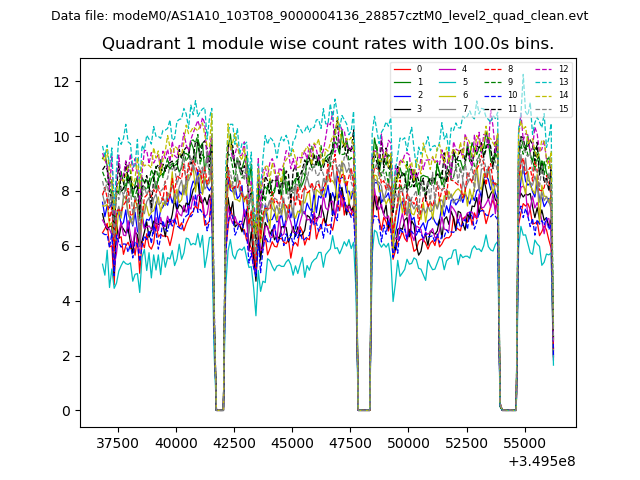
| Module-wise count rates for Quadrant A Data is divided into 100 sec bins |
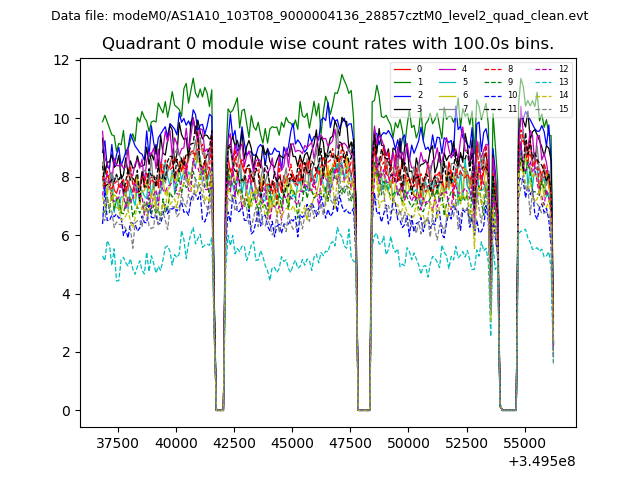 |
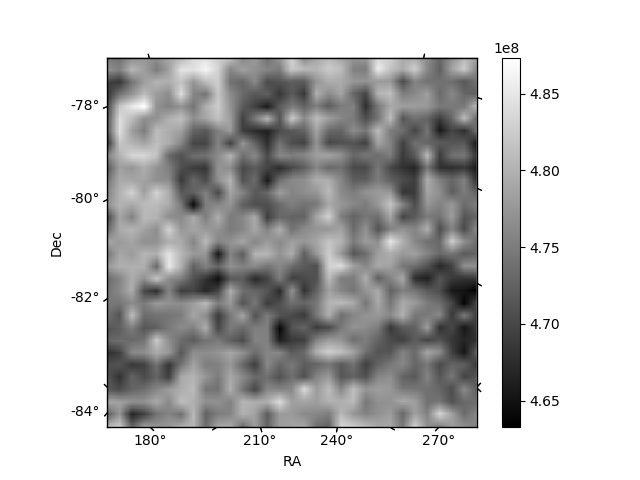 |
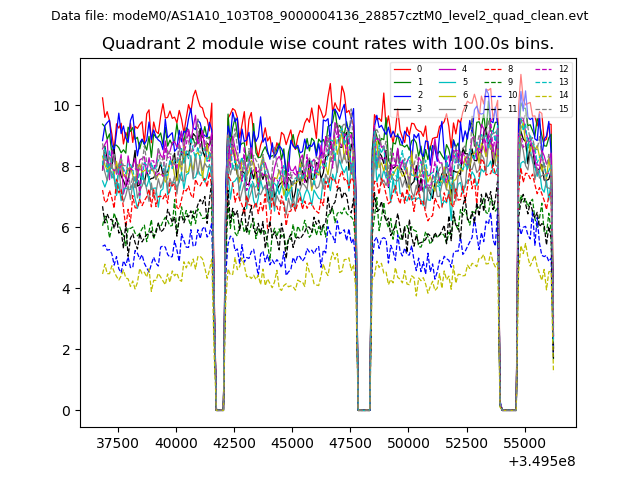
| Module-wise count rates for Quadrant B Data is divided into 100 sec bins |
 |
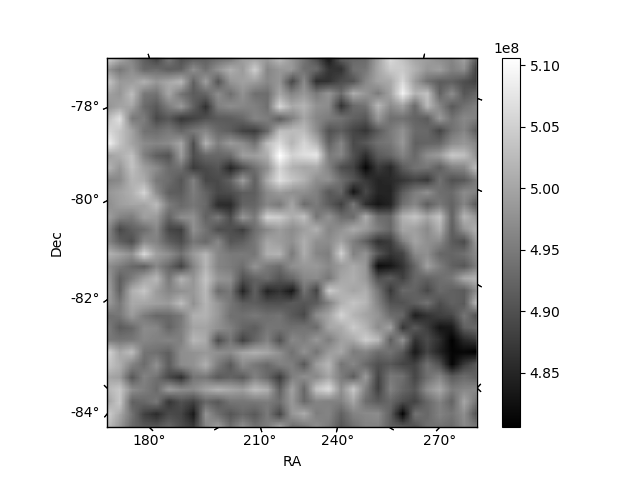 |
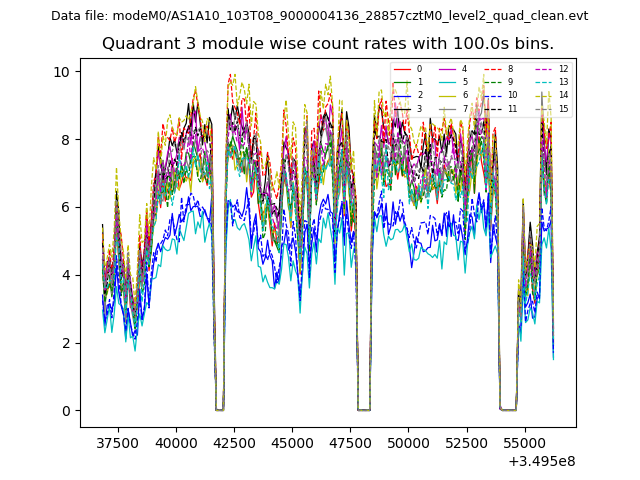
| Module-wise count rates for Quadrant C Data is divided into 100 sec bins |
 |
 |
| Module-wise count rates for Quadrant D Data is divided into 100 sec bins |
 |
 |
| Parameter | Plot |
|---|---|
| CZT HV Monitor | 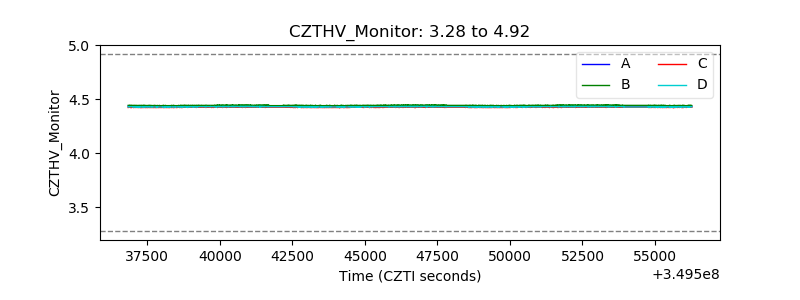 |
| D_VDD | 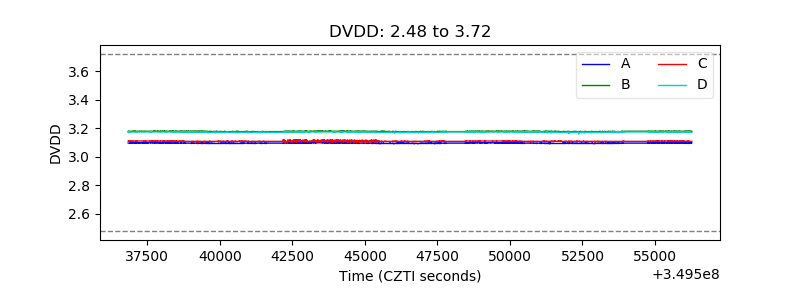 |
| Temperature 1 | 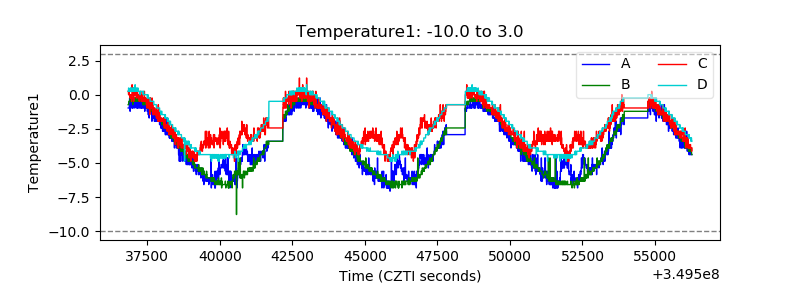 |
| Veto HV Monitor | 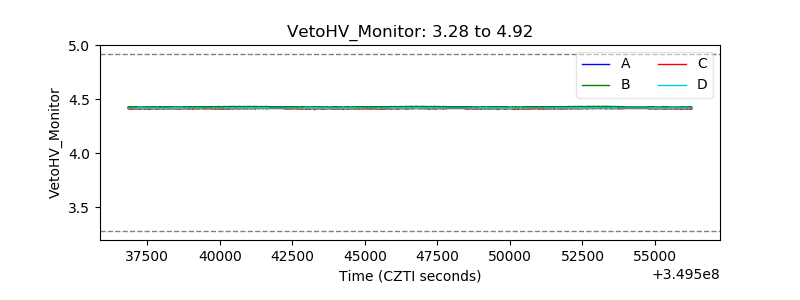 |
| Veto LLD | 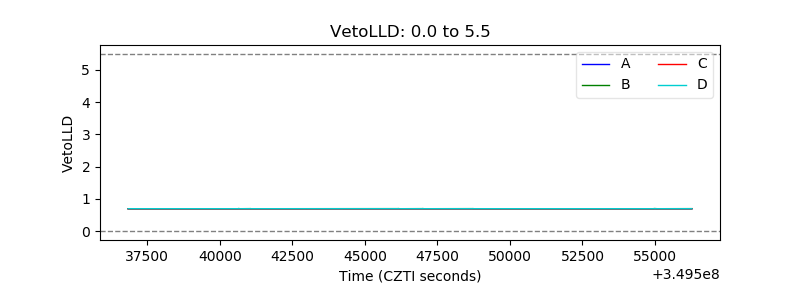 |
| Alpha Counter | 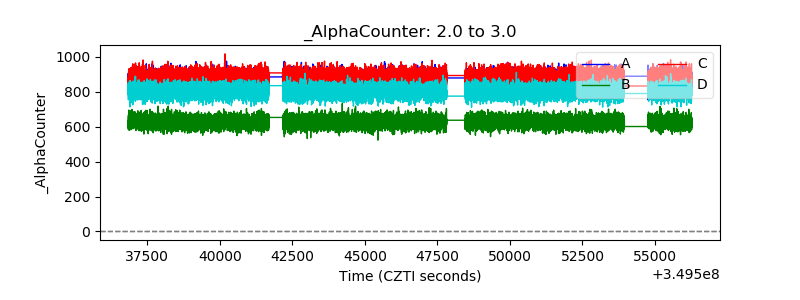 |
| _CPM_Rate | 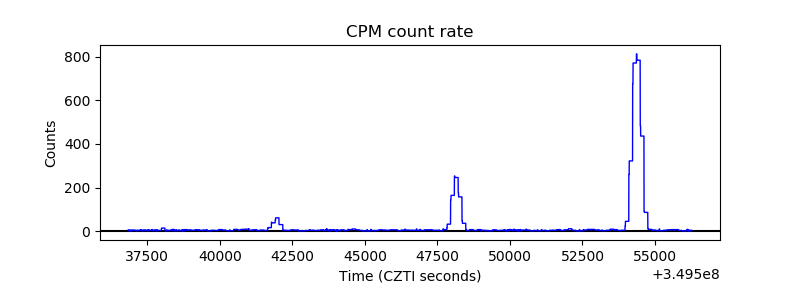 |
| CZT Counter | 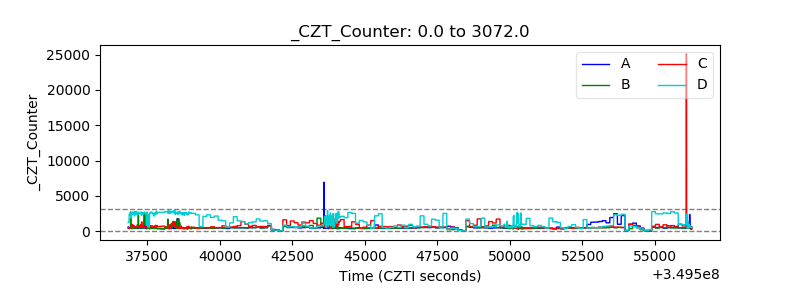 |
| +2.5 Volts monitor |  |
| +5 Volts monitor |  |
| _ROLL_ROT | 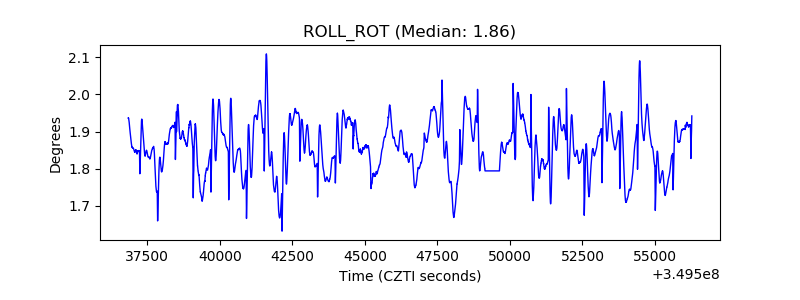 |
| _Roll_DEC | 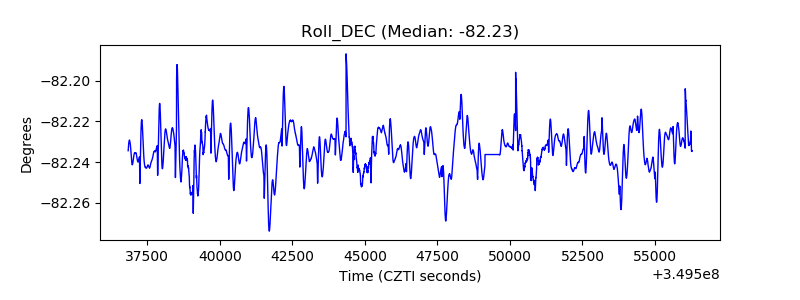 |
| _Roll_RA | 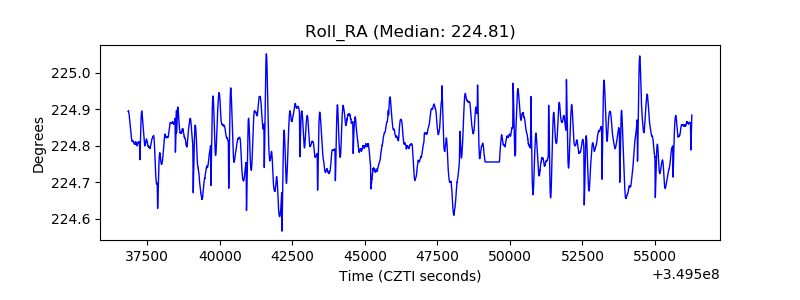 |
| Veto Counter | 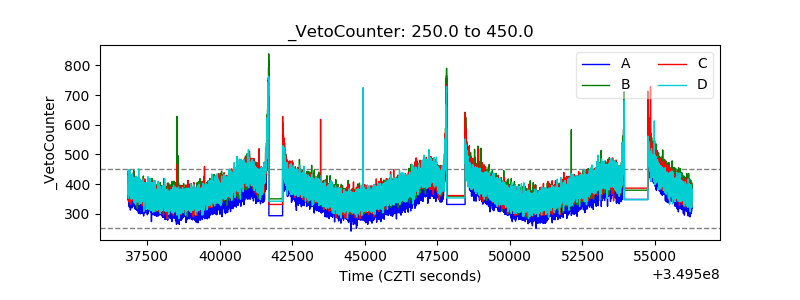 |