| Param | Original file | Final file |
|---|---|---|
| Filename | modeM0/AS1A10_103T08_9000004136_28858cztM0_level2.evt | modeM0/AS1A10_103T08_9000004136_28858cztM0_level2_quad_clean.evt |
| Size (bytes) | 694,330,560 | 121,916,160 |
| Size | 662.2 MB | 116.3 MB |
| Events in quadrant A | 3,685,807 | 874,469 |
| Events in quadrant B | 3,589,160 | 875,562 |
| Events in quadrant C | 3,913,259 | 834,795 |
| Events in quadrant D | 9,388,114 | 641,470 |
| Mode SS | |||
|---|---|---|---|
| Quadrant | BADHDUFLAG | Total packets | Discarded packets |
| A | 0 | 136 | 0 |
| B | 0 | 136 | 0 |
| C | 0 | 136 | 0 |
| D | 0 | 136 | 0 |
| Mode M9 | |||
|---|---|---|---|
| Quadrant | BADHDUFLAG | Total packets | Discarded packets |
| A | 0 | 10 | 0 |
| B | 0 | 10 | 0 |
| C | 0 | 10 | 0 |
| D | 0 | 10 | 0 |
| Mode M0 | |||
|---|---|---|---|
| Quadrant | BADHDUFLAG | Total packets | Discarded packets |
| A | 0 | 15133 | 1 |
| B | 0 | 15034 | 1 |
| C | 0 | 15973 | 1 |
| D | 0 | 32371 | 1 |
| Quadrant | Total seconds | Saturated seconds | Saturation percentage |
|---|---|---|---|
| A | 6668 | 51 | 0.764847% |
| B | 6668 | 201 | 3.014397% |
| C | 6669 | 97 | 1.454491% |
| D | 6669 | 2565 | 38.461538% |
Noise dominated data is calculated using 1-second bins in cleaned event files. If a bin has >2000 counts, and if more than 50% of those come from <1% of pixels, then it is considered to be noise-dominated and hence unusable.
| Quadrant | # 1 sec bins | Bins with >0 counts | Bins with >2000 counts | High rate bins dominated by noise | Noise dominated (total time) | Noise dominated (detector-on time) | Marked lightcurve |
|---|---|---|---|---|---|---|---|
| A | 7648 | 6668 | 34 | 34 | 0.44% | 0.51% |  |
| B | 7648 | 6668 | 112 | 112 | 1.46% | 1.68% |  |
| C | 7649 | 6669 | 4 | 4 | 0.05% | 0.06% | 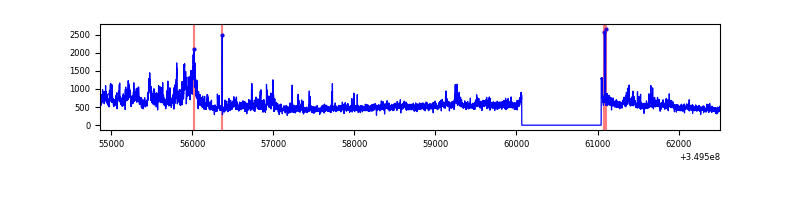 |
| D | 7648 | 6668 | 2512 | 2512 | 32.85% | 37.67% | 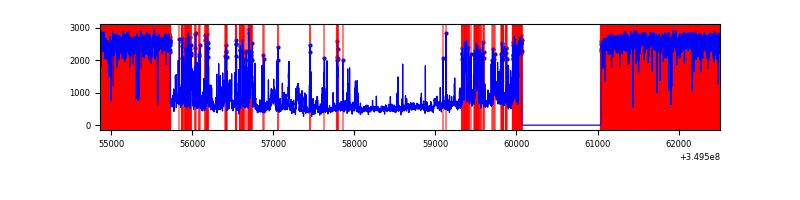 |
Top three noisy pixels from each quadrant. If the there are fewer than three noisy pixels in the level2.evt file, extra rows are filled as -1
| Pixel properties | Quadrant properties | ||||||
|---|---|---|---|---|---|---|---|
| Quadrant | DetID | PixID | Counts | Sigma | Mean | Median | Sigma |
| A | 14 | 235 | 599168 | 3744.89 | 798 | 783 | 159.8 |
| A | 13 | 254 | 12442 | 72.97 | 798 | 783 | 159.8 |
| A | 15 | 174 | 8047 | 45.46 | 798 | 783 | 159.8 |
| B | 5 | 172 | 361814 | 2417.1 | 786 | 768 | 149.4 |
| B | 5 | 255 | 77767 | 515.49 | 786 | 768 | 149.4 |
| B | 0 | 244 | 33103 | 216.47 | 786 | 768 | 149.4 |
| C | 3 | 233 | 805844 | 4555.71 | 756 | 759 | 176.7 |
| C | 14 | 238 | 124575 | 700.63 | 756 | 759 | 176.7 |
| C | 0 | 207 | 14687 | 78.81 | 756 | 759 | 176.7 |
| D | 8 | 195 | 4086823 | 27141.2 | 623 | 603 | 150.6 |
| D | 1 | 52 | 2581941 | 17145.58 | 623 | 603 | 150.6 |
| D | 7 | 80 | 164494 | 1088.59 | 623 | 603 | 150.6 |
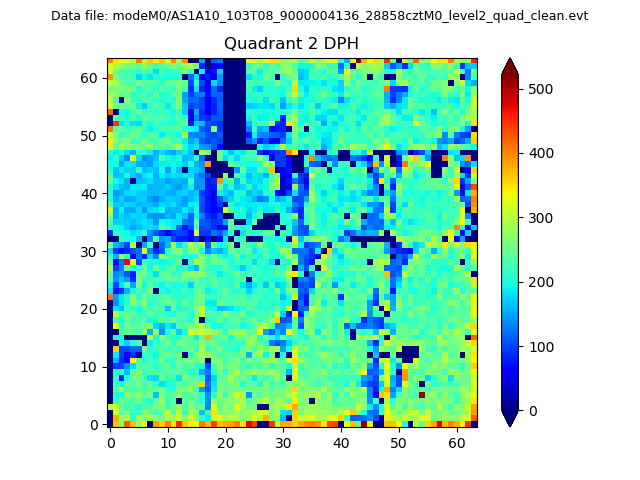
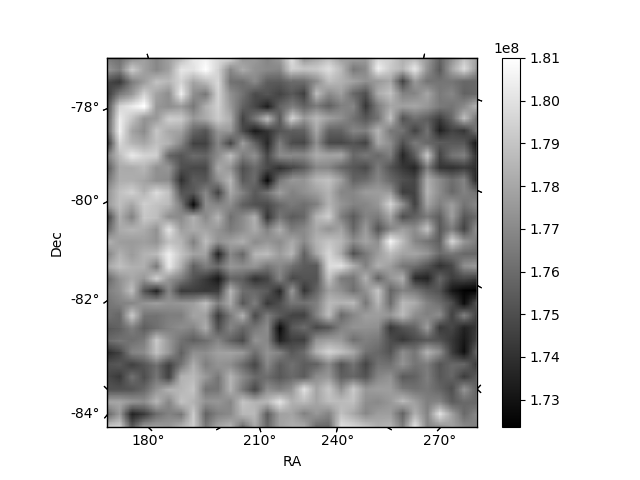
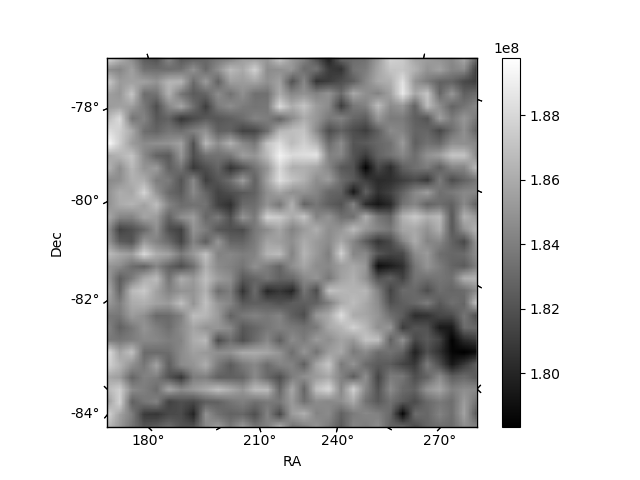
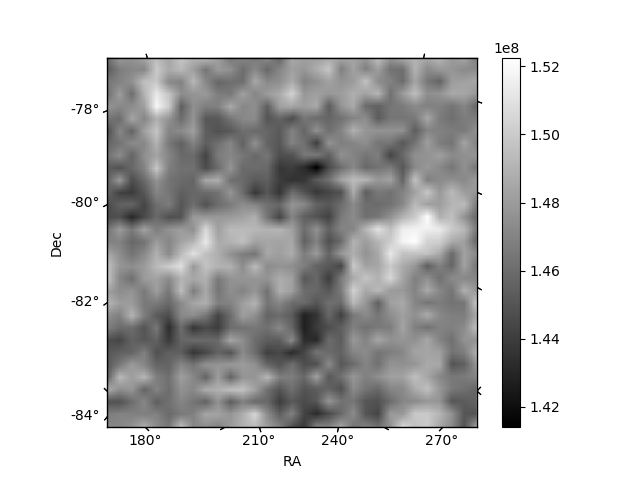
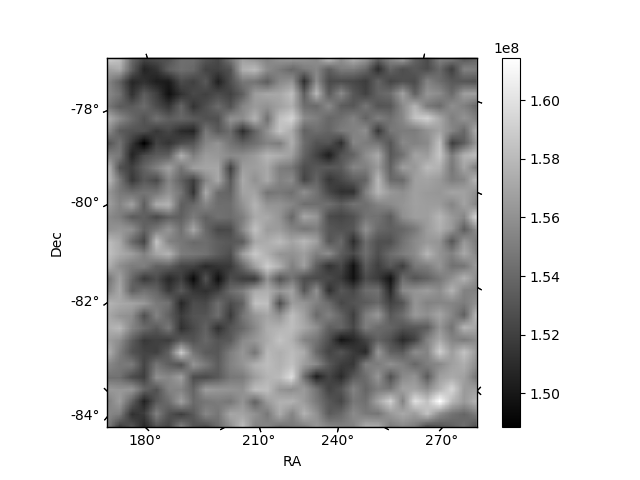
Histogram calculated using DETX and DETY for each event in the final _common_clean file
| Quadrant A | 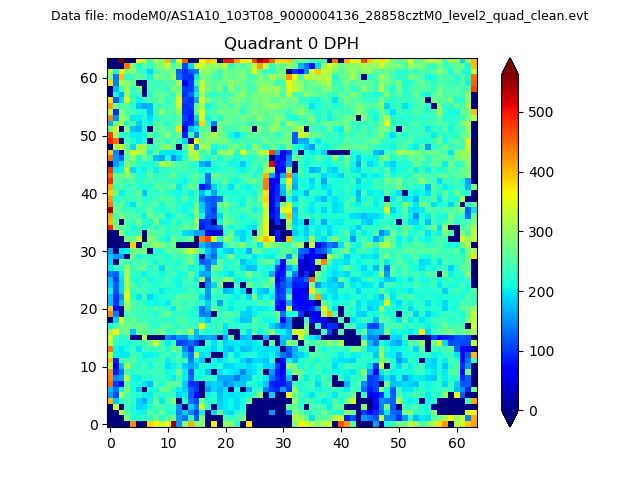 |
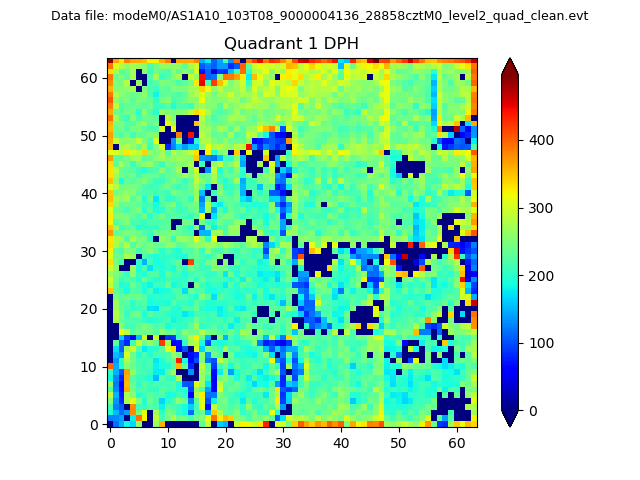 |
Quadrant B |
|---|---|---|---|
| Quadrant D | 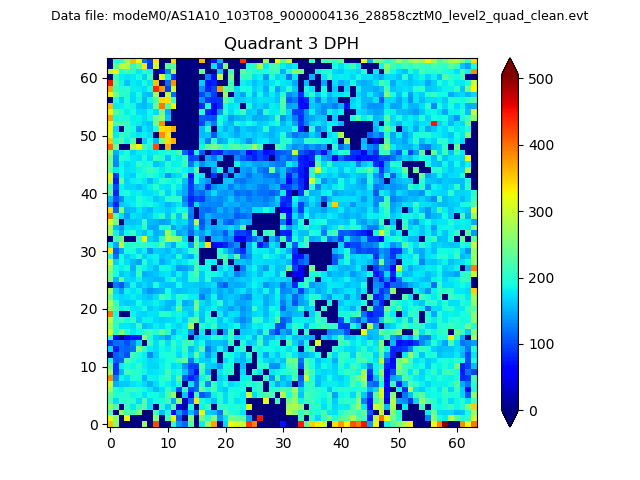 |
 |
Quadrant C |
| Plot type | Count rate plots | Images |
|---|---|---|
| Comparison with Poisson distribution Blue bars denote a histogram of data divided into 1 sec bins. Red curve is a Poisson curve with rate = median count rate of data. |
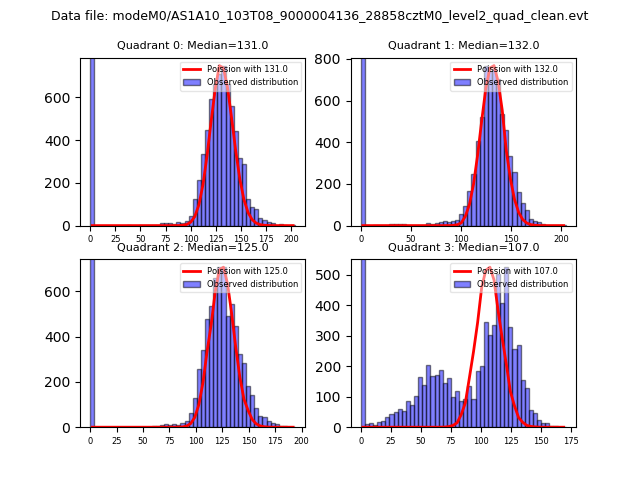 |
 |
| Quadrant-wise count rates Data is divided into 100 sec bins |
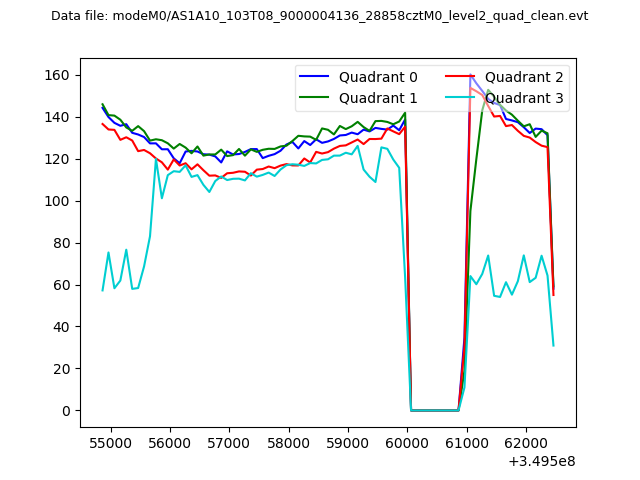 |
|
| Module-wise count rates for Quadrant A Data is divided into 100 sec bins |
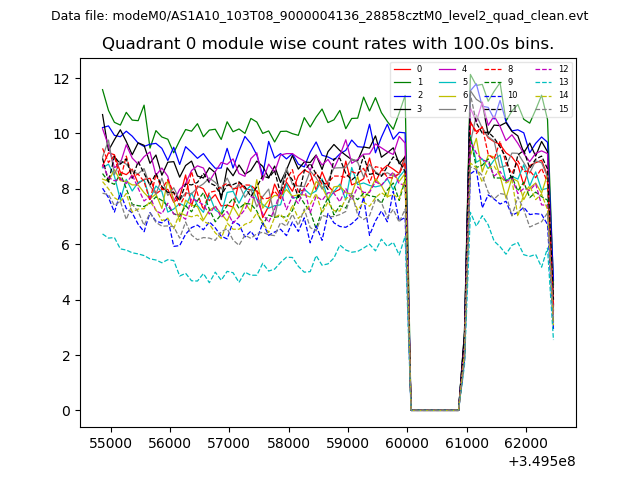 |
 |
| Module-wise count rates for Quadrant B Data is divided into 100 sec bins |
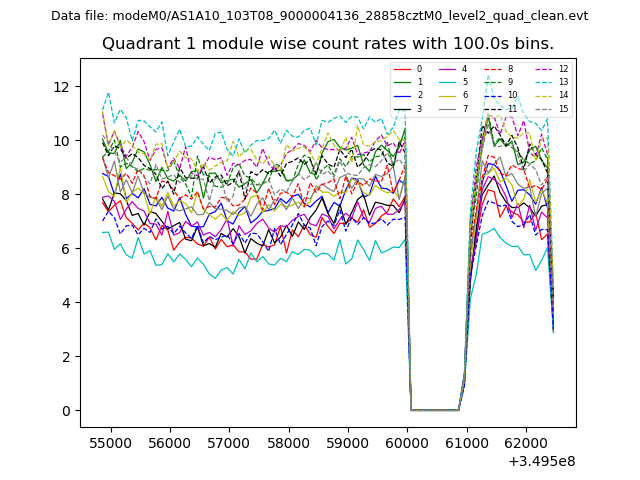 |
 |
| Module-wise count rates for Quadrant C Data is divided into 100 sec bins |
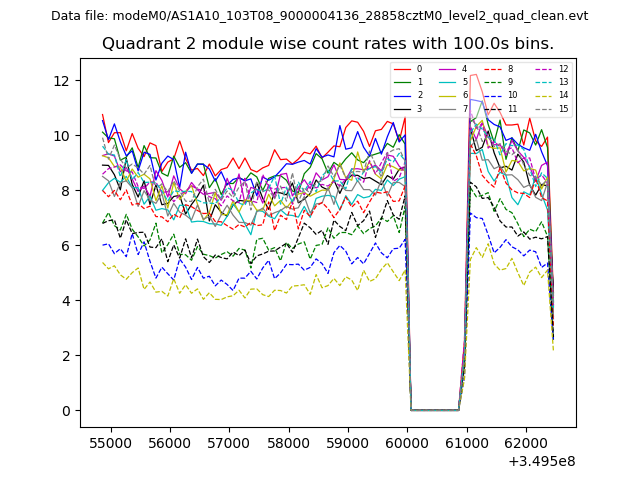 |
 |
| Module-wise count rates for Quadrant D Data is divided into 100 sec bins |
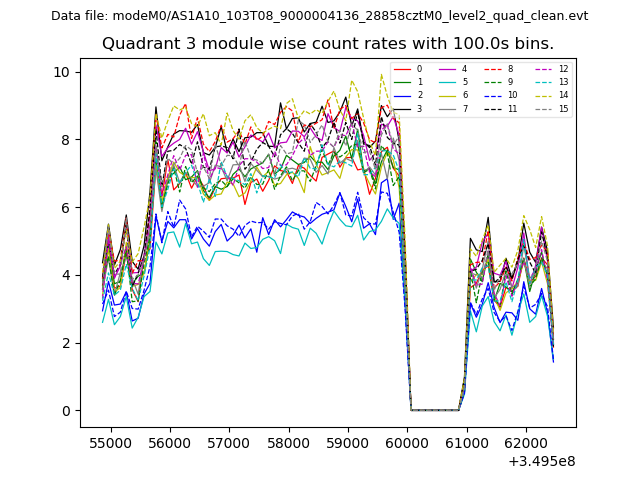 |
 |
| Parameter | Plot |
|---|---|
| CZT HV Monitor | 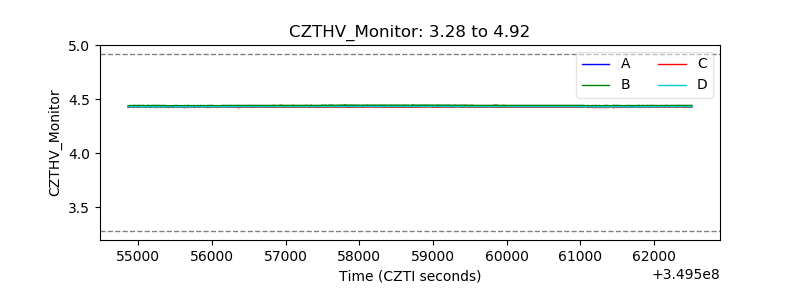 |
| D_VDD | 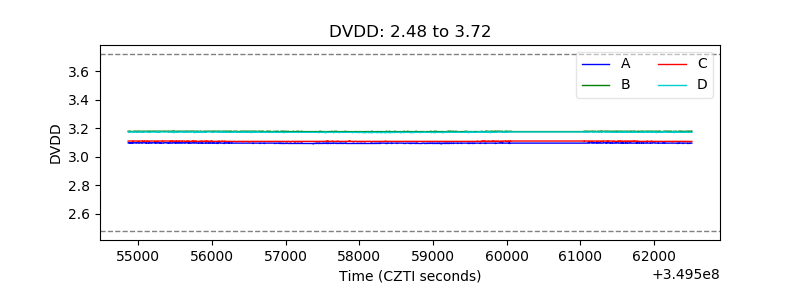 |
| Temperature 1 | 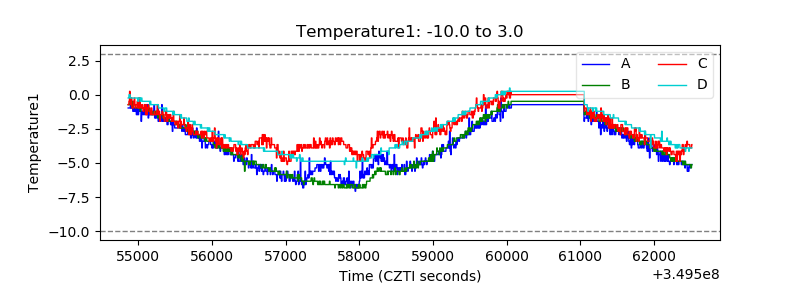 |
| Veto HV Monitor | 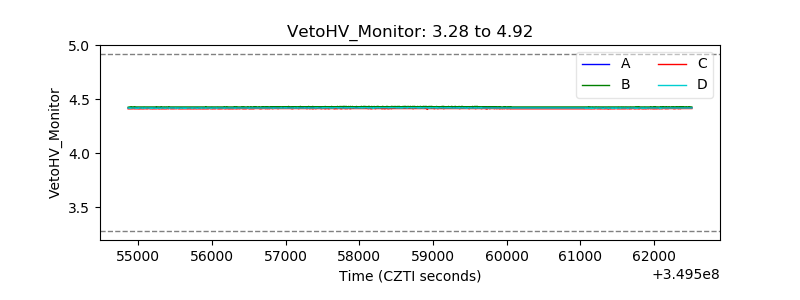 |
| Veto LLD | 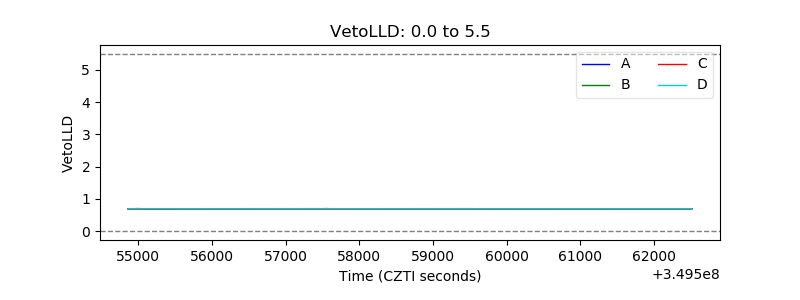 |
| Alpha Counter | 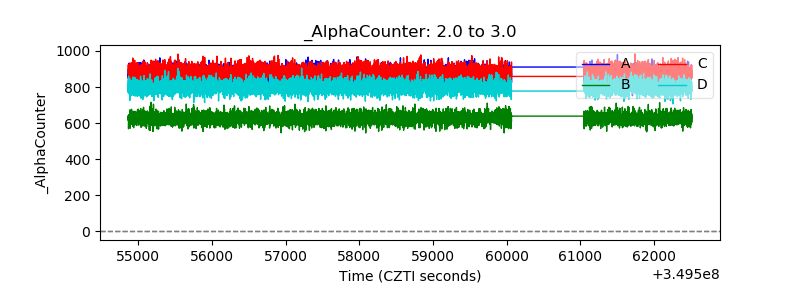 |
| _CPM_Rate | 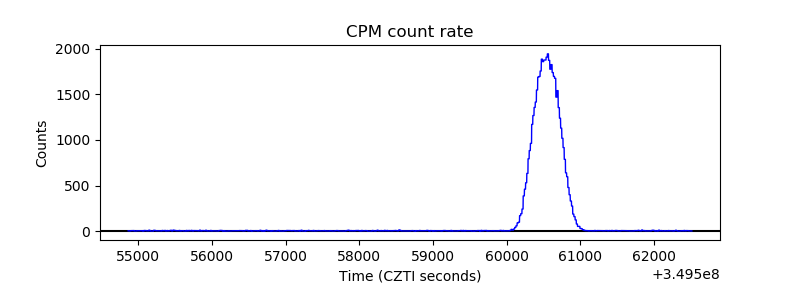 |
| CZT Counter | 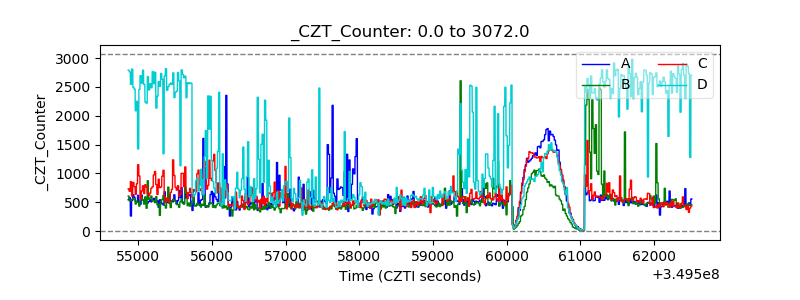 |
| +2.5 Volts monitor |  |
| +5 Volts monitor |  |
| _ROLL_ROT | 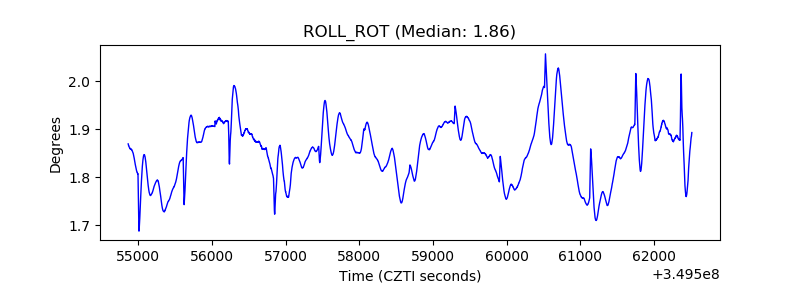 |
| _Roll_DEC | 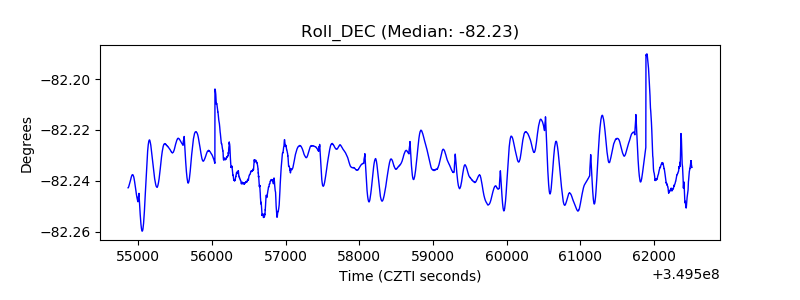 |
| _Roll_RA | 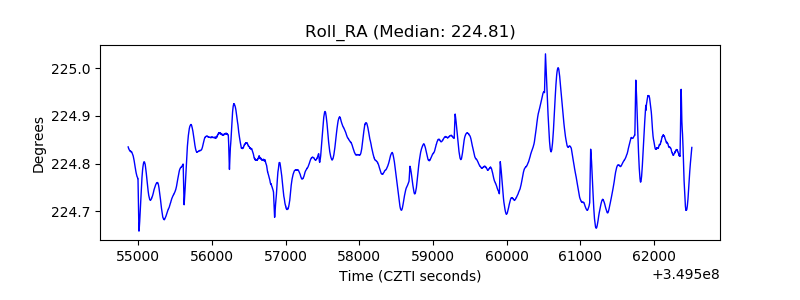 |
| Veto Counter | 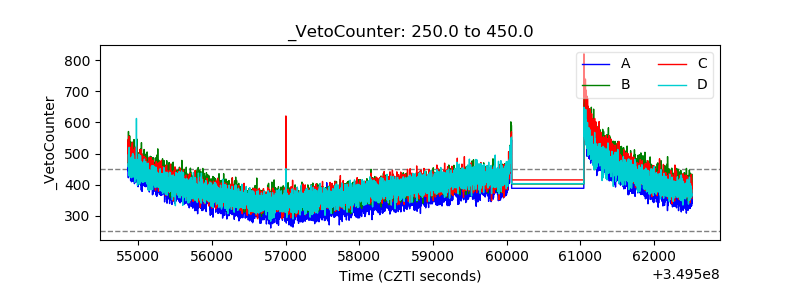 |