| Param | Original file | Final file |
|---|---|---|
| Filename | modeM0/AS1A10_123T06_9000004138cztM0_level2.fits | modeM0/AS1A10_123T06_9000004138cztM0_level2_quad_clean.evt |
| Size (bytes) | 504,754,560 | 404,179,200 |
| Size | 481.4 MB | 385.5 MB |
| Events in quadrant A | 3,175,884 | 2,309,839 |
| Events in quadrant B | 3,016,044 | 2,318,658 |
| Events in quadrant C | 3,081,018 | 2,208,867 |
| Events in quadrant D | 2,424,268 | 1,819,438 |
| Mode M0 | |||
|---|---|---|---|
| Quadrant | BADHDUFLAG | Total packets | Discarded packets |
| A | 0 | 113713 | 0 |
| B | 0 | 115154 | 0 |
| C | 0 | 119876 | 0 |
| D | 0 | 245755 | 0 |
| Mode SS | |||
|---|---|---|---|
| Quadrant | BADHDUFLAG | Total packets | Discarded packets |
| A | 0 | 1060 | 0 |
| B | 0 | 1060 | 0 |
| C | 0 | 1062 | 0 |
| D | 0 | 1058 | 0 |
| Mode M9 | |||
|---|---|---|---|
| Quadrant | BADHDUFLAG | Total packets | Discarded packets |
| A | 0 | 80 | 0 |
| B | 0 | 80 | 0 |
| C | 0 | 81 | 0 |
| D | 0 | 81 | 0 |
| Quadrant | Total seconds | Saturated seconds | Saturation percentage |
|---|---|---|---|
| A | 52211 | 950 | 1.819540% |
| B | 52228 | 1679 | 3.214751% |
| C | 52208 | 1508 | 2.888446% |
| D | 52195 | 14067 | 26.950857% |
Noise dominated data is calculated using 1-second bins in cleaned event files. If a bin has >2000 counts, and if more than 50% of those come from <1% of pixels, then it is considered to be noise-dominated and hence unusable.
| Quadrant | # 1 sec bins | Bins with >0 counts | Bins with >2000 counts | High rate bins dominated by noise | Noise dominated (total time) | Noise dominated (detector-on time) | Marked lightcurve |
|---|---|---|---|---|---|---|---|
| A | 63966 | 52228 | 0 | 0 | 0.00% | 0.00% |  |
| B | 63966 | 52088 | 0 | 0 | 0.00% | 0.00% |  |
| C | 63965 | 52218 | 0 | 0 | 0.00% | 0.00% |  |
| D | 63965 | 52182 | 0 | 0 | 0.00% | 0.00% |  |
Top three noisy pixels from each quadrant. If the there are fewer than three noisy pixels in the level2.evt file, extra rows are filled as -1
| Pixel properties | Quadrant properties | ||||||
|---|---|---|---|---|---|---|---|
| Quadrant | DetID | PixID | Counts | Sigma | Mean | Median | Sigma |
| A | 0 | 29 | 3055 | 11.2 | 828 | 780 | 203.2 |
| A | 7 | 110 | 2483 | 8.38 | 828 | 780 | 203.2 |
| A | 9 | 19 | 2407 | 8.01 | 828 | 780 | 203.2 |
| B | 2 | 9 | 2438 | 10.63 | 798 | 764 | 157.6 |
| B | 5 | 128 | 2043 | 8.12 | 798 | 764 | 157.6 |
| B | 2 | 8 | 2040 | 8.1 | 798 | 764 | 157.6 |
| C | 1 | 81 | 2399 | 8.04 | 813 | 762 | 203.6 |
| C | 1 | 80 | 2357 | 7.83 | 813 | 762 | 203.6 |
| C | 3 | 187 | 2150 | 6.82 | 813 | 762 | 203.6 |
| D | 3 | 14 | 1783 | 6.21 | 692 | 629 | 185.7 |
| D | 15 | 46 | 1782 | 6.21 | 692 | 629 | 185.7 |
| D | 6 | 67 | 1721 | 5.88 | 692 | 629 | 185.7 |
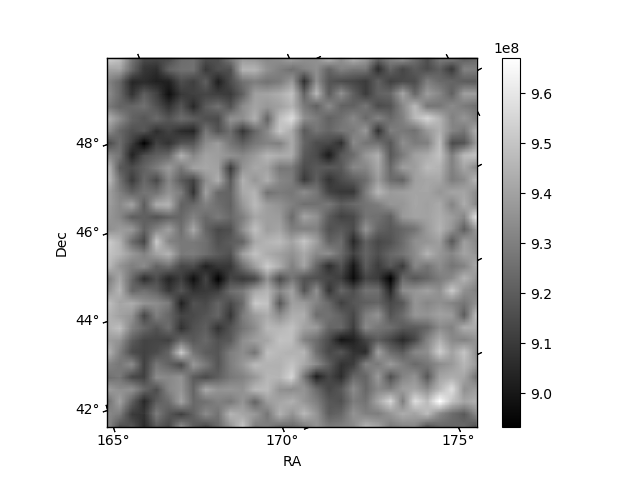
Histogram calculated using DETX and DETY for each event in the final _common_clean file
| Quadrant A | 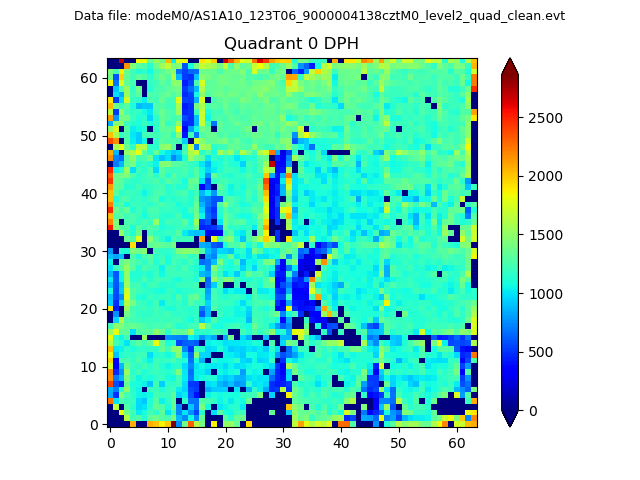 |
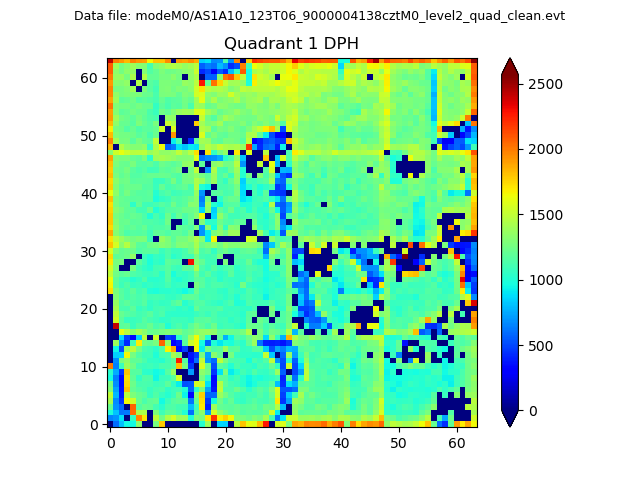 |
Quadrant B |
|---|---|---|---|
| Quadrant D | 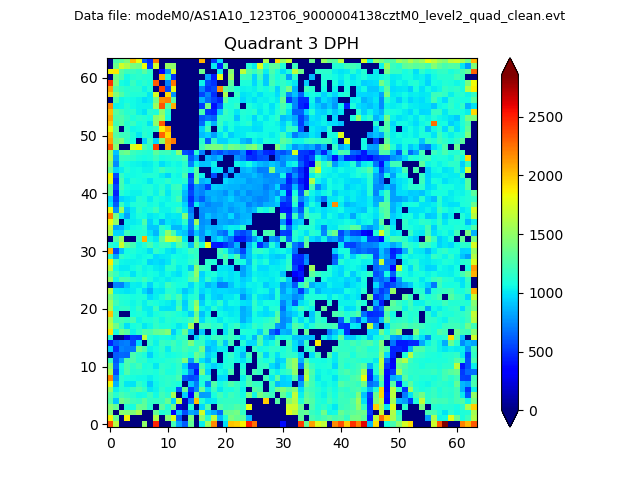 |
 |
Quadrant C |
| Plot type | Count rate plots | Images |
|---|---|---|
| Comparison with Poisson distribution Blue bars denote a histogram of data divided into 1 sec bins. Red curve is a Poisson curve with rate = median count rate of data. |
 |
 |
| Quadrant-wise count rates Data is divided into 100 sec bins |
 |
|
| Module-wise count rates for Quadrant A Data is divided into 100 sec bins |
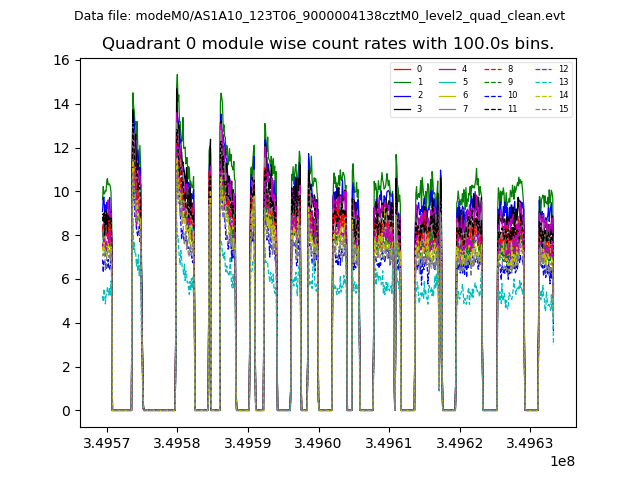 |
 |
| Module-wise count rates for Quadrant B Data is divided into 100 sec bins |
 |
 |
| Module-wise count rates for Quadrant C Data is divided into 100 sec bins |
 |
 |
| Module-wise count rates for Quadrant D Data is divided into 100 sec bins |
 |
 |
| Parameter | Plot |
|---|---|
| CZT HV Monitor |  |
| D_VDD | 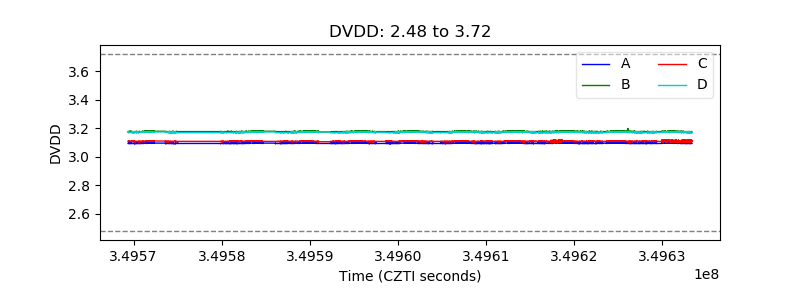 |
| Temperature 1 |  |
| Veto HV Monitor |  |
| Veto LLD |  |
| Alpha Counter |  |
| _CPM_Rate |  |
| CZT Counter |  |
| +2.5 Volts monitor |  |
| +5 Volts monitor |  |
| _ROLL_ROT | 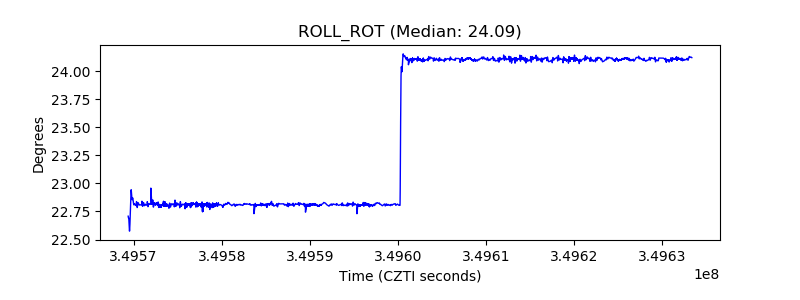 |
| _Roll_DEC | 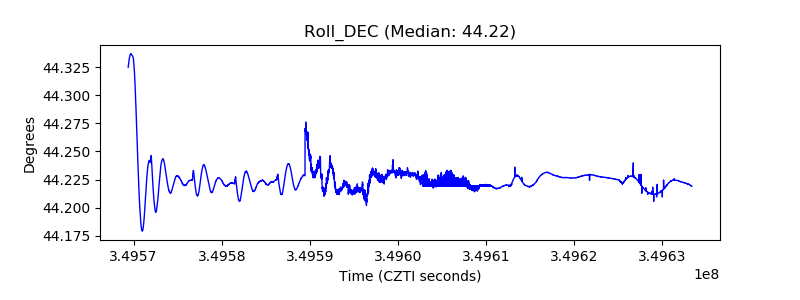 |
| _Roll_RA |  |
| Veto Counter |  |