| Param | Original file | Final file |
|---|---|---|
| Filename | modeM0/AS1A10_123T06_9000004138_28863cztM0_level2.evt | modeM0/AS1A10_123T06_9000004138_28863cztM0_level2_quad_clean.evt |
| Size (bytes) | 727,223,040 | 83,246,400 |
| Size | 693.5 MB | 79.4 MB |
| Events in quadrant A | 3,061,951 | 568,249 |
| Events in quadrant B | 3,176,439 | 585,484 |
| Events in quadrant C | 2,963,125 | 550,874 |
| Events in quadrant D | 12,434,073 | 413,800 |
| Mode M0 | |||
|---|---|---|---|
| Quadrant | BADHDUFLAG | Total packets | Discarded packets |
| A | 0 | 12587 | 1 |
| B | 0 | 12874 | 1 |
| C | 0 | 12219 | 1 |
| D | 0 | 40821 | 5 |
| Mode SS | |||
|---|---|---|---|
| Quadrant | BADHDUFLAG | Total packets | Discarded packets |
| A | 0 | 118 | 0 |
| B | 0 | 118 | 0 |
| C | 0 | 118 | 0 |
| D | 0 | 118 | 0 |
| Mode M9 | |||
|---|---|---|---|
| Quadrant | BADHDUFLAG | Total packets | Discarded packets |
| A | 0 | 13 | 0 |
| B | 0 | 13 | 0 |
| C | 0 | 13 | 0 |
| D | 0 | 13 | 0 |
| Quadrant | Total seconds | Saturated seconds | Saturation percentage |
|---|---|---|---|
| A | 5733 | 54 | 0.941915% |
| B | 5734 | 128 | 2.232299% |
| C | 5734 | 121 | 2.110220% |
| D | 5733 | 4142 | 72.248387% |
Noise dominated data is calculated using 1-second bins in cleaned event files. If a bin has >2000 counts, and if more than 50% of those come from <1% of pixels, then it is considered to be noise-dominated and hence unusable.
| Quadrant | # 1 sec bins | Bins with >0 counts | Bins with >2000 counts | High rate bins dominated by noise | Noise dominated (total time) | Noise dominated (detector-on time) | Marked lightcurve |
|---|---|---|---|---|---|---|---|
| A | 7043 | 5733 | 0 | 0 | 0.00% | 0.00% | 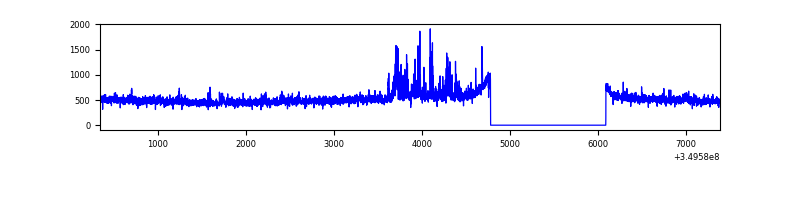 |
| B | 7044 | 5734 | 54 | 54 | 0.77% | 0.94% | 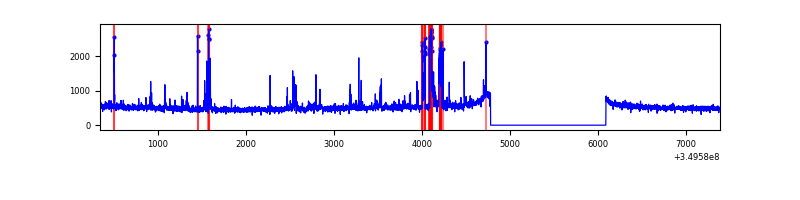 |
| C | 7044 | 5734 | 0 | 0 | 0.00% | 0.00% | 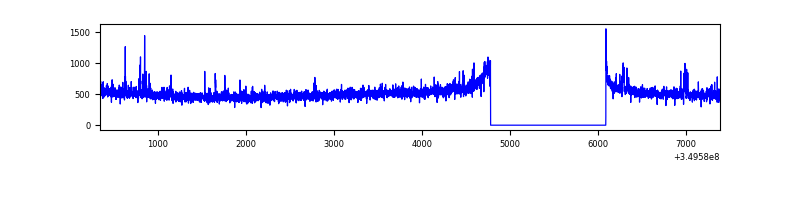 |
| D | 7042 | 5732 | 4781 | 4781 | 67.89% | 83.41% | 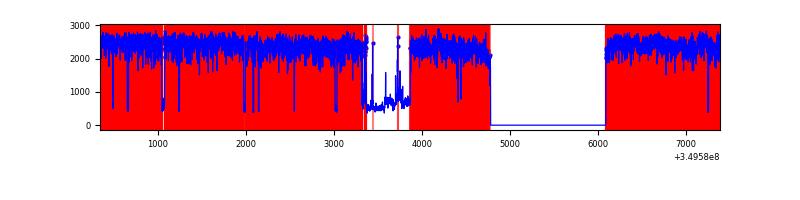 |
Top three noisy pixels from each quadrant. If the there are fewer than three noisy pixels in the level2.evt file, extra rows are filled as -1
| Pixel properties | Quadrant properties | ||||||
|---|---|---|---|---|---|---|---|
| Quadrant | DetID | PixID | Counts | Sigma | Mean | Median | Sigma |
| A | 14 | 235 | 178935 | 1205.62 | 744 | 733 | 147.8 |
| A | 13 | 254 | 10733 | 67.65 | 744 | 733 | 147.8 |
| A | 1 | 113 | 8807 | 54.62 | 744 | 733 | 147.8 |
| B | 5 | 255 | 188821 | 1372.76 | 736 | 722 | 137.0 |
| B | 15 | 32 | 75281 | 544.14 | 736 | 722 | 137.0 |
| B | 10 | 246 | 23880 | 169.01 | 736 | 722 | 137.0 |
| C | 14 | 238 | 132399 | 808.37 | 705 | 711 | 162.9 |
| C | 4 | 254 | 26150 | 156.16 | 705 | 711 | 162.9 |
| C | 3 | 233 | 25196 | 150.3 | 705 | 711 | 162.9 |
| D | 8 | 195 | 9707158 | 68682.11 | 594 | 579 | 141.3 |
| D | 1 | 52 | 420754 | 2973.09 | 594 | 579 | 141.3 |
| D | 7 | 80 | 39242 | 273.57 | 594 | 579 | 141.3 |
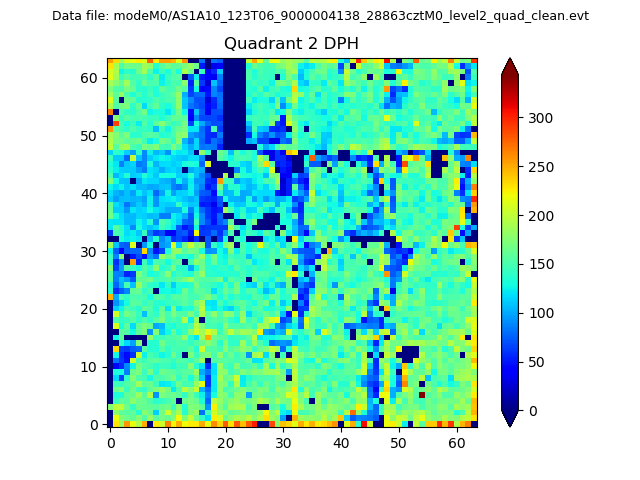
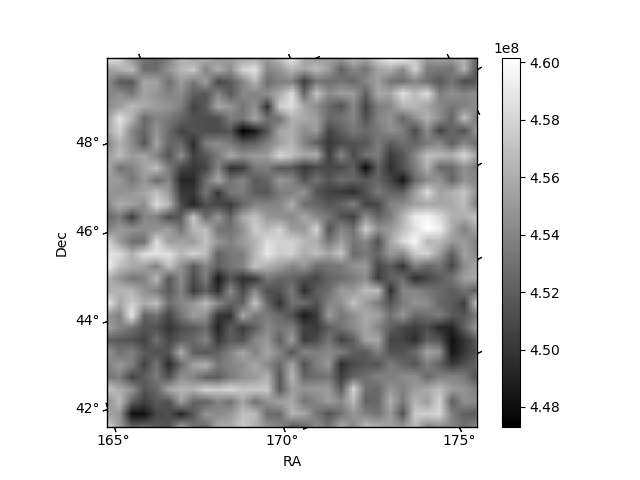
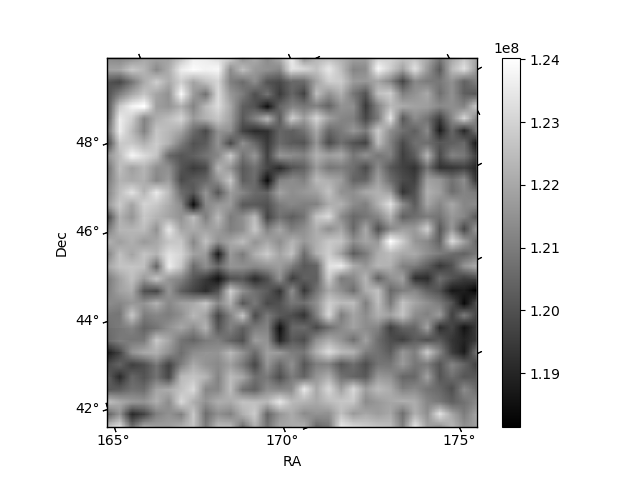
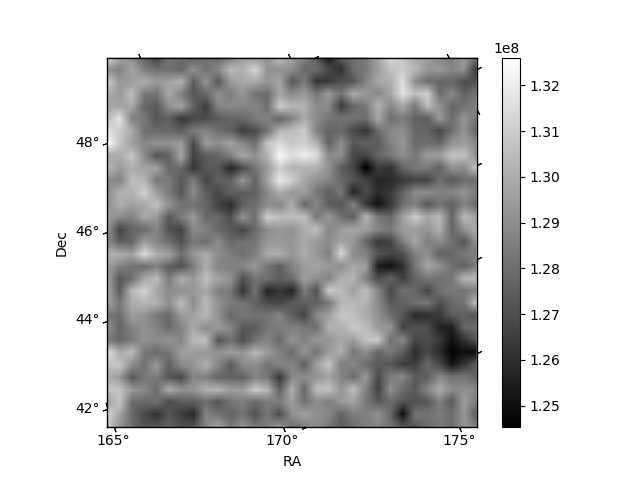
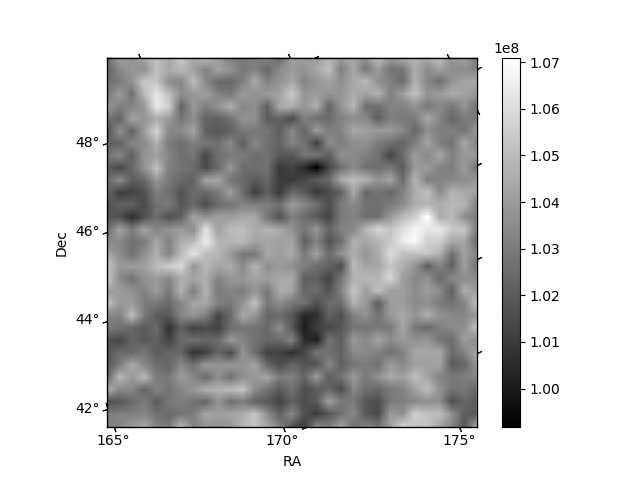
Histogram calculated using DETX and DETY for each event in the final _common_clean file
| Quadrant A | 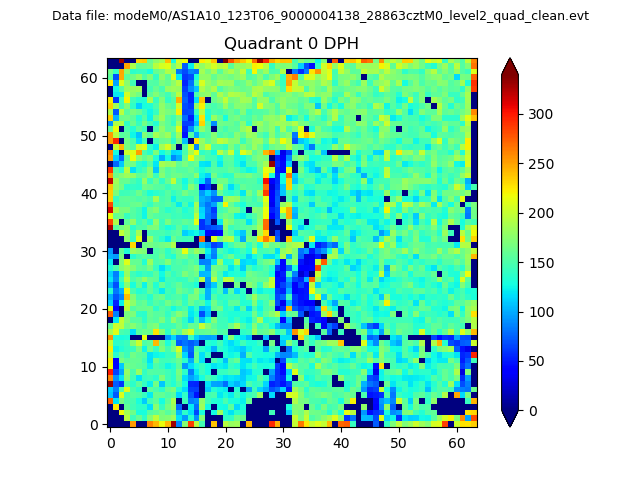 |
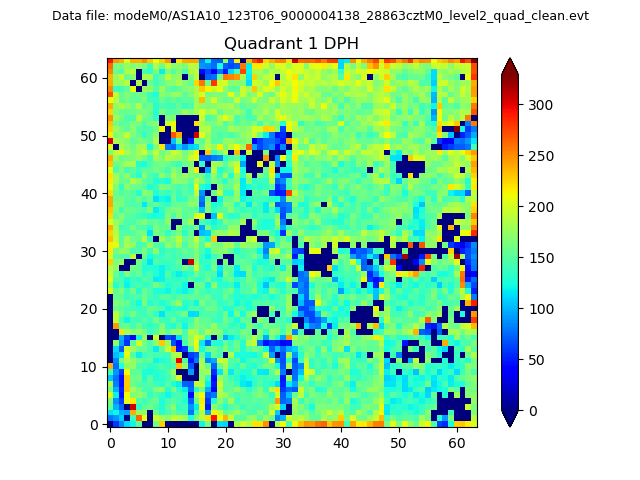 |
Quadrant B |
|---|---|---|---|
| Quadrant D | 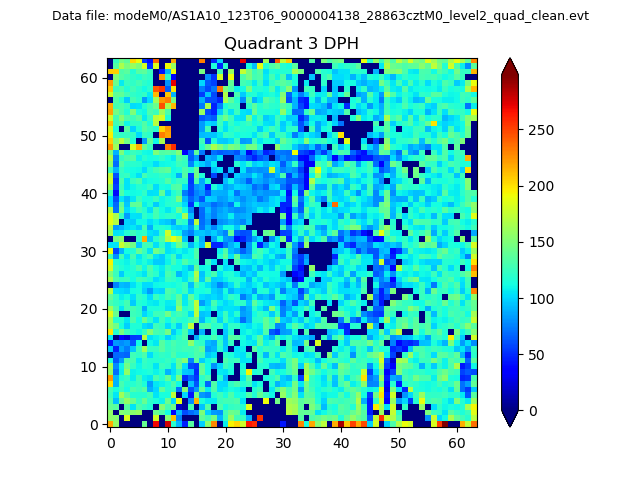 |
 |
Quadrant C |
| Plot type | Count rate plots | Images |
|---|---|---|
| Comparison with Poisson distribution Blue bars denote a histogram of data divided into 1 sec bins. Red curve is a Poisson curve with rate = median count rate of data. |
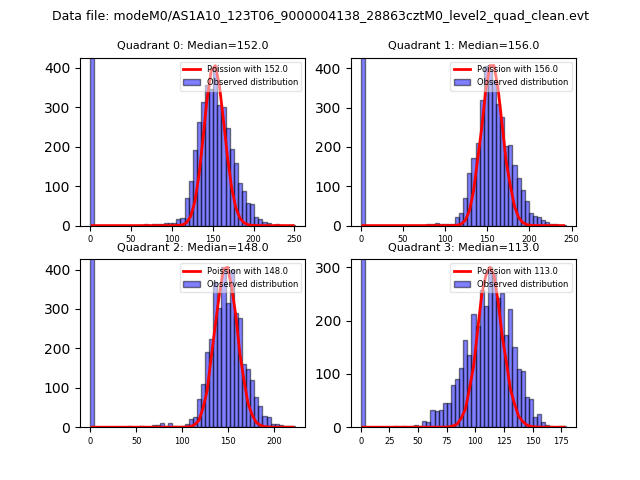 |
 |
| Quadrant-wise count rates Data is divided into 100 sec bins |
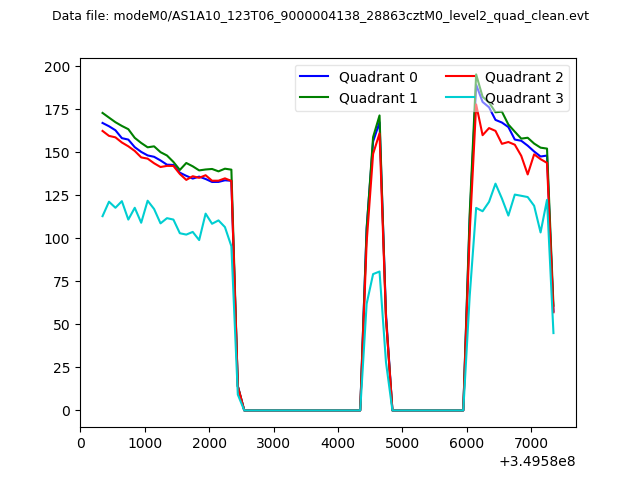 |
|
| Module-wise count rates for Quadrant A Data is divided into 100 sec bins |
 |
 |
| Module-wise count rates for Quadrant B Data is divided into 100 sec bins |
 |
 |
| Module-wise count rates for Quadrant C Data is divided into 100 sec bins |
 |
 |
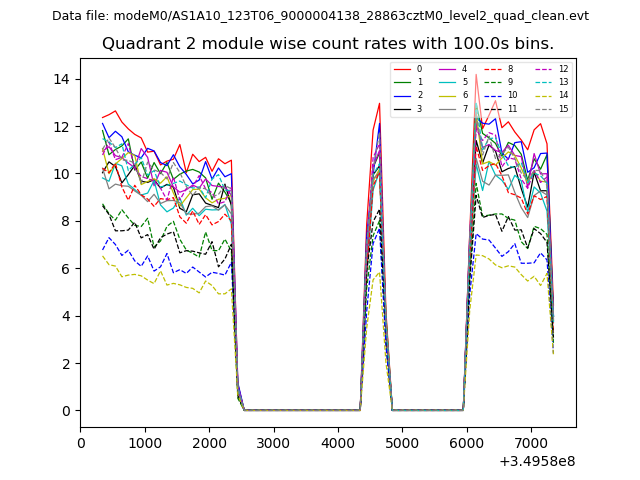
| Module-wise count rates for Quadrant D Data is divided into 100 sec bins |
 |
 |
| Parameter | Plot |
|---|---|
| CZT HV Monitor | 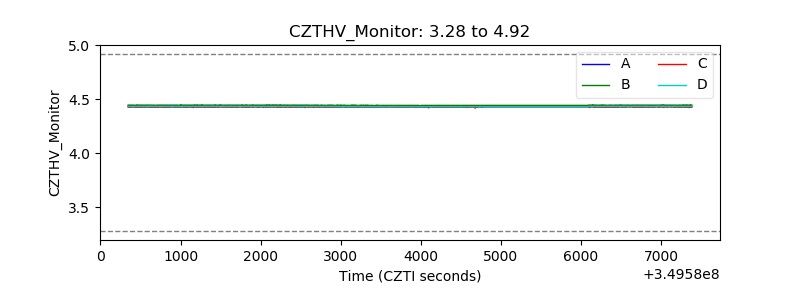 |
| D_VDD |  |
| Temperature 1 | 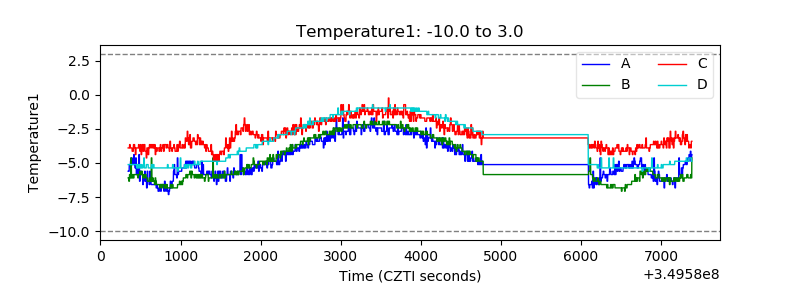 |
| Veto HV Monitor | 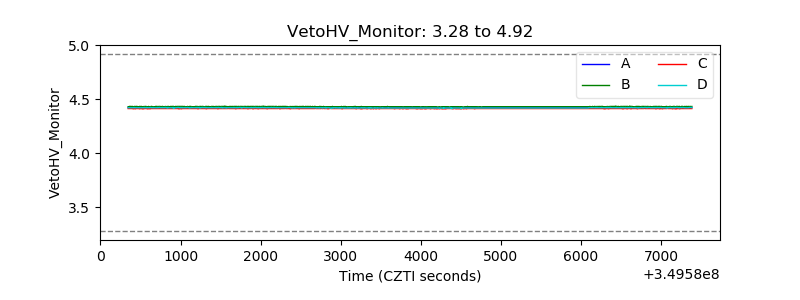 |
| Veto LLD |  |
| Alpha Counter | 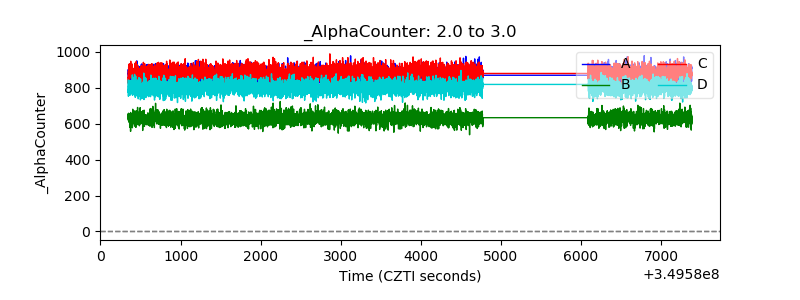 |
| _CPM_Rate |  |
| CZT Counter | 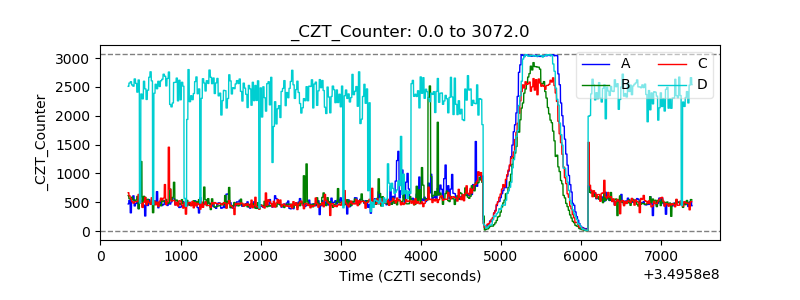 |
| +2.5 Volts monitor |  |
| +5 Volts monitor | 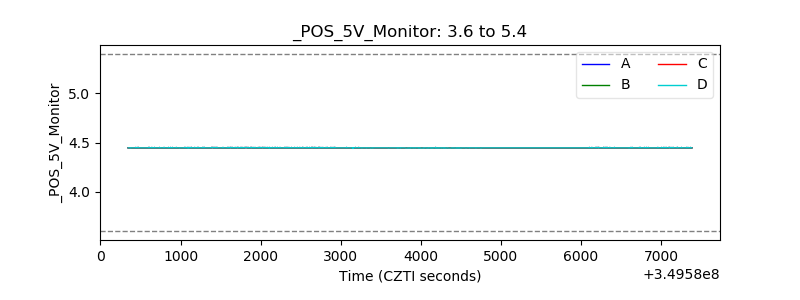 |
| _ROLL_ROT | 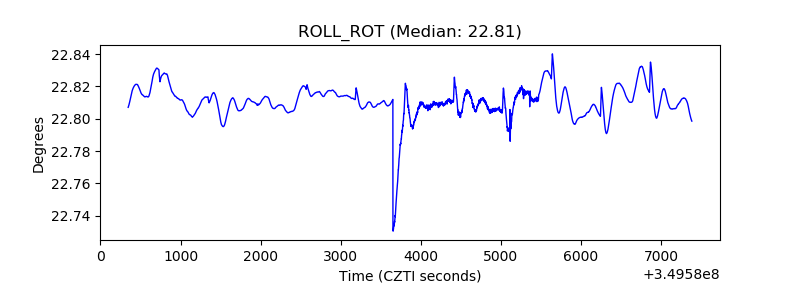 |
| _Roll_DEC | 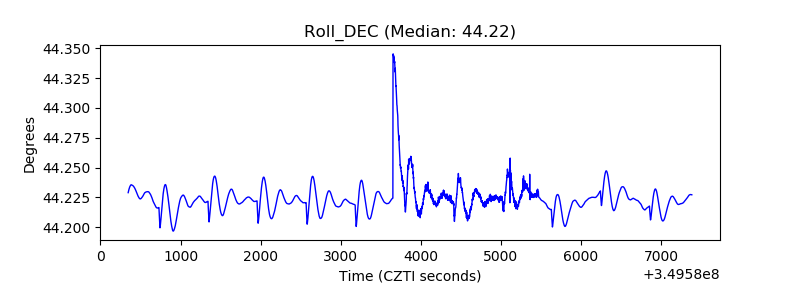 |
| _Roll_RA | 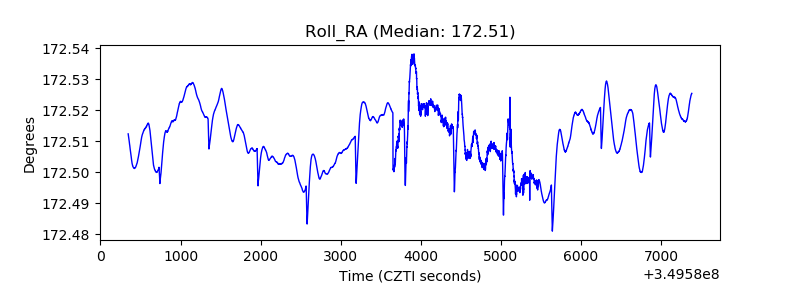 |
| Veto Counter | 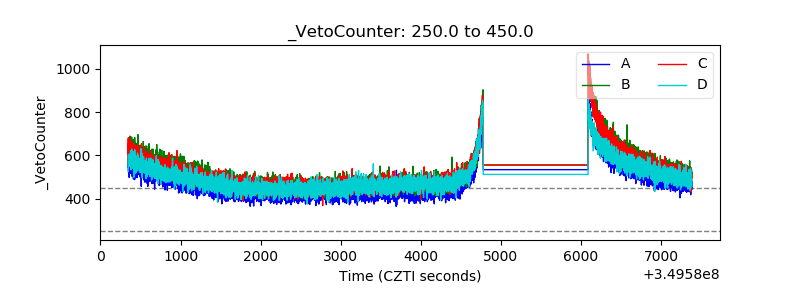 |