| Param | Original file | Final file |
|---|---|---|
| Filename | modeM0/AS1A10_123T06_9000004138_28864cztM0_level2.evt | modeM0/AS1A10_123T06_9000004138_28864cztM0_level2_quad_clean.evt |
| Size (bytes) | 1,922,852,160 | 219,012,480 |
| Size | 1.8 GB | 208.9 MB |
| Events in quadrant A | 8,481,610 | 1,470,008 |
| Events in quadrant B | 8,409,681 | 1,515,972 |
| Events in quadrant C | 8,222,738 | 1,434,789 |
| Events in quadrant D | 32,052,936 | 1,117,014 |
| Mode M0 | |||
|---|---|---|---|
| Quadrant | BADHDUFLAG | Total packets | Discarded packets |
| A | 0 | 34813 | 3 |
| B | 0 | 34660 | 3 |
| C | 0 | 34059 | 3 |
| D | 0 | 105967 | 3 |
| Mode SS | |||
|---|---|---|---|
| Quadrant | BADHDUFLAG | Total packets | Discarded packets |
| A | 0 | 322 | 0 |
| B | 0 | 322 | 0 |
| C | 0 | 322 | 0 |
| D | 0 | 322 | 0 |
| Mode M9 | |||
|---|---|---|---|
| Quadrant | BADHDUFLAG | Total packets | Discarded packets |
| A | 0 | 39 | 0 |
| B | 0 | 39 | 0 |
| C | 0 | 39 | 0 |
| D | 0 | 39 | 0 |
| Quadrant | Total seconds | Saturated seconds | Saturation percentage |
|---|---|---|---|
| A | 15847 | 93 | 0.586862% |
| B | 15847 | 253 | 1.596517% |
| C | 15848 | 271 | 1.709995% |
| D | 15848 | 10654 | 67.226148% |
Noise dominated data is calculated using 1-second bins in cleaned event files. If a bin has >2000 counts, and if more than 50% of those come from <1% of pixels, then it is considered to be noise-dominated and hence unusable.
| Quadrant | # 1 sec bins | Bins with >0 counts | Bins with >2000 counts | High rate bins dominated by noise | Noise dominated (total time) | Noise dominated (detector-on time) | Marked lightcurve |
|---|---|---|---|---|---|---|---|
| A | 19752 | 15849 | 6 | 6 | 0.03% | 0.04% | 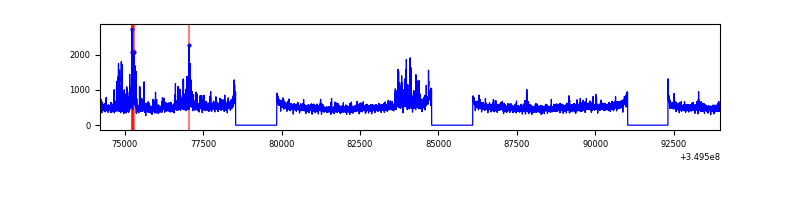 |
| B | 19752 | 15848 | 73 | 73 | 0.37% | 0.46% | 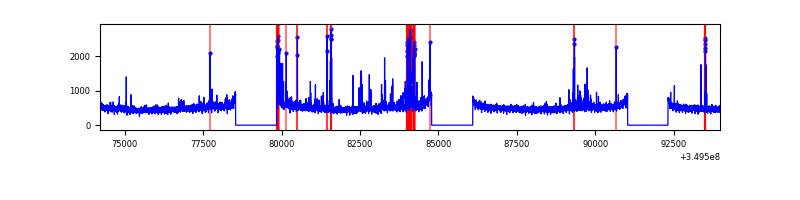 |
| C | 19753 | 15849 | 14 | 14 | 0.07% | 0.09% | 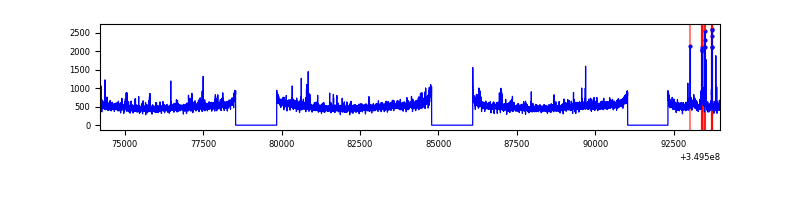 |
| D | 19753 | 15848 | 11618 | 11618 | 58.82% | 73.31% | 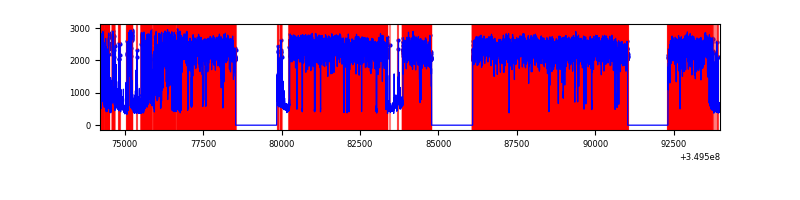 |
Top three noisy pixels from each quadrant. If the there are fewer than three noisy pixels in the level2.evt file, extra rows are filled as -1
| Pixel properties | Quadrant properties | ||||||
|---|---|---|---|---|---|---|---|
| Quadrant | DetID | PixID | Counts | Sigma | Mean | Median | Sigma |
| A | 14 | 235 | 583350 | 1458.89 | 2034 | 1998 | 398.5 |
| A | 1 | 113 | 35141 | 83.17 | 2034 | 1998 | 398.5 |
| A | 13 | 254 | 28162 | 65.66 | 2034 | 1998 | 398.5 |
| B | 5 | 255 | 329385 | 877.94 | 2016 | 1975 | 372.9 |
| B | 15 | 32 | 89597 | 234.96 | 2016 | 1975 | 372.9 |
| B | 10 | 246 | 57115 | 147.86 | 2016 | 1975 | 372.9 |
| C | 14 | 238 | 343720 | 772.08 | 1931 | 1950 | 442.7 |
| C | 3 | 233 | 210714 | 471.61 | 1931 | 1950 | 442.7 |
| C | 4 | 254 | 81878 | 180.56 | 1931 | 1950 | 442.7 |
| D | 8 | 195 | 21177309 | 58037.02 | 1572 | 1535 | 364.9 |
| D | 1 | 52 | 4389921 | 12027.37 | 1572 | 1535 | 364.9 |
| D | 7 | 80 | 415071 | 1133.39 | 1572 | 1535 | 364.9 |
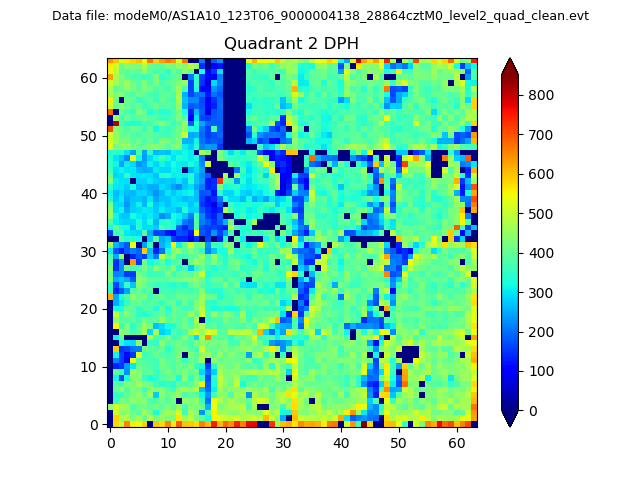
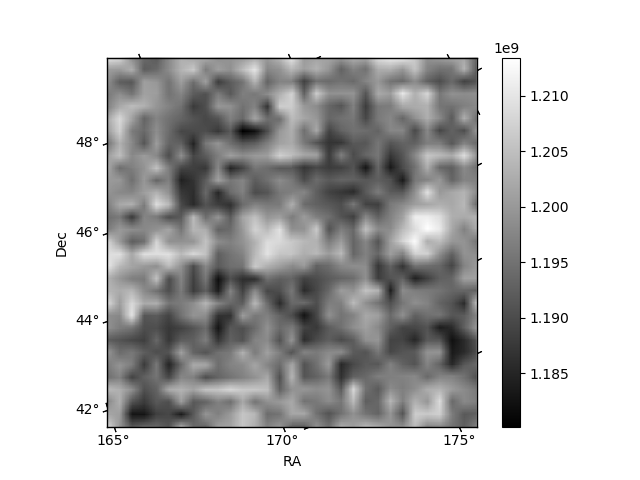
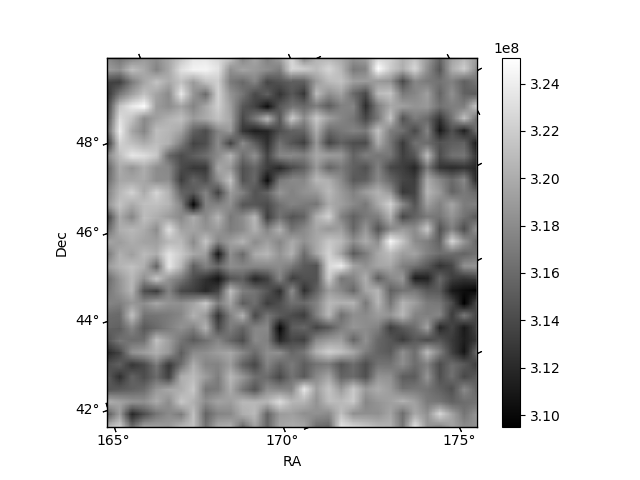
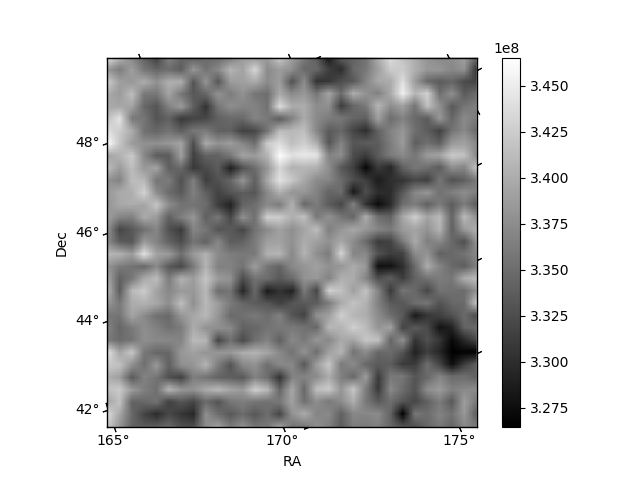
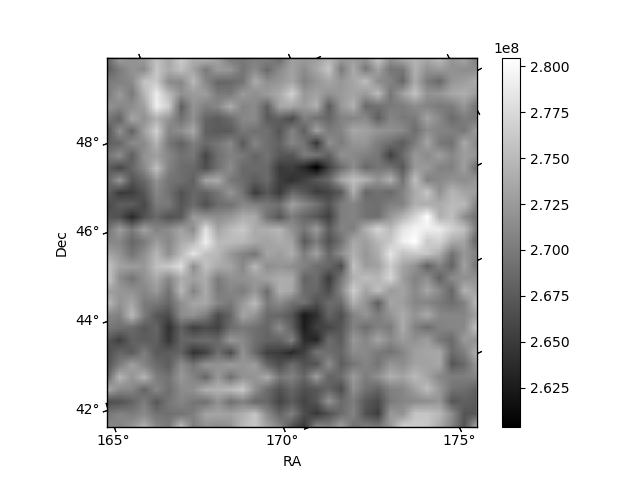
Histogram calculated using DETX and DETY for each event in the final _common_clean file
| Quadrant A | 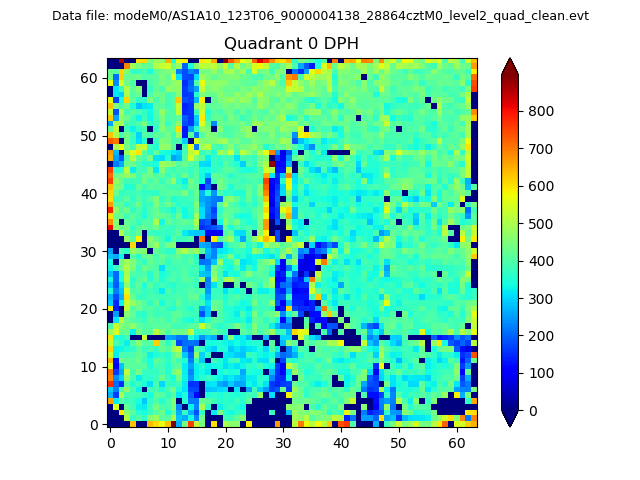 |
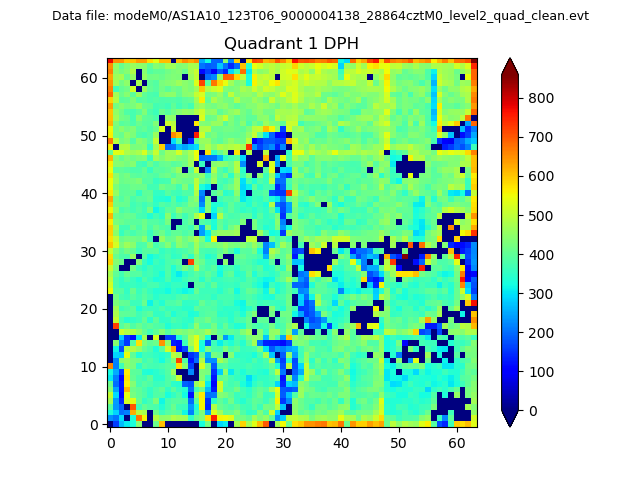 |
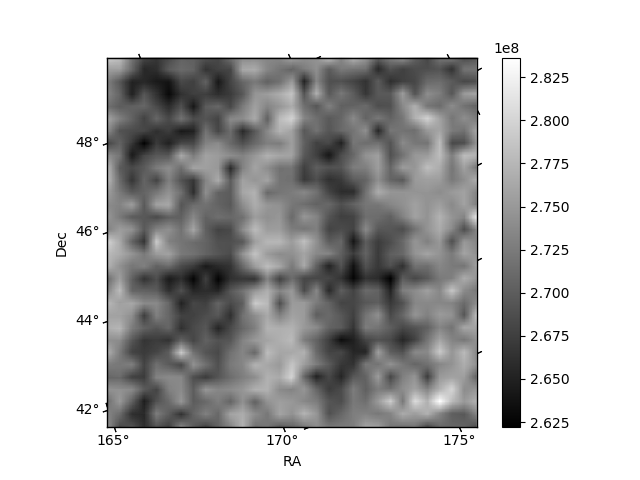
Quadrant B |
|---|---|---|---|
| Quadrant D | 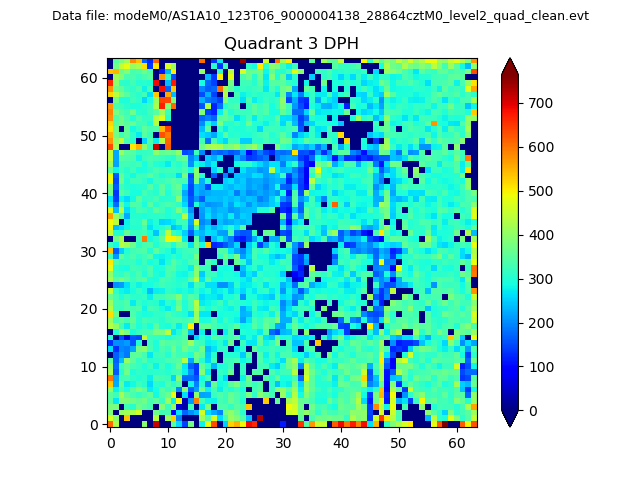 |
 |
Quadrant C |
| Plot type | Count rate plots | Images |
|---|---|---|
| Comparison with Poisson distribution Blue bars denote a histogram of data divided into 1 sec bins. Red curve is a Poisson curve with rate = median count rate of data. |
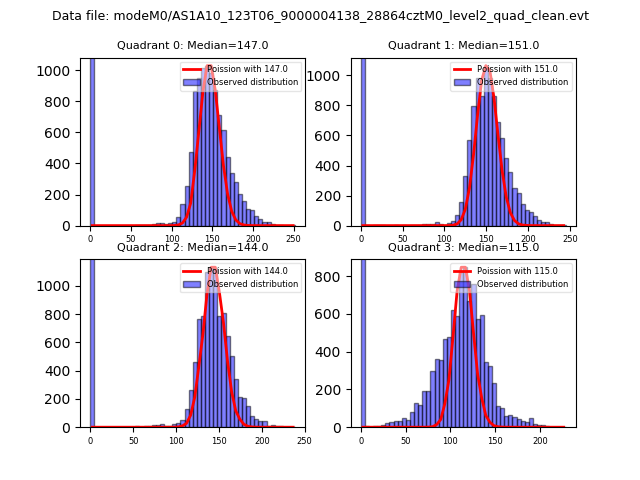 |
 |
| Quadrant-wise count rates Data is divided into 100 sec bins |
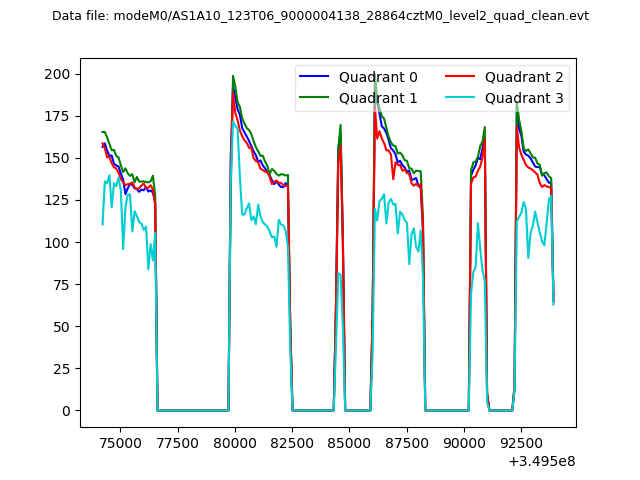 |
|
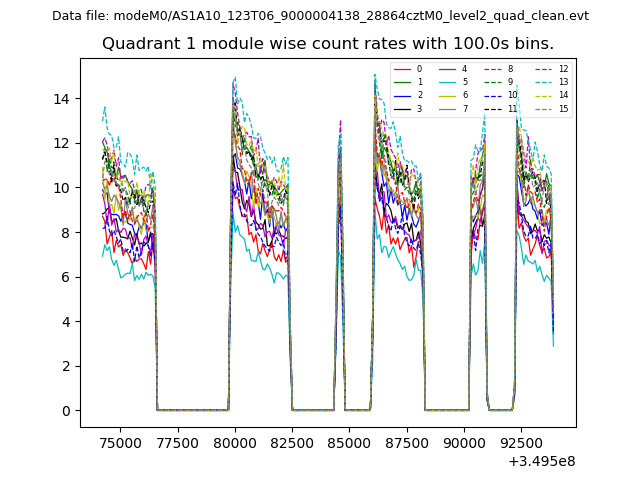
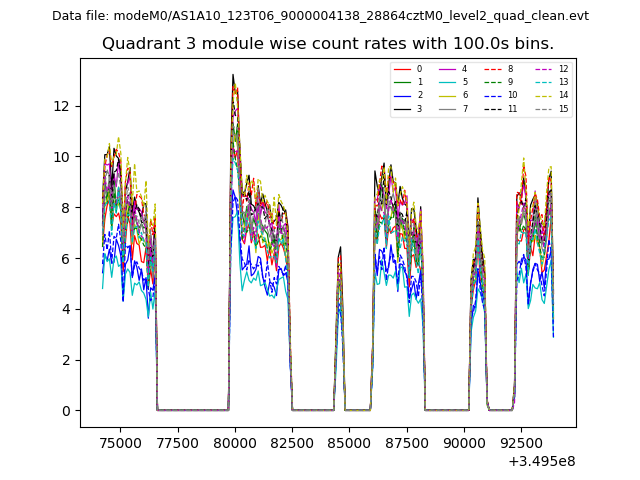
| Module-wise count rates for Quadrant A Data is divided into 100 sec bins |
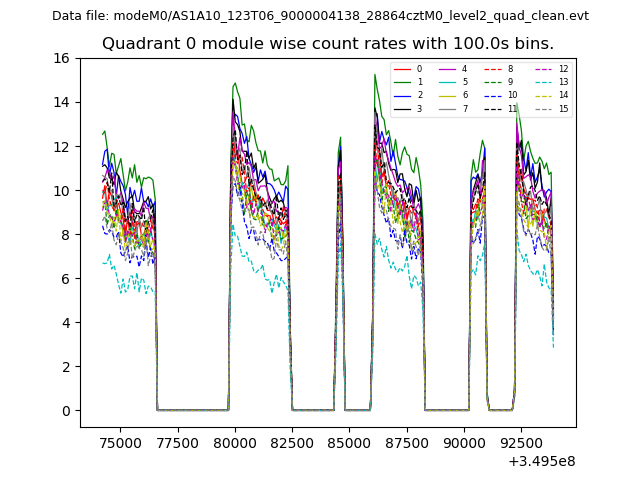 |
 |
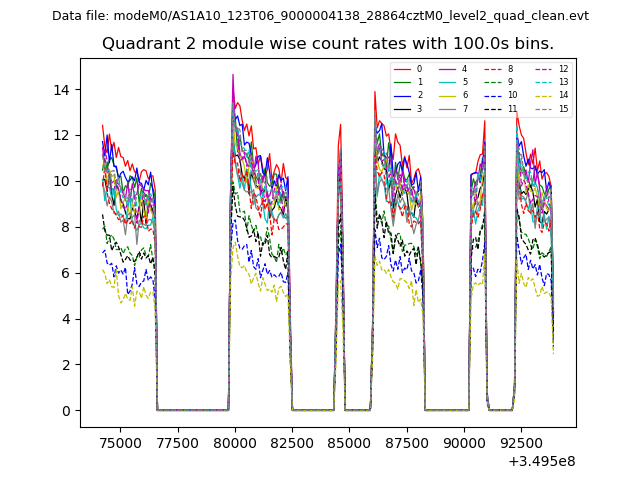
| Module-wise count rates for Quadrant B Data is divided into 100 sec bins |
 |
 |
| Module-wise count rates for Quadrant C Data is divided into 100 sec bins |
 |
 |
| Module-wise count rates for Quadrant D Data is divided into 100 sec bins |
 |
 |
| Parameter | Plot |
|---|---|
| CZT HV Monitor | 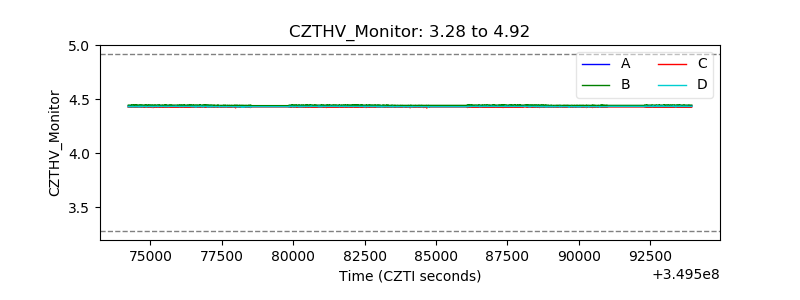 |
| D_VDD | 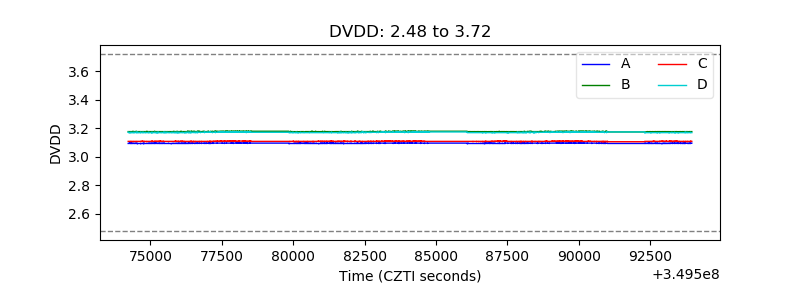 |
| Temperature 1 | 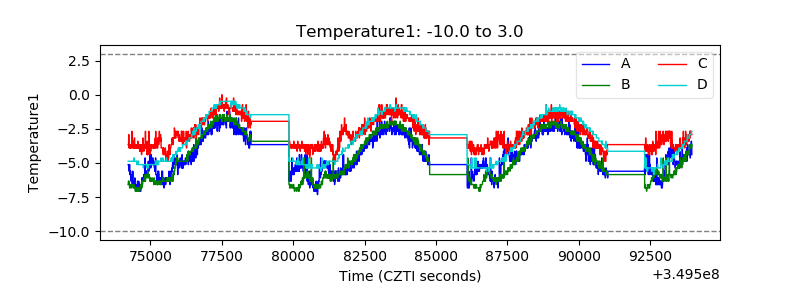 |
| Veto HV Monitor | 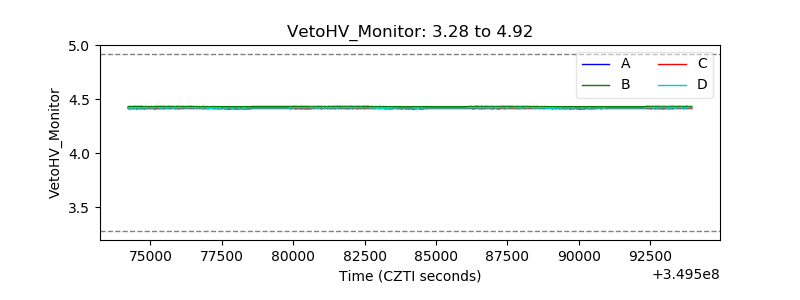 |
| Veto LLD | 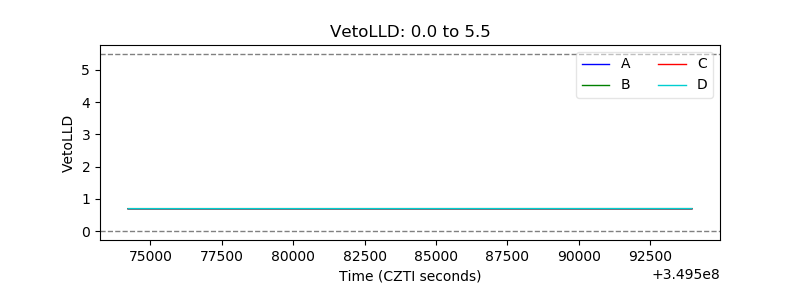 |
| Alpha Counter | 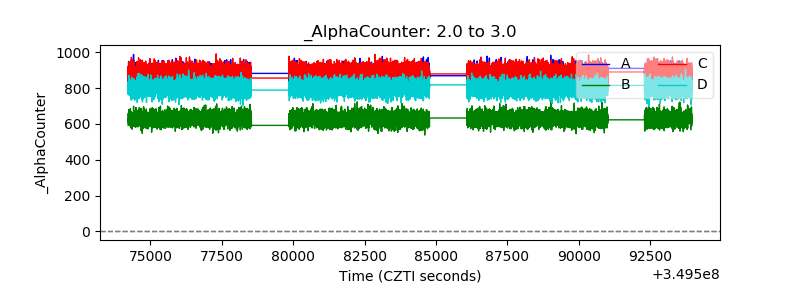 |
| _CPM_Rate | 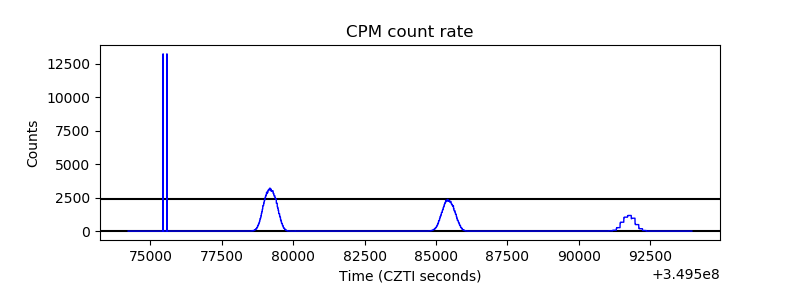 |
| CZT Counter | 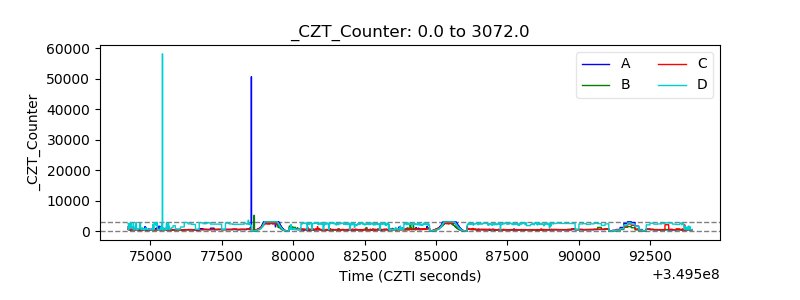 |
| +2.5 Volts monitor |  |
| +5 Volts monitor | 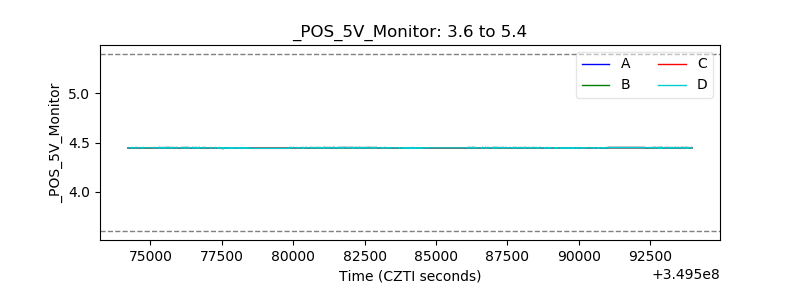 |
| _ROLL_ROT | 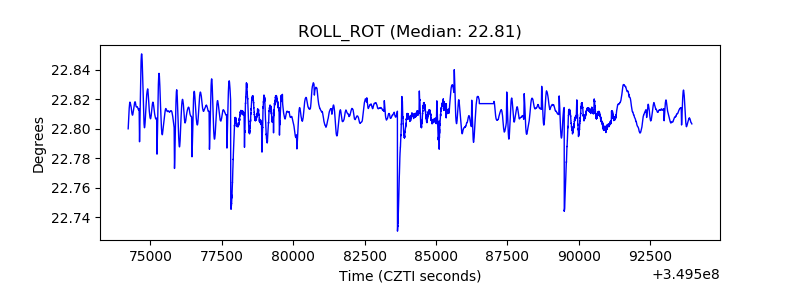 |
| _Roll_DEC |  |
| _Roll_RA | 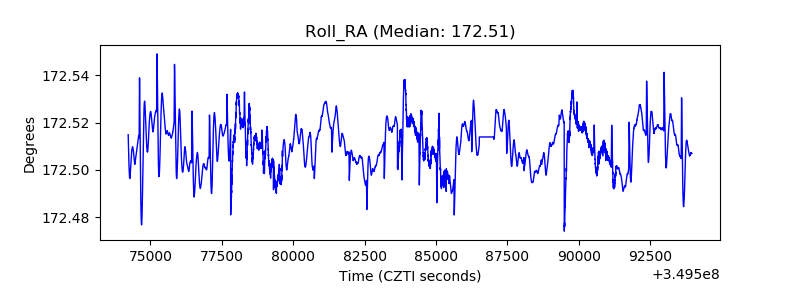 |
| Veto Counter | 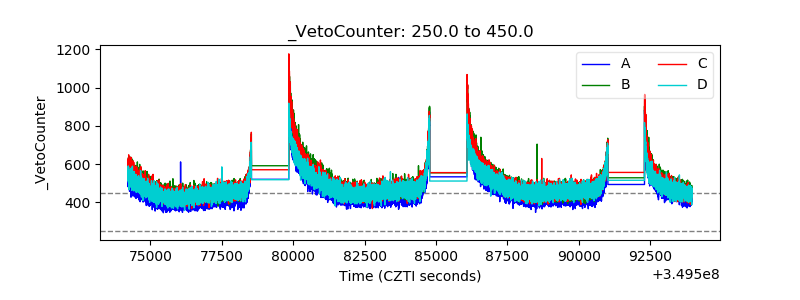 |