| Param | Original file | Final file |
|---|---|---|
| Filename | modeM0/AS1A10_123T06_9000004138_28866cztM0_level2.evt | modeM0/AS1A10_123T06_9000004138_28866cztM0_level2_quad_clean.evt |
| Size (bytes) | 642,291,840 | 85,757,760 |
| Size | 612.5 MB | 81.8 MB |
| Events in quadrant A | 3,130,135 | 549,282 |
| Events in quadrant B | 3,211,193 | 560,579 |
| Events in quadrant C | 3,458,722 | 538,721 |
| Events in quadrant D | 9,214,994 | 497,212 |
| Mode M0 | |||
|---|---|---|---|
| Quadrant | BADHDUFLAG | Total packets | Discarded packets |
| A | 0 | 13288 | 1 |
| B | 0 | 13462 | 1 |
| C | 0 | 14167 | 1 |
| D | 0 | 31912 | 1 |
| Mode SS | |||
|---|---|---|---|
| Quadrant | BADHDUFLAG | Total packets | Discarded packets |
| A | 0 | 130 | 0 |
| B | 0 | 130 | 0 |
| C | 0 | 130 | 0 |
| D | 0 | 130 | 0 |
| Mode M9 | |||
|---|---|---|---|
| Quadrant | BADHDUFLAG | Total packets | Discarded packets |
| A | 0 | 8 | 0 |
| B | 0 | 8 | 0 |
| C | 0 | 8 | 0 |
| D | 0 | 8 | 0 |
| Quadrant | Total seconds | Saturated seconds | Saturation percentage |
|---|---|---|---|
| A | 6470 | 71 | 1.097372% |
| B | 6470 | 76 | 1.174652% |
| C | 6470 | 81 | 1.251932% |
| D | 6471 | 988 | 15.268119% |
Noise dominated data is calculated using 1-second bins in cleaned event files. If a bin has >2000 counts, and if more than 50% of those come from <1% of pixels, then it is considered to be noise-dominated and hence unusable.
| Quadrant | # 1 sec bins | Bins with >0 counts | Bins with >2000 counts | High rate bins dominated by noise | Noise dominated (total time) | Noise dominated (detector-on time) | Marked lightcurve |
|---|---|---|---|---|---|---|---|
| A | 7200 | 6470 | 1 | 1 | 0.01% | 0.02% | 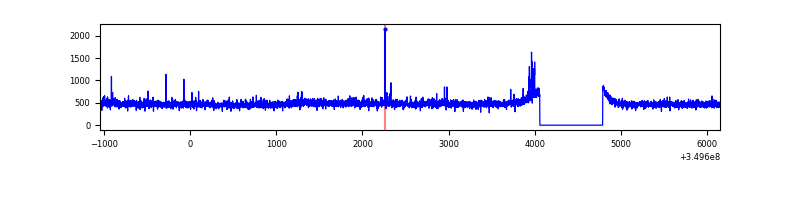 |
| B | 7200 | 6470 | 4 | 4 | 0.06% | 0.06% | 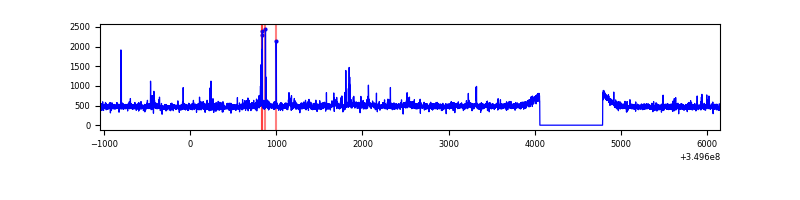 |
| C | 7200 | 6470 | 0 | 0 | 0.00% | 0.00% | 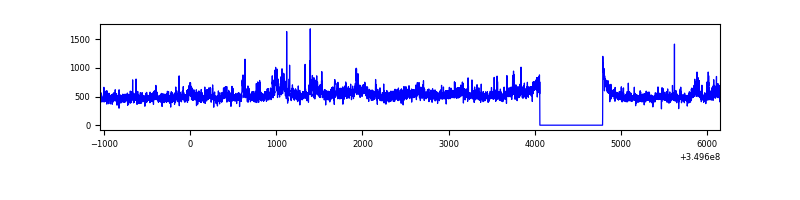 |
| D | 7201 | 6471 | 1030 | 1030 | 14.30% | 15.92% | 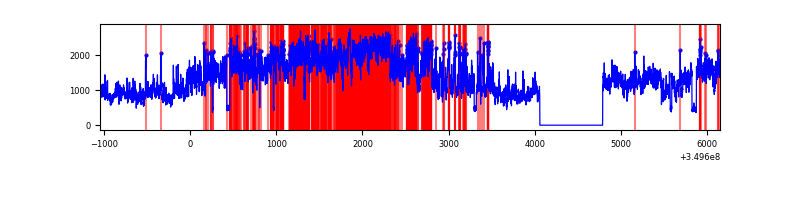 |
Top three noisy pixels from each quadrant. If the there are fewer than three noisy pixels in the level2.evt file, extra rows are filled as -1
| Pixel properties | Quadrant properties | ||||||
|---|---|---|---|---|---|---|---|
| Quadrant | DetID | PixID | Counts | Sigma | Mean | Median | Sigma |
| A | 1 | 113 | 46678 | 287.79 | 789 | 775 | 159.5 |
| A | 14 | 235 | 33142 | 202.92 | 789 | 775 | 159.5 |
| A | 13 | 254 | 11786 | 69.03 | 789 | 775 | 159.5 |
| B | 10 | 245 | 32619 | 213.51 | 783 | 765 | 149.2 |
| B | 10 | 246 | 28965 | 189.02 | 783 | 765 | 149.2 |
| B | 15 | 35 | 23070 | 149.51 | 783 | 765 | 149.2 |
| C | 3 | 233 | 380180 | 2167.8 | 749 | 754 | 175.0 |
| C | 14 | 238 | 126368 | 717.68 | 749 | 754 | 175.0 |
| C | 4 | 254 | 28443 | 158.2 | 749 | 754 | 175.0 |
| D | 8 | 195 | 6160881 | 34811.12 | 738 | 716 | 177.0 |
| D | 1 | 52 | 139827 | 786.12 | 738 | 716 | 177.0 |
| D | 7 | 80 | 72763 | 407.14 | 738 | 716 | 177.0 |
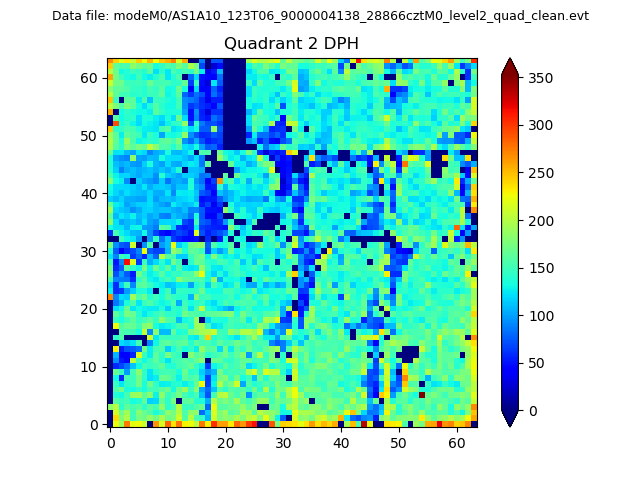
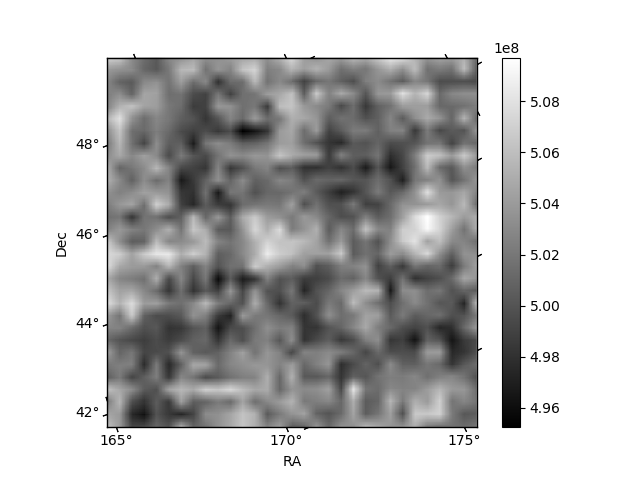
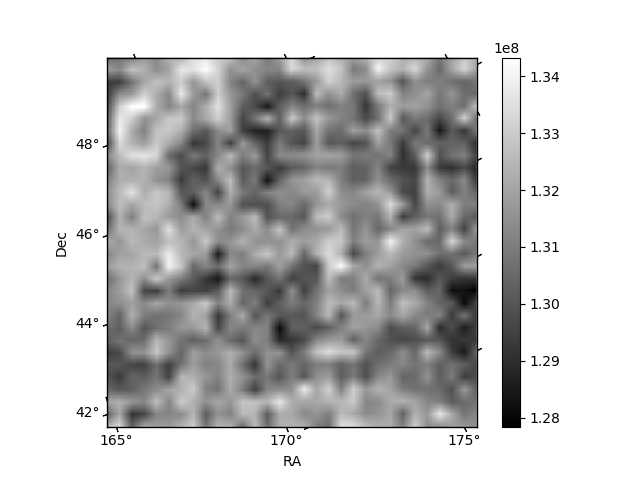
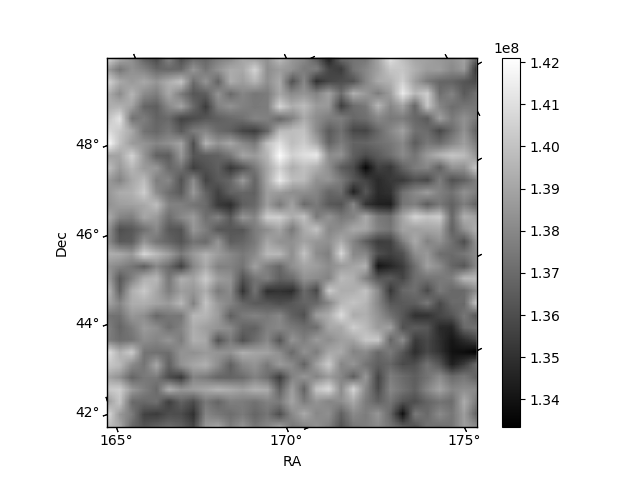
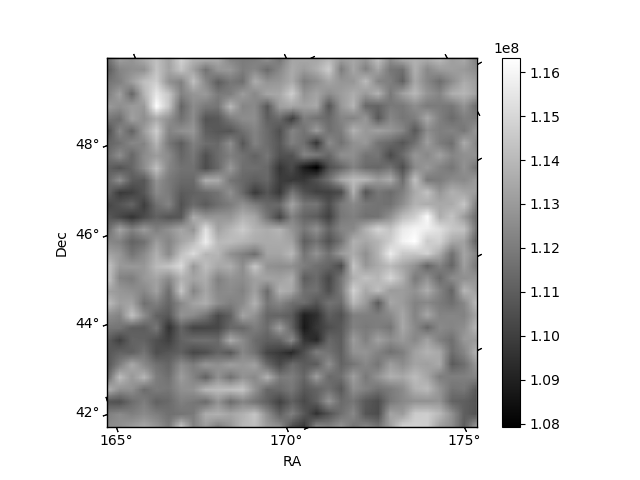
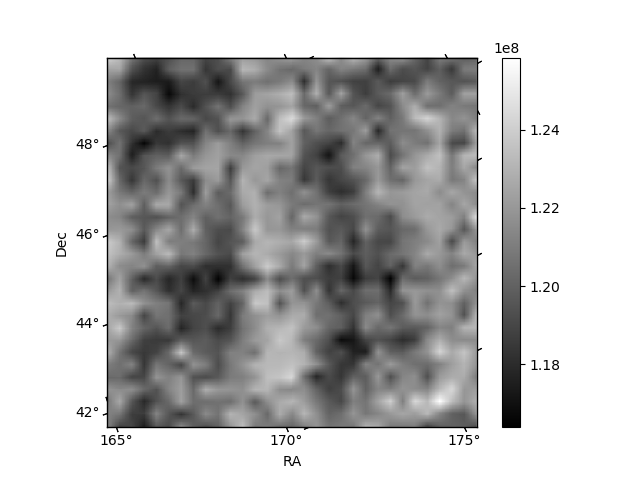
Histogram calculated using DETX and DETY for each event in the final _common_clean file
| Quadrant A | 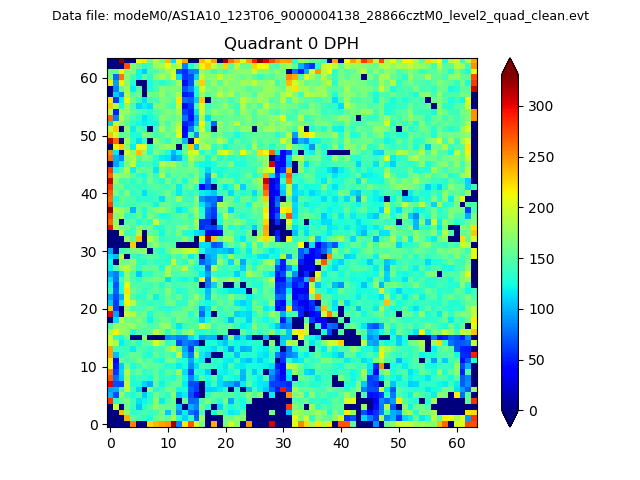 |
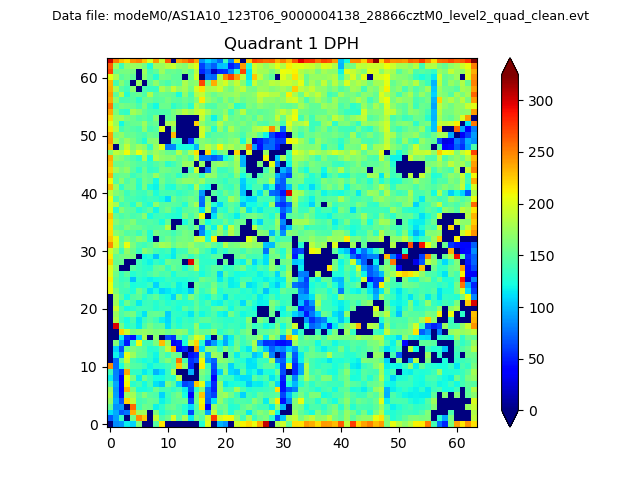 |
Quadrant B |
|---|---|---|---|
| Quadrant D | 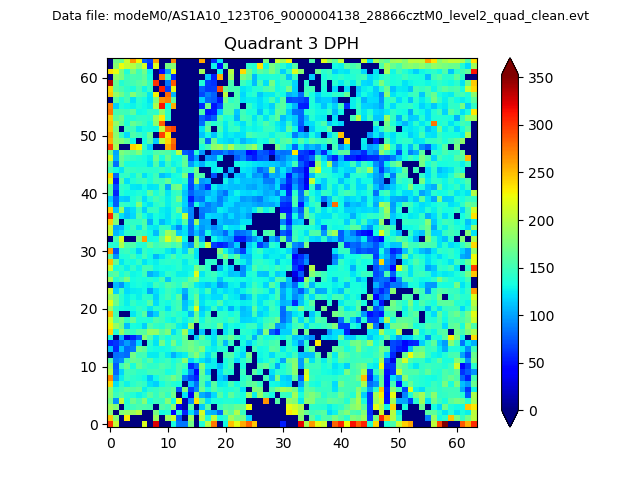 |
 |
Quadrant C |
| Plot type | Count rate plots | Images |
|---|---|---|
| Comparison with Poisson distribution Blue bars denote a histogram of data divided into 1 sec bins. Red curve is a Poisson curve with rate = median count rate of data. |
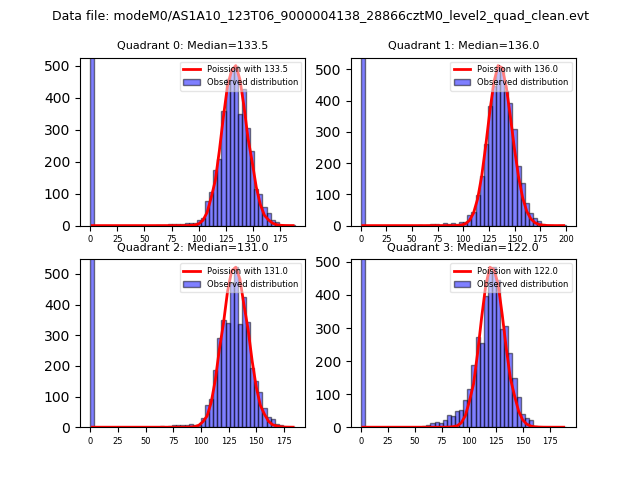 |
 |
| Quadrant-wise count rates Data is divided into 100 sec bins |
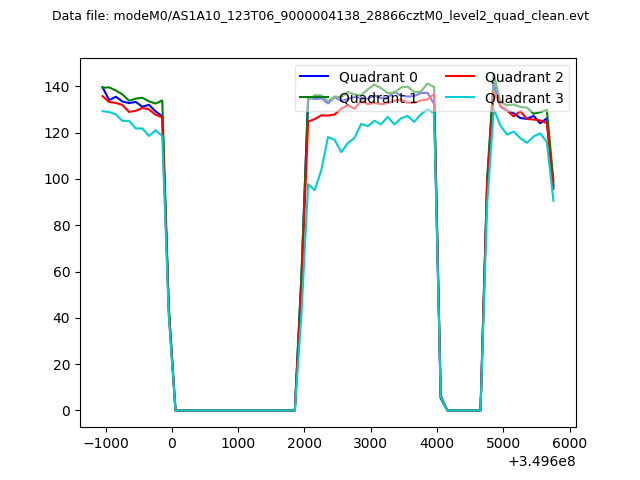 |
|
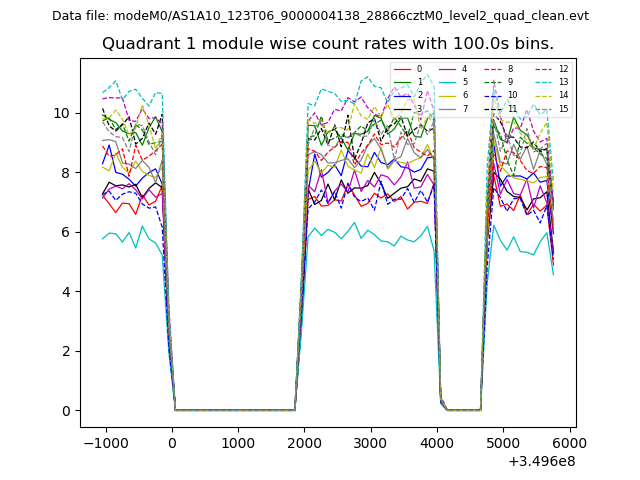
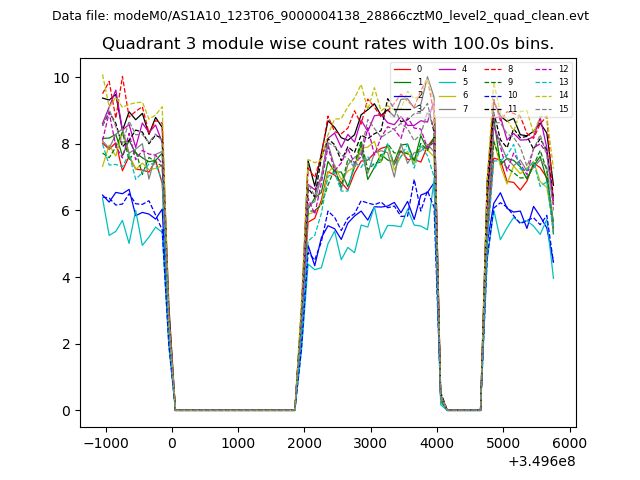
| Module-wise count rates for Quadrant A Data is divided into 100 sec bins |
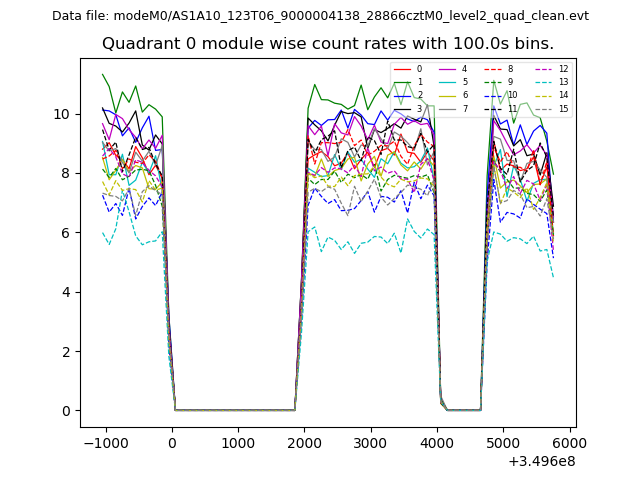 |
 |
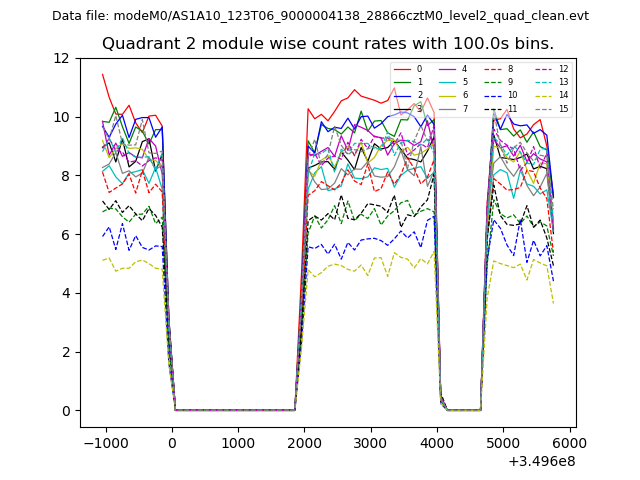
| Module-wise count rates for Quadrant B Data is divided into 100 sec bins |
 |
 |
| Module-wise count rates for Quadrant C Data is divided into 100 sec bins |
 |
 |
| Module-wise count rates for Quadrant D Data is divided into 100 sec bins |
 |
 |
| Parameter | Plot |
|---|---|
| CZT HV Monitor | 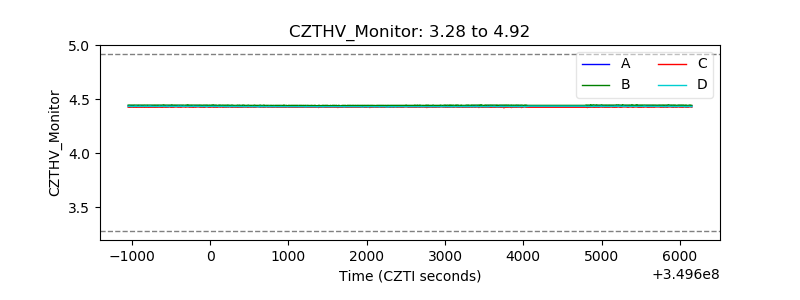 |
| D_VDD | 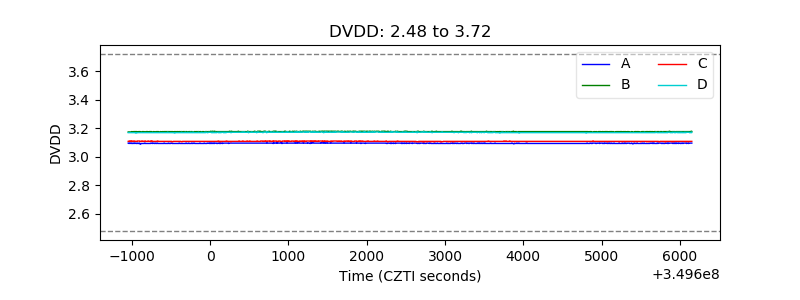 |
| Temperature 1 | 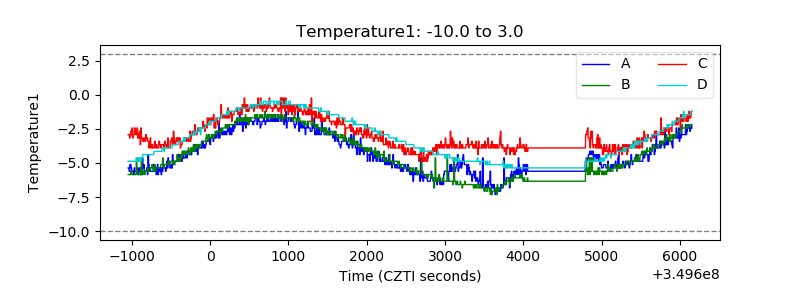 |
| Veto HV Monitor | 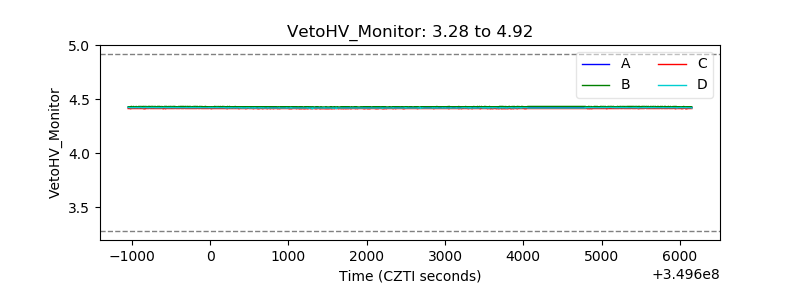 |
| Veto LLD | 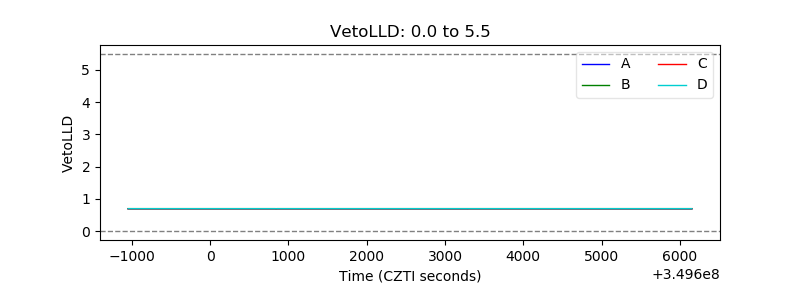 |
| Alpha Counter | 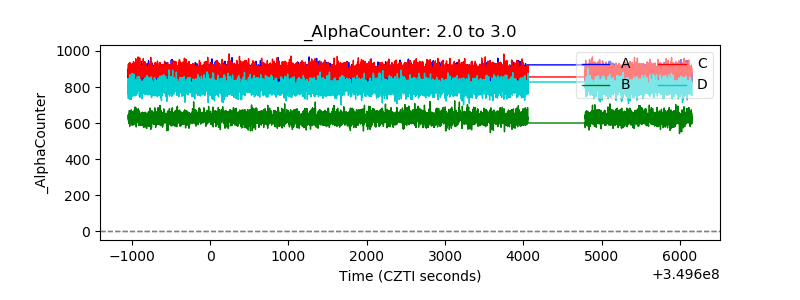 |
| _CPM_Rate | 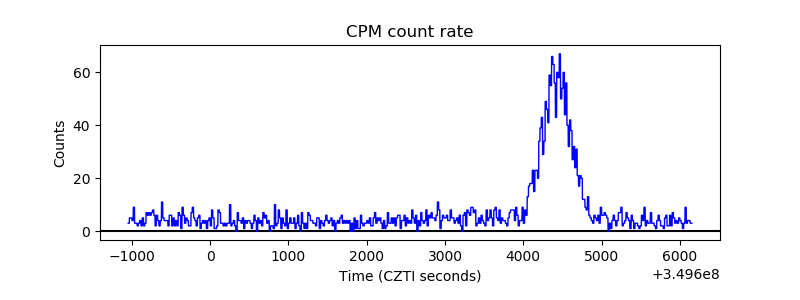 |
| CZT Counter |  |
| +2.5 Volts monitor |  |
| +5 Volts monitor |  |
| _ROLL_ROT | 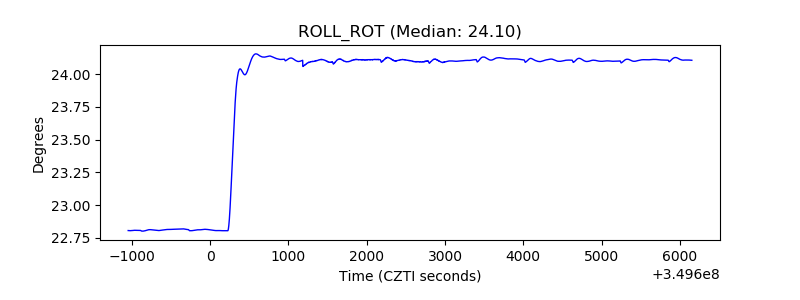 |
| _Roll_DEC | 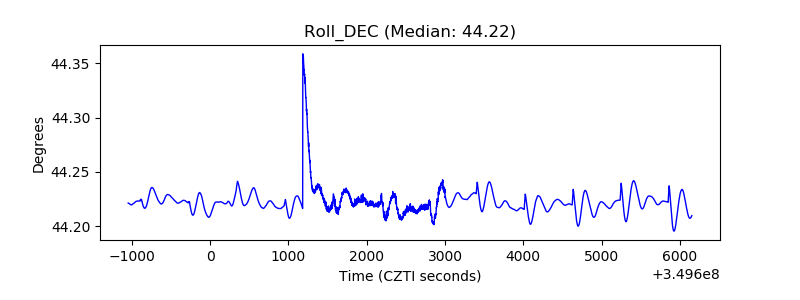 |
| _Roll_RA | 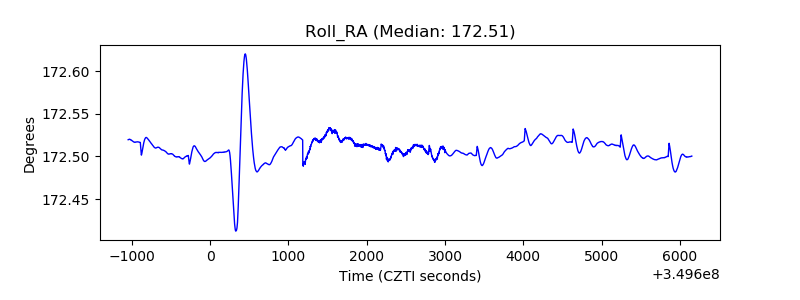 |
| Veto Counter | 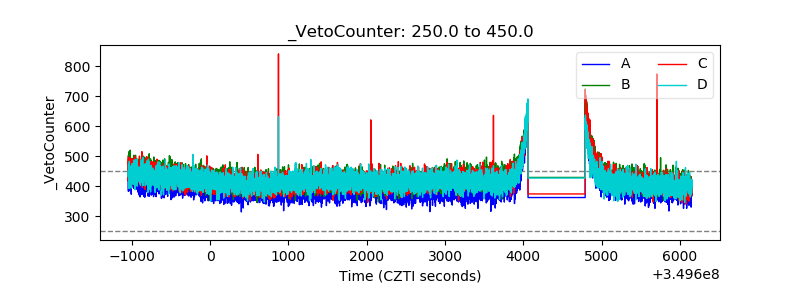 |