| Param | Original file | Final file |
|---|---|---|
| Filename | modeM0/AS1A10_123T06_9000004138_28867cztM0_level2.evt | modeM0/AS1A10_123T06_9000004138_28867cztM0_level2_quad_clean.evt |
| Size (bytes) | 797,040,000 | 95,008,320 |
| Size | 760.1 MB | 90.6 MB |
| Events in quadrant A | 3,699,891 | 601,105 |
| Events in quadrant B | 3,742,125 | 614,910 |
| Events in quadrant C | 6,365,891 | 574,844 |
| Events in quadrant D | 9,816,100 | 554,754 |
| Mode M0 | |||
|---|---|---|---|
| Quadrant | BADHDUFLAG | Total packets | Discarded packets |
| A | 0 | 15869 | 2 |
| B | 0 | 15982 | 2 |
| C | 0 | 24078 | 3 |
| D | 0 | 34455 | 2 |
| Mode SS | |||
|---|---|---|---|
| Quadrant | BADHDUFLAG | Total packets | Discarded packets |
| A | 0 | 154 | 0 |
| B | 0 | 154 | 0 |
| C | 0 | 154 | 0 |
| D | 0 | 154 | 0 |
| Mode M9 | |||
|---|---|---|---|
| Quadrant | BADHDUFLAG | Total packets | Discarded packets |
| A | 0 | 3 | 0 |
| B | 0 | 4 | 0 |
| C | 0 | 4 | 0 |
| D | 0 | 4 | 0 |
| Quadrant | Total seconds | Saturated seconds | Saturation percentage |
|---|---|---|---|
| A | 7638 | 219 | 2.867243% |
| B | 7638 | 262 | 3.430217% |
| C | 7637 | 529 | 6.926804% |
| D | 7637 | 600 | 7.856488% |
Noise dominated data is calculated using 1-second bins in cleaned event files. If a bin has >2000 counts, and if more than 50% of those come from <1% of pixels, then it is considered to be noise-dominated and hence unusable.
| Quadrant | # 1 sec bins | Bins with >0 counts | Bins with >2000 counts | High rate bins dominated by noise | Noise dominated (total time) | Noise dominated (detector-on time) | Marked lightcurve |
|---|---|---|---|---|---|---|---|
| A | 7853 | 7638 | 0 | 0 | 0.00% | 0.00% | 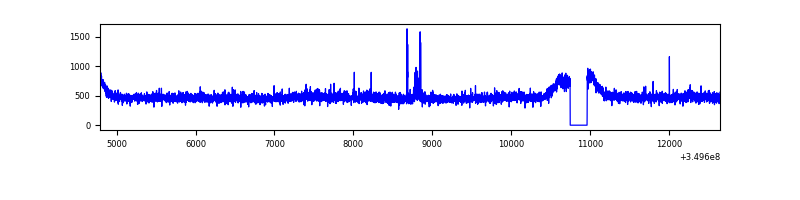 |
| B | 7853 | 7638 | 5 | 5 | 0.06% | 0.07% | 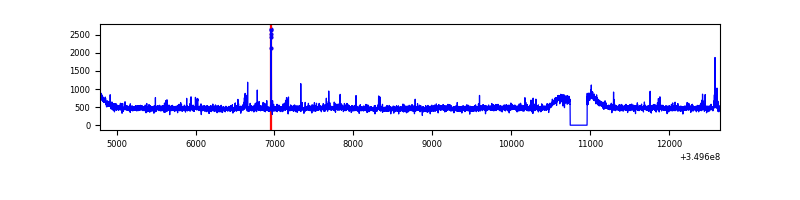 |
| C | 7852 | 7637 | 37 | 37 | 0.47% | 0.48% | 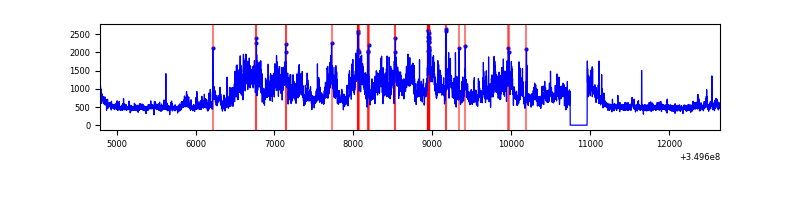 |
| D | 7852 | 7637 | 365 | 365 | 4.65% | 4.78% | 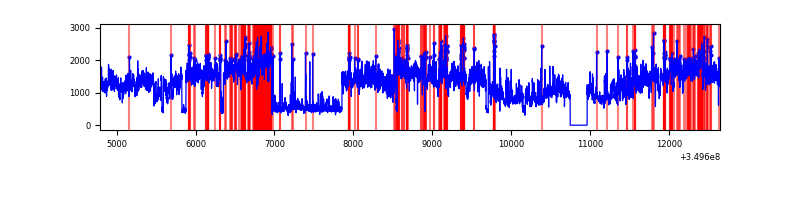 |
Top three noisy pixels from each quadrant. If the there are fewer than three noisy pixels in the level2.evt file, extra rows are filled as -1
| Pixel properties | Quadrant properties | ||||||
|---|---|---|---|---|---|---|---|
| Quadrant | DetID | PixID | Counts | Sigma | Mean | Median | Sigma |
| A | 14 | 235 | 36459 | 186.19 | 943 | 923 | 190.9 |
| A | 1 | 113 | 16734 | 82.84 | 943 | 923 | 190.9 |
| A | 13 | 254 | 13521 | 66.01 | 943 | 923 | 190.9 |
| B | 15 | 201 | 22548 | 120.76 | 933 | 908 | 179.2 |
| B | 12 | 111 | 22364 | 119.74 | 933 | 908 | 179.2 |
| B | 11 | 111 | 20383 | 108.68 | 933 | 908 | 179.2 |
| C | 3 | 233 | 2549857 | 12281.36 | 886 | 888 | 207.5 |
| C | 4 | 254 | 200677 | 962.62 | 886 | 888 | 207.5 |
| C | 14 | 238 | 149868 | 717.81 | 886 | 888 | 207.5 |
| D | 8 | 195 | 6096696 | 28241.57 | 895 | 869 | 215.8 |
| D | 1 | 52 | 163104 | 751.62 | 895 | 869 | 215.8 |
| D | 7 | 80 | 81572 | 373.89 | 895 | 869 | 215.8 |
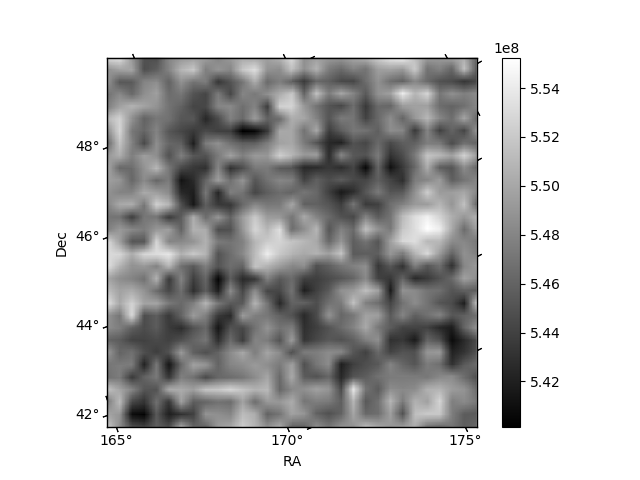
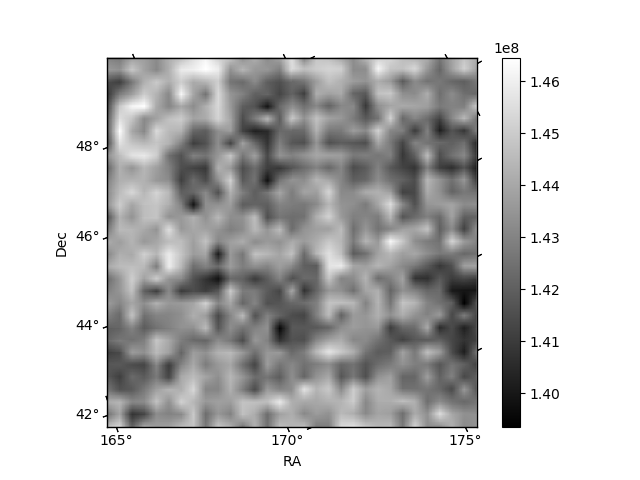
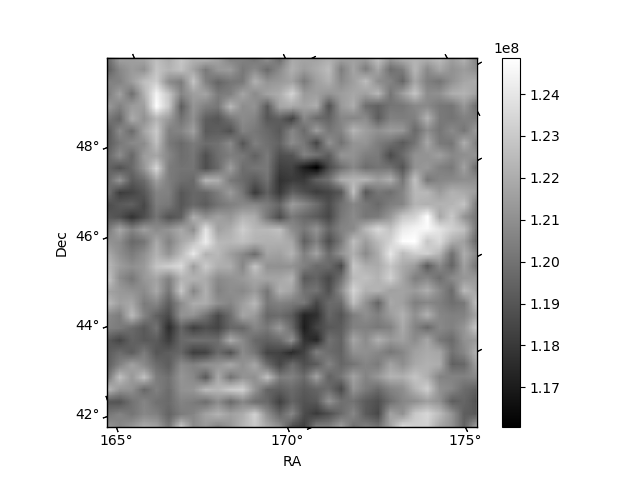
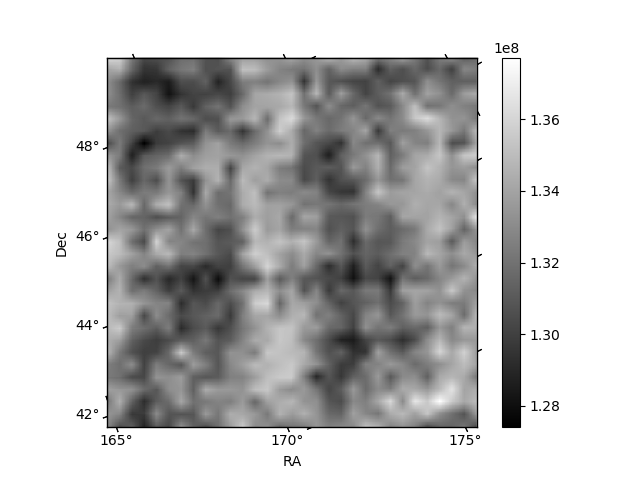
Histogram calculated using DETX and DETY for each event in the final _common_clean file
| Quadrant A | 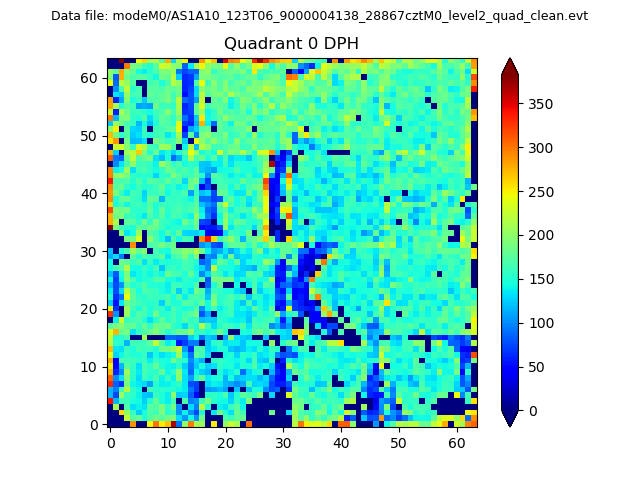 |
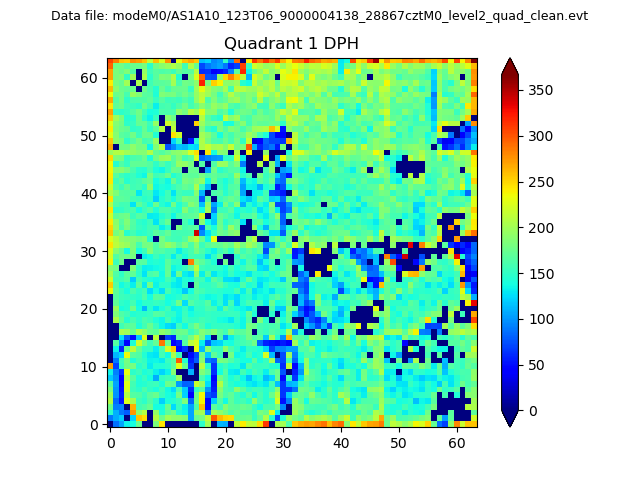 |
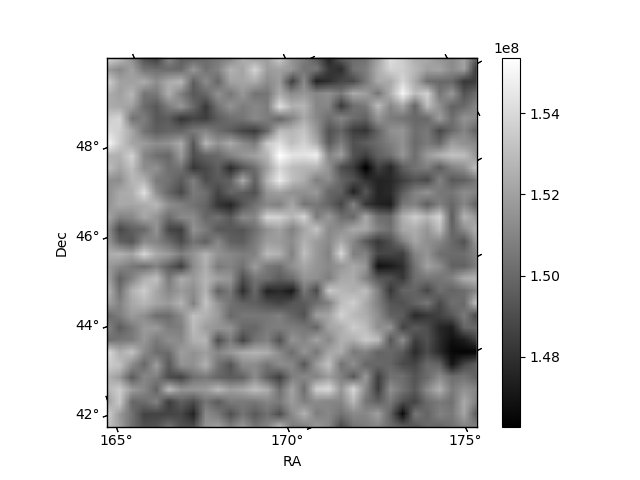
Quadrant B |
|---|---|---|---|
| Quadrant D | 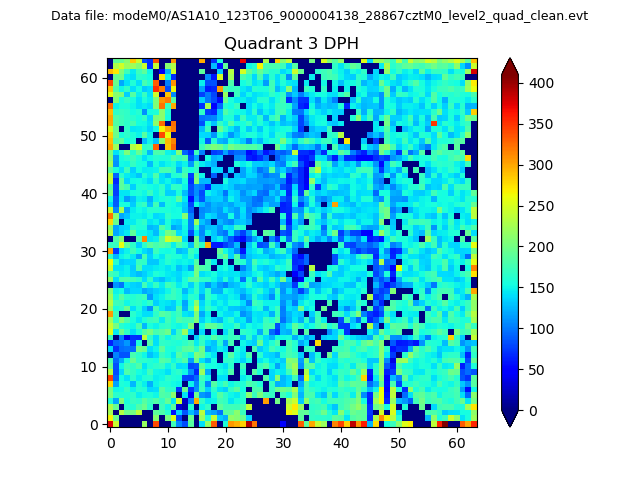 |
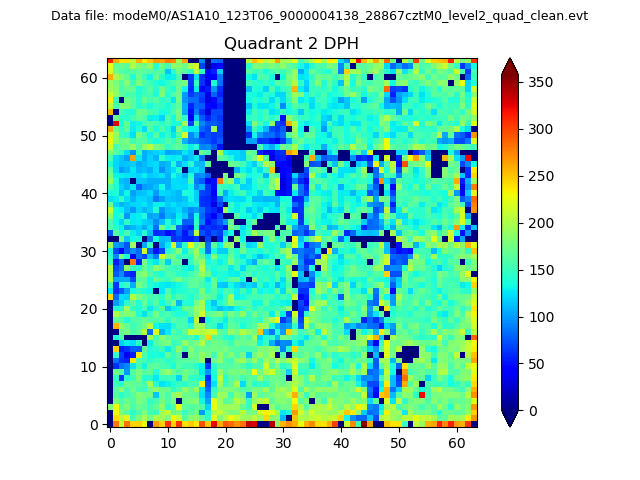 |
Quadrant C |
| Plot type | Count rate plots | Images |
|---|---|---|
| Comparison with Poisson distribution Blue bars denote a histogram of data divided into 1 sec bins. Red curve is a Poisson curve with rate = median count rate of data. |
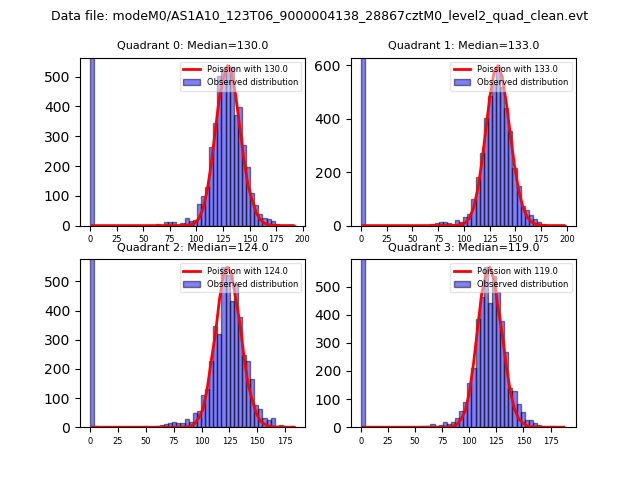 |
 |
| Quadrant-wise count rates Data is divided into 100 sec bins |
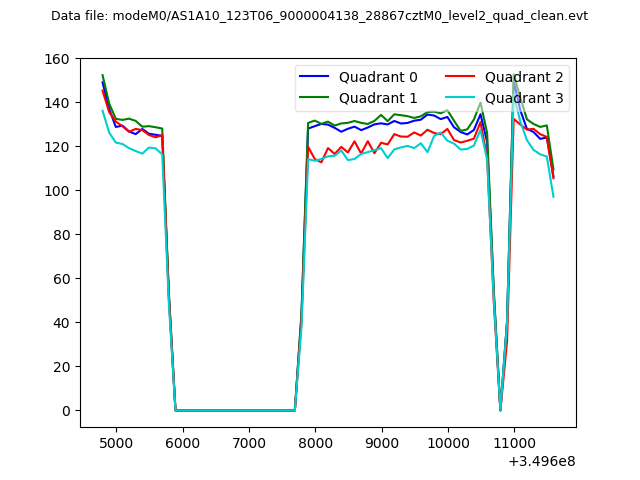 |
|
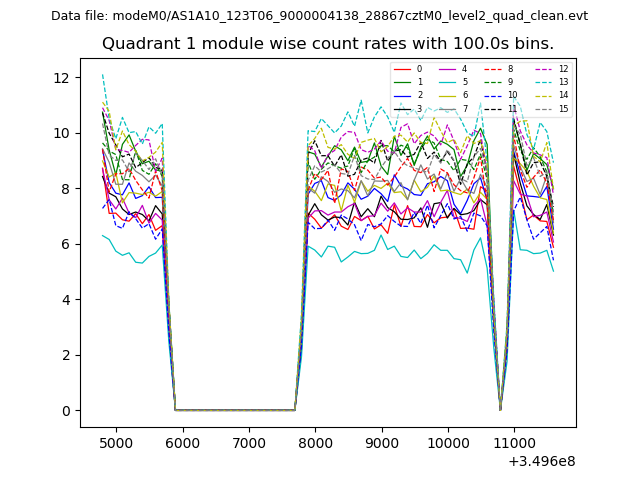
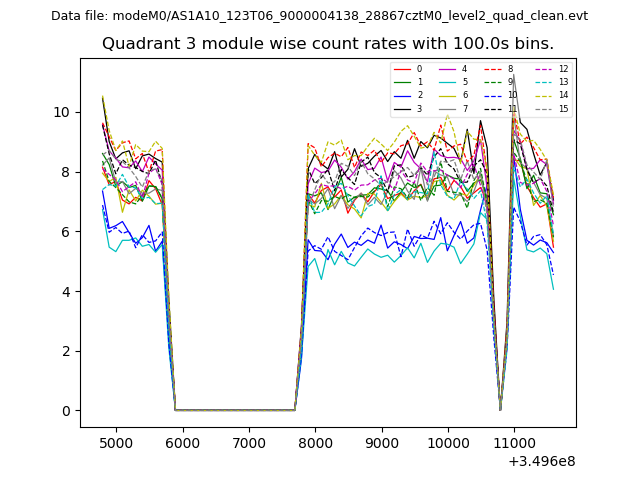
| Module-wise count rates for Quadrant A Data is divided into 100 sec bins |
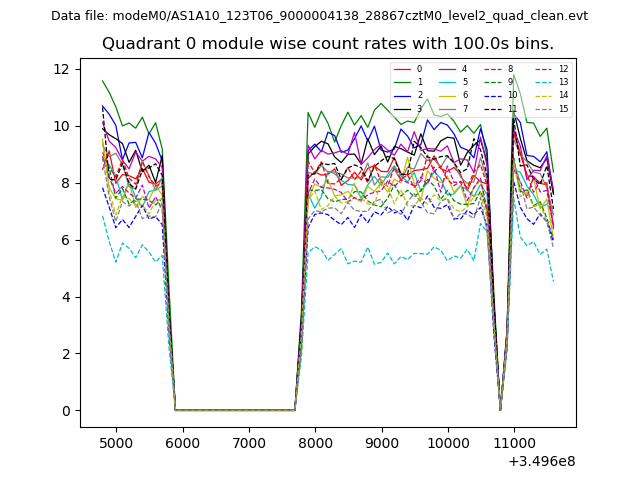 |
 |
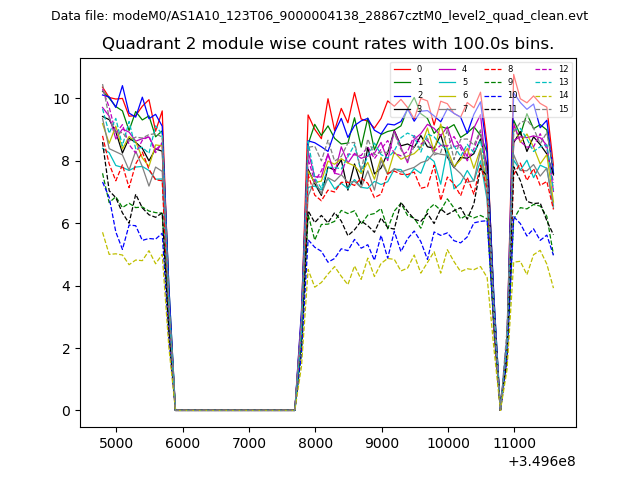
| Module-wise count rates for Quadrant B Data is divided into 100 sec bins |
 |
 |
| Module-wise count rates for Quadrant C Data is divided into 100 sec bins |
 |
 |
| Module-wise count rates for Quadrant D Data is divided into 100 sec bins |
 |
 |
| Parameter | Plot |
|---|---|
| CZT HV Monitor | 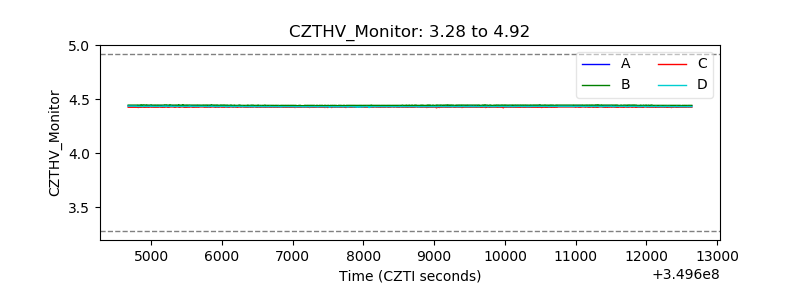 |
| D_VDD | 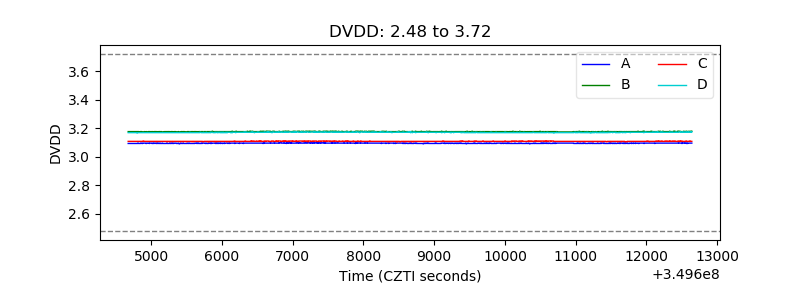 |
| Temperature 1 | 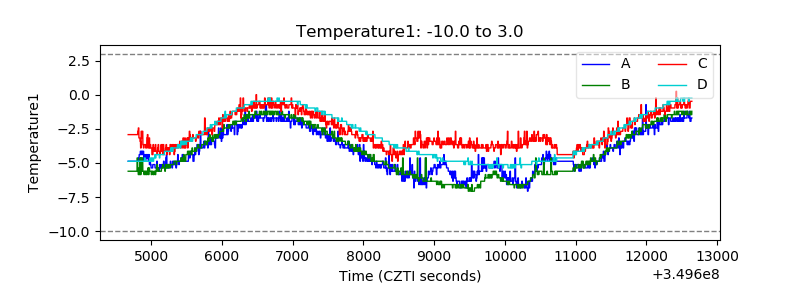 |
| Veto HV Monitor | 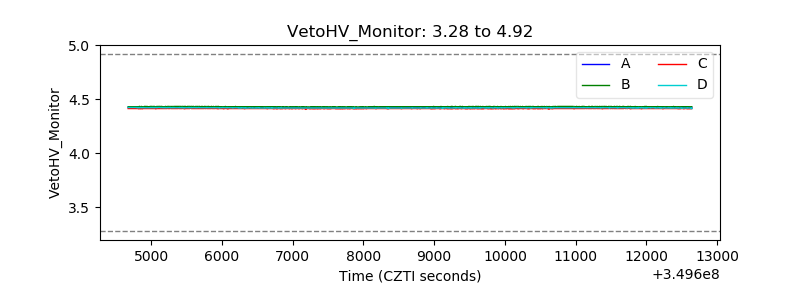 |
| Veto LLD | 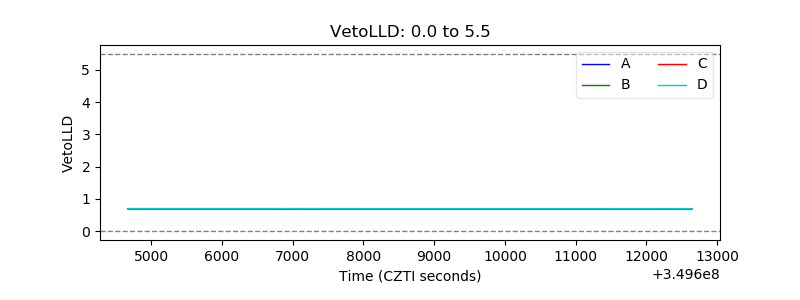 |
| Alpha Counter | 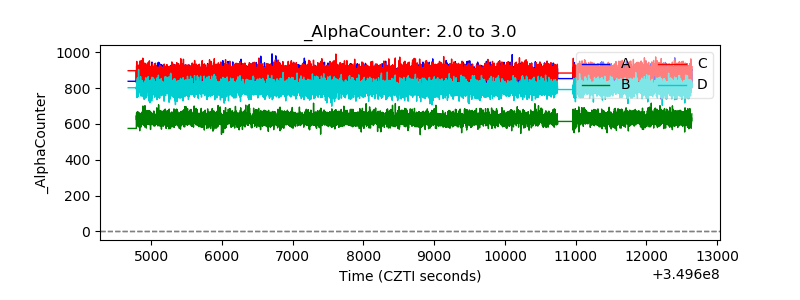 |
| _CPM_Rate | 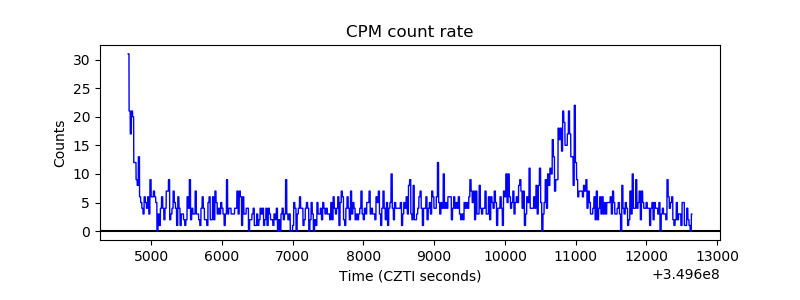 |
| CZT Counter | 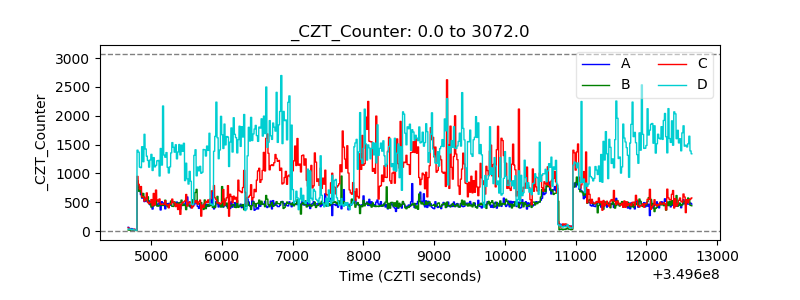 |
| +2.5 Volts monitor | 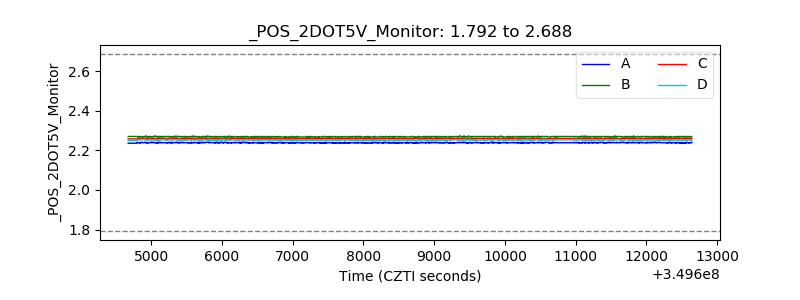 |
| +5 Volts monitor |  |
| _ROLL_ROT | 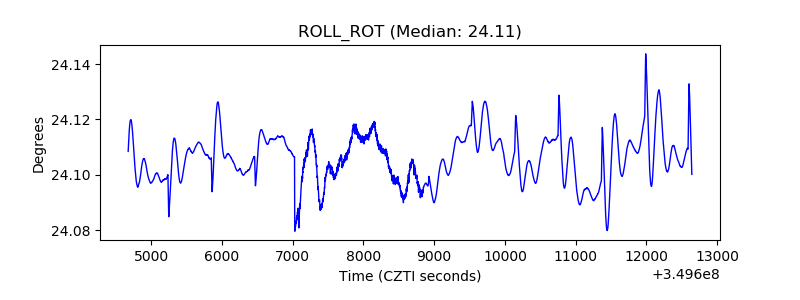 |
| _Roll_DEC |  |
| _Roll_RA | 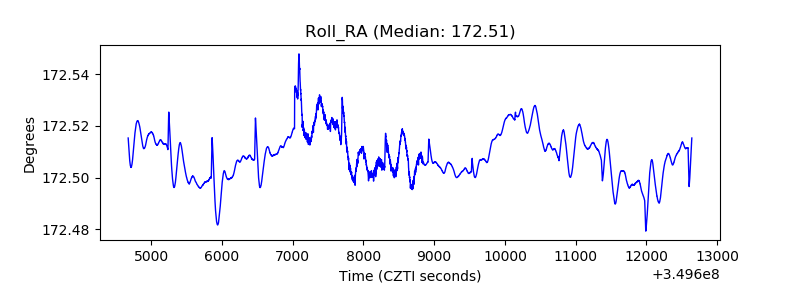 |
| Veto Counter | 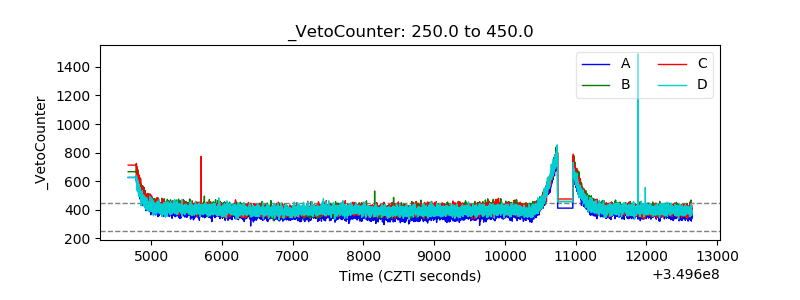 |