| Param | Original file | Final file |
|---|---|---|
| Filename | modeM0/AS1A10_123T06_9000004138_28868cztM0_level2.evt | modeM0/AS1A10_123T06_9000004138_28868cztM0_level2_quad_clean.evt |
| Size (bytes) | 753,344,640 | 89,778,240 |
| Size | 718.4 MB | 85.6 MB |
| Events in quadrant A | 4,515,753 | 551,719 |
| Events in quadrant B | 3,873,916 | 569,186 |
| Events in quadrant C | 4,225,523 | 542,638 |
| Events in quadrant D | 9,670,432 | 509,898 |
| Mode M0 | |||
|---|---|---|---|
| Quadrant | BADHDUFLAG | Total packets | Discarded packets |
| A | 0 | 18381 | 2 |
| B | 0 | 16474 | 2 |
| C | 0 | 17399 | 2 |
| D | 0 | 34043 | 2 |
| Mode SS | |||
|---|---|---|---|
| Quadrant | BADHDUFLAG | Total packets | Discarded packets |
| A | 0 | 160 | 0 |
| B | 0 | 160 | 0 |
| C | 0 | 160 | 0 |
| D | 0 | 160 | 0 |
| Mode M9 | |||
|---|---|---|---|
| Quadrant | BADHDUFLAG | Total packets | Discarded packets |
| A | 0 | 1 | 0 |
| B | 0 | 1 | 0 |
| C | 0 | 1 | 0 |
| D | 0 | 1 | 0 |
| Quadrant | Total seconds | Saturated seconds | Saturation percentage |
|---|---|---|---|
| A | 7829 | 301 | 3.844680% |
| B | 7829 | 268 | 3.423170% |
| C | 7829 | 325 | 4.151233% |
| D | 7830 | 1260 | 16.091954% |
Noise dominated data is calculated using 1-second bins in cleaned event files. If a bin has >2000 counts, and if more than 50% of those come from <1% of pixels, then it is considered to be noise-dominated and hence unusable.
| Quadrant | # 1 sec bins | Bins with >0 counts | Bins with >2000 counts | High rate bins dominated by noise | Noise dominated (total time) | Noise dominated (detector-on time) | Marked lightcurve |
|---|---|---|---|---|---|---|---|
| A | 7969 | 7829 | 73 | 73 | 0.92% | 0.93% | 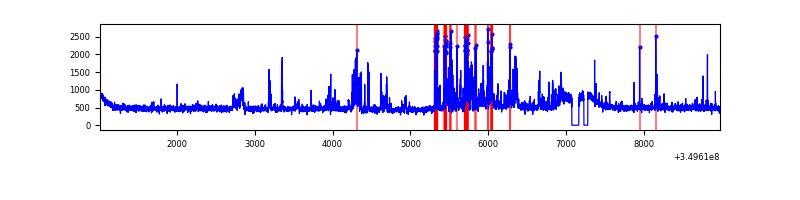 |
| B | 7969 | 7829 | 4 | 4 | 0.05% | 0.05% | 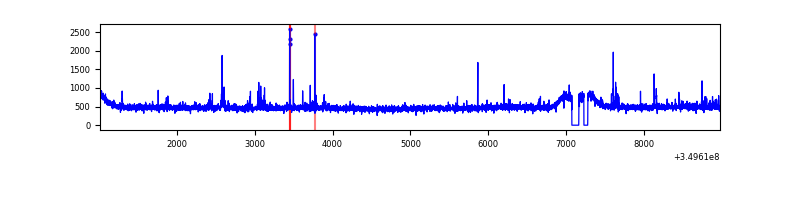 |
| C | 7969 | 7829 | 0 | 0 | 0.00% | 0.00% | 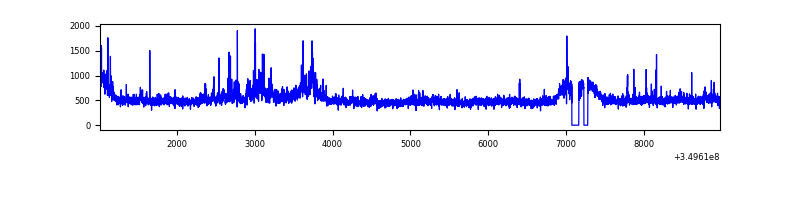 |
| D | 7970 | 7830 | 1241 | 1241 | 15.57% | 15.85% | 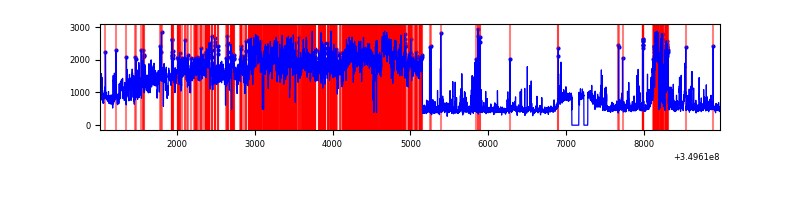 |
Top three noisy pixels from each quadrant. If the there are fewer than three noisy pixels in the level2.evt file, extra rows are filled as -1
| Pixel properties | Quadrant properties | ||||||
|---|---|---|---|---|---|---|---|
| Quadrant | DetID | PixID | Counts | Sigma | Mean | Median | Sigma |
| A | 14 | 235 | 579090 | 2948.62 | 968 | 945 | 196.1 |
| A | 1 | 113 | 150103 | 760.73 | 968 | 945 | 196.1 |
| A | 5 | 98 | 50022 | 250.3 | 968 | 945 | 196.1 |
| B | 12 | 111 | 23269 | 118.86 | 960 | 932 | 187.9 |
| B | 11 | 111 | 20726 | 105.33 | 960 | 932 | 187.9 |
| B | 15 | 201 | 19813 | 100.47 | 960 | 932 | 187.9 |
| C | 3 | 233 | 418282 | 1930.5 | 918 | 919 | 216.2 |
| C | 14 | 238 | 156707 | 720.59 | 918 | 919 | 216.2 |
| C | 4 | 254 | 54457 | 247.64 | 918 | 919 | 216.2 |
| D | 8 | 195 | 5128915 | 23425.8 | 909 | 882 | 218.9 |
| D | 7 | 80 | 677157 | 3089.35 | 909 | 882 | 218.9 |
| D | 1 | 52 | 327733 | 1493.12 | 909 | 882 | 218.9 |
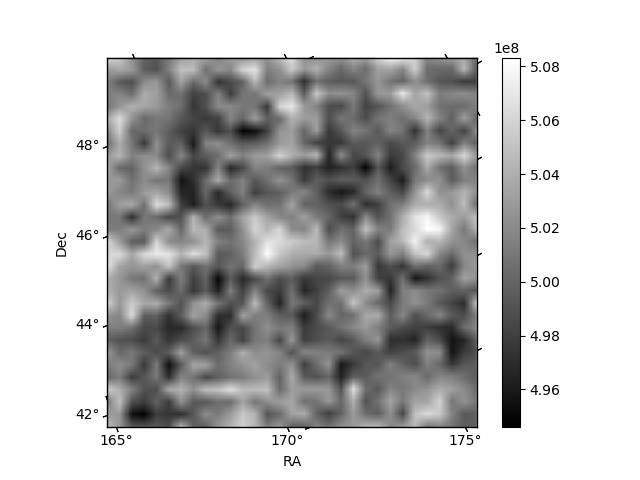
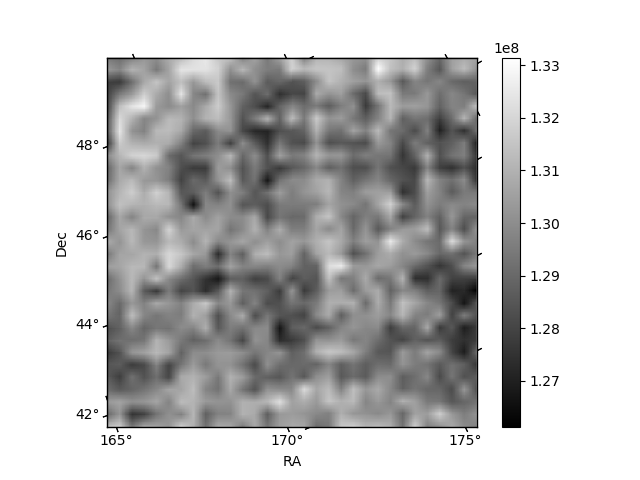
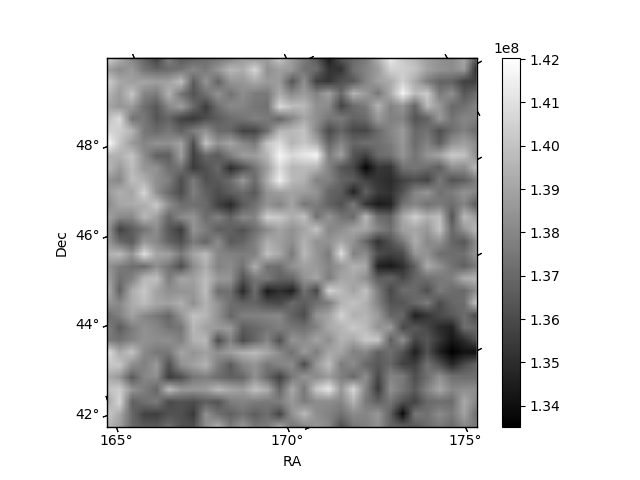
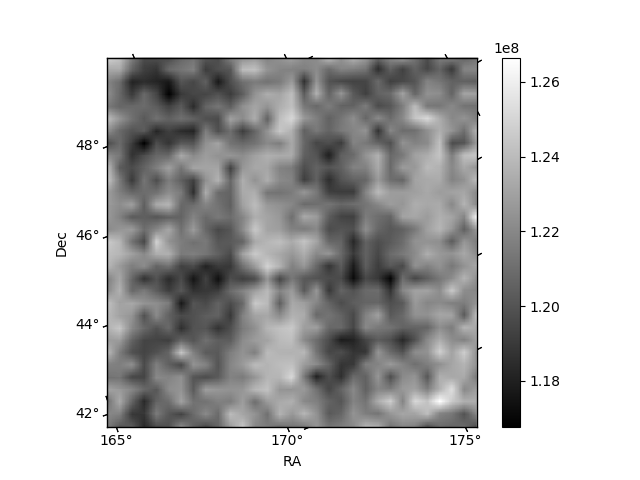
Histogram calculated using DETX and DETY for each event in the final _common_clean file
| Quadrant A | 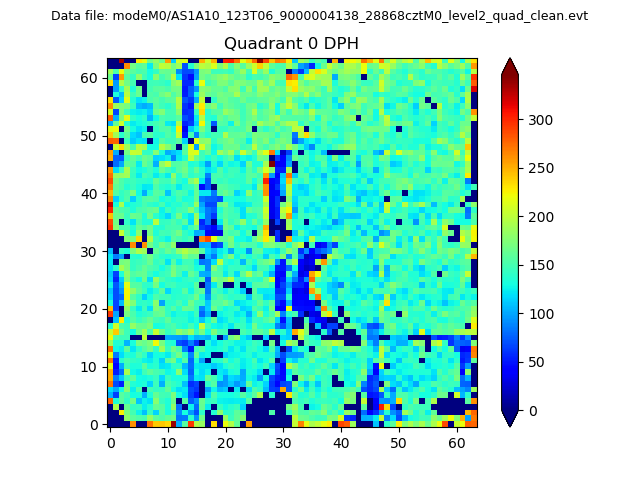 |
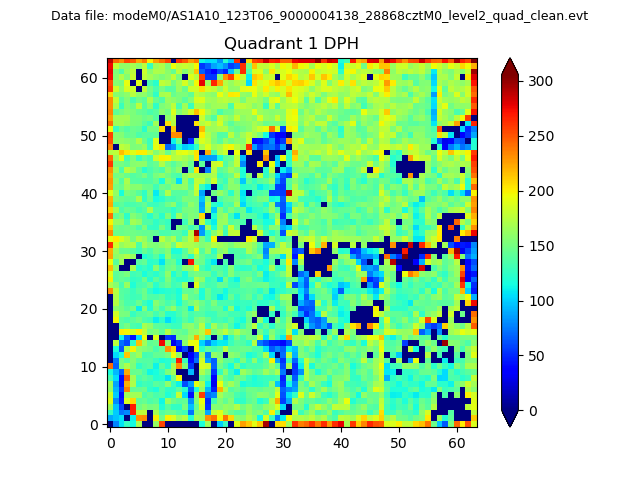 |
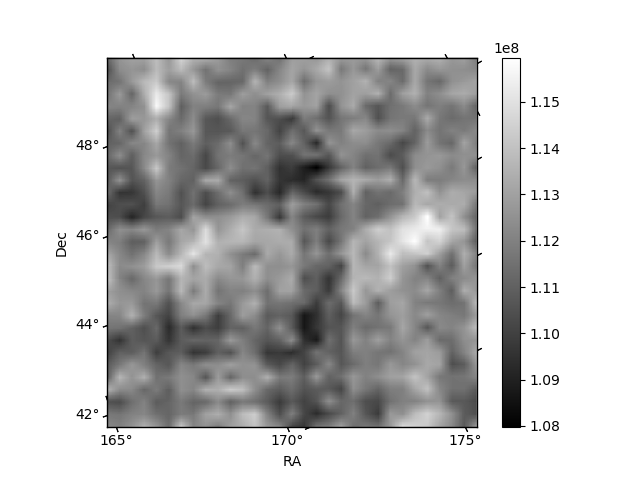
Quadrant B |
|---|---|---|---|
| Quadrant D |  |
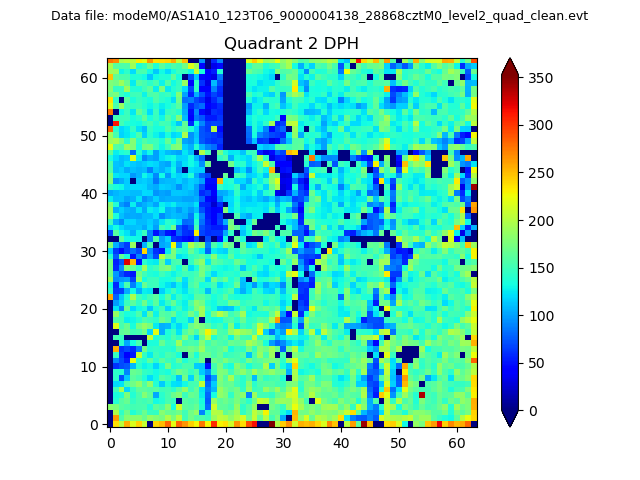 |
Quadrant C |
| Plot type | Count rate plots | Images |
|---|---|---|
| Comparison with Poisson distribution Blue bars denote a histogram of data divided into 1 sec bins. Red curve is a Poisson curve with rate = median count rate of data. |
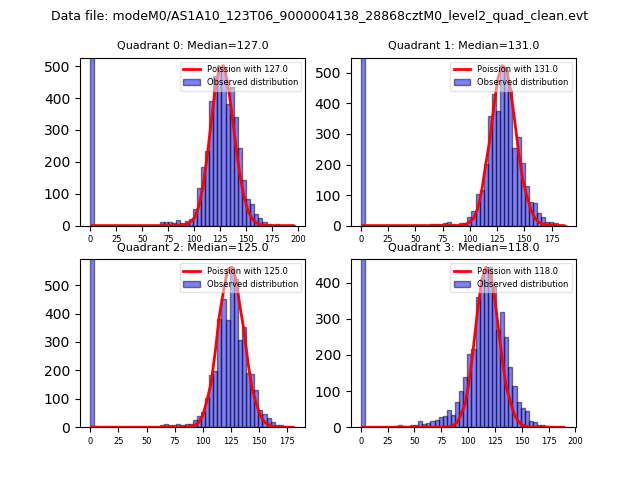 |
 |
| Quadrant-wise count rates Data is divided into 100 sec bins |
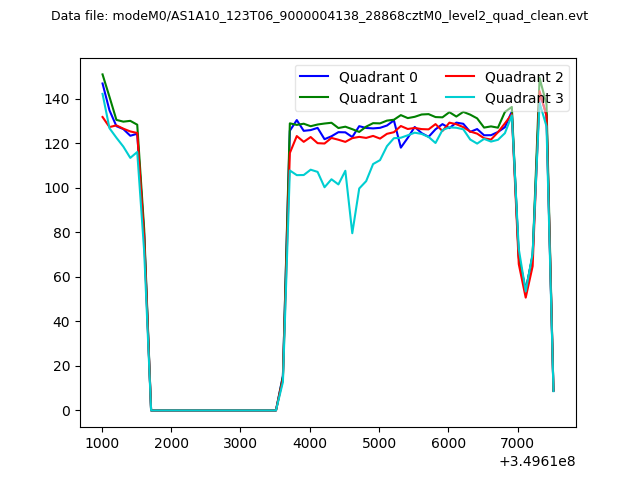 |
|
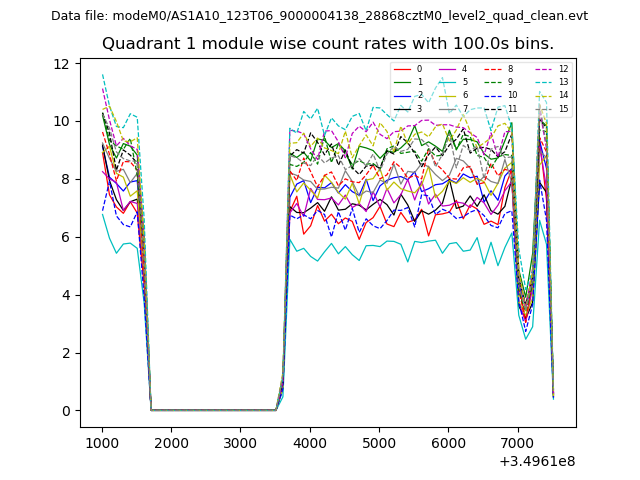
| Module-wise count rates for Quadrant A Data is divided into 100 sec bins |
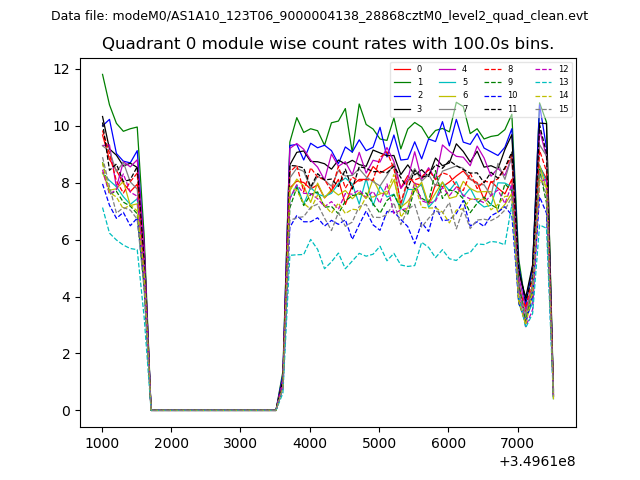 |
 |
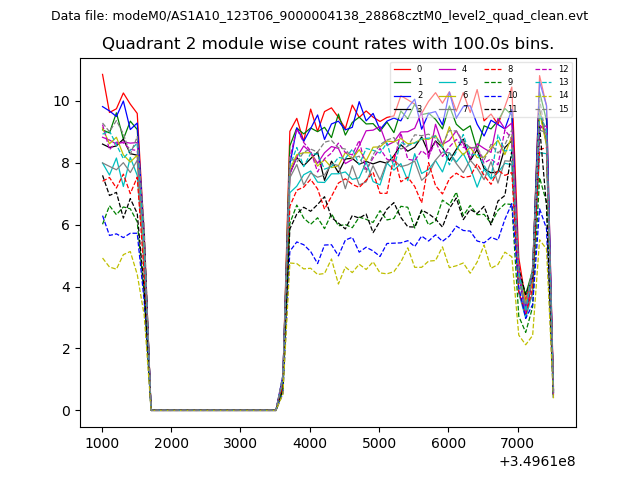
| Module-wise count rates for Quadrant B Data is divided into 100 sec bins |
 |
 |
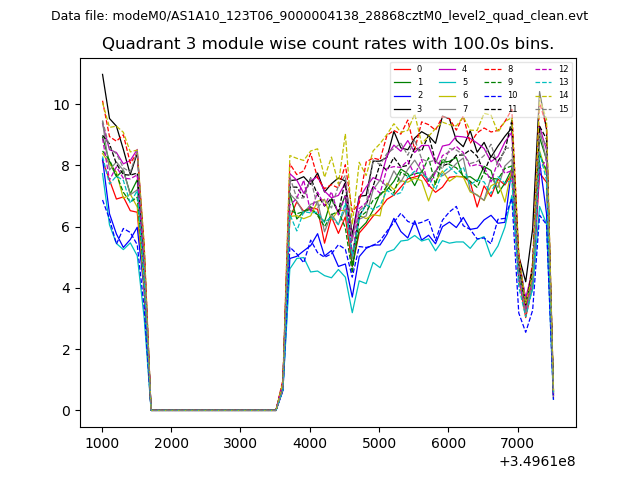
| Module-wise count rates for Quadrant C Data is divided into 100 sec bins |
 |
 |
| Module-wise count rates for Quadrant D Data is divided into 100 sec bins |
 |
 |
| Parameter | Plot |
|---|---|
| CZT HV Monitor | 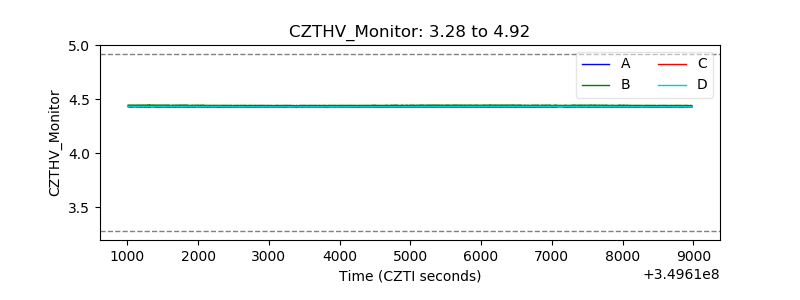 |
| D_VDD | 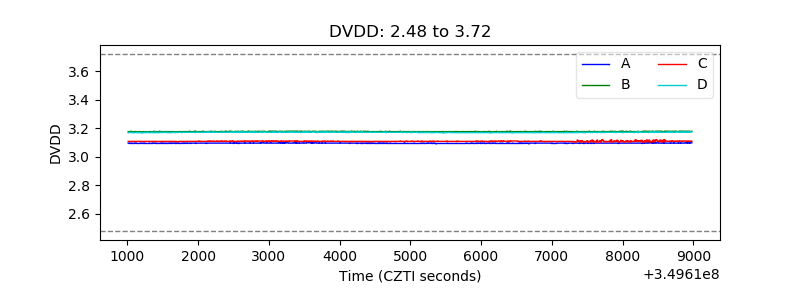 |
| Temperature 1 | 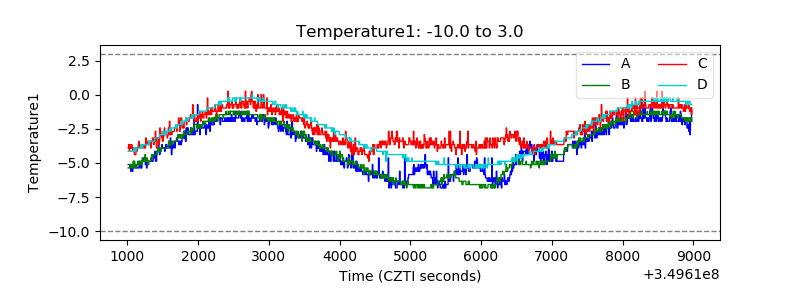 |
| Veto HV Monitor | 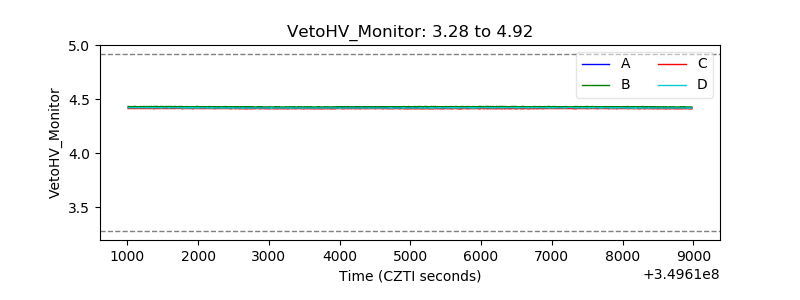 |
| Veto LLD | 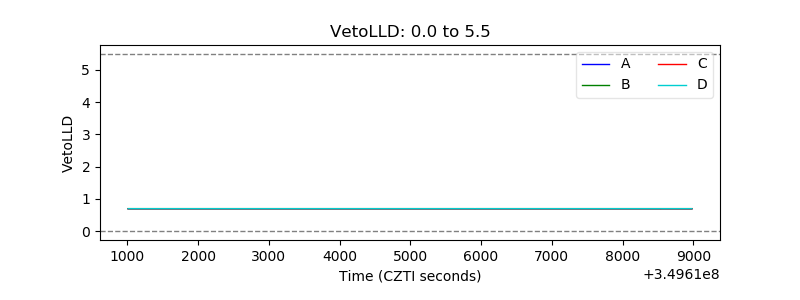 |
| Alpha Counter | 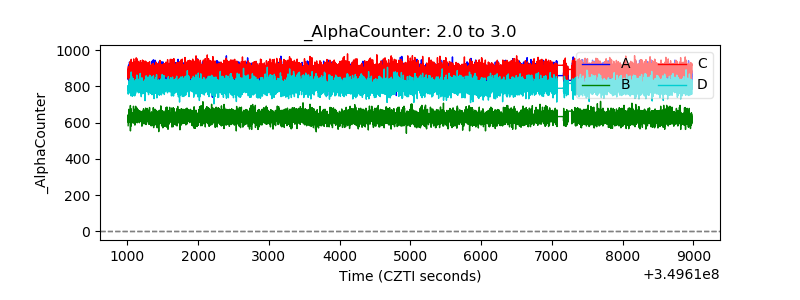 |
| _CPM_Rate | 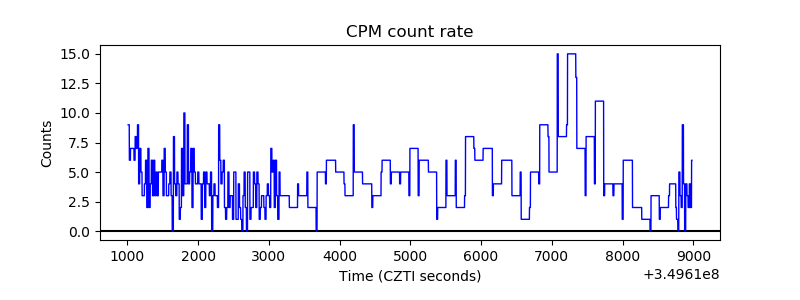 |
| CZT Counter | 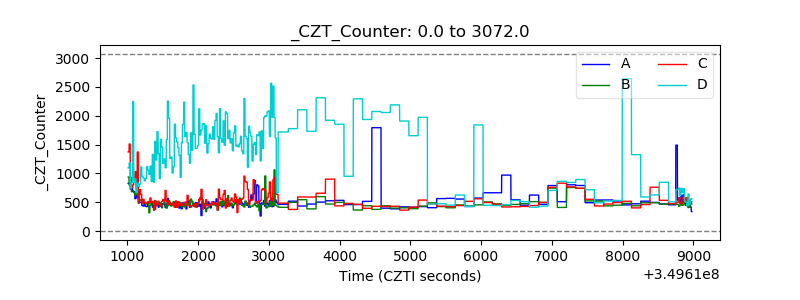 |
| +2.5 Volts monitor | 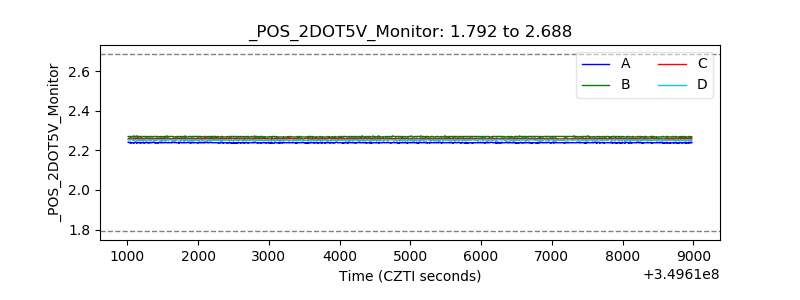 |
| +5 Volts monitor | 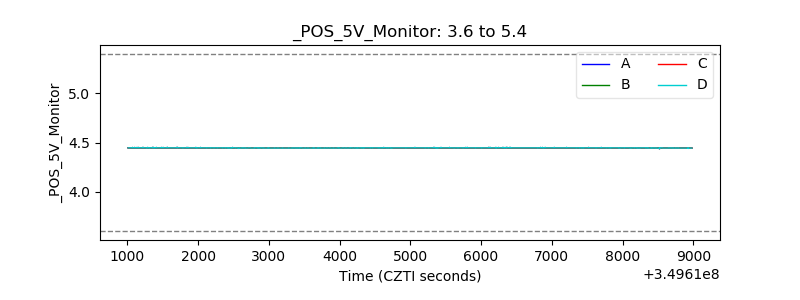 |
| _ROLL_ROT | 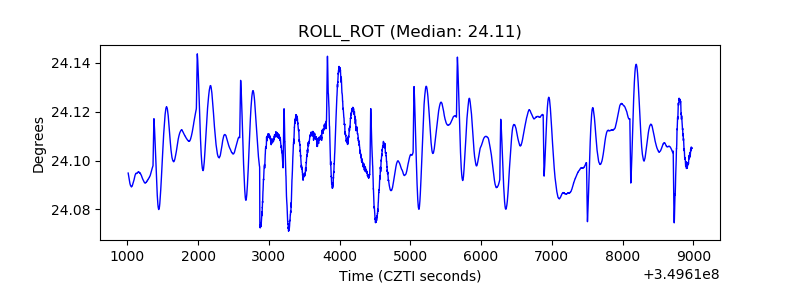 |
| _Roll_DEC | 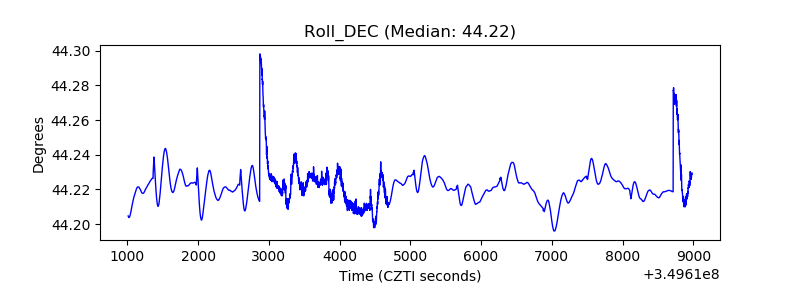 |
| _Roll_RA | 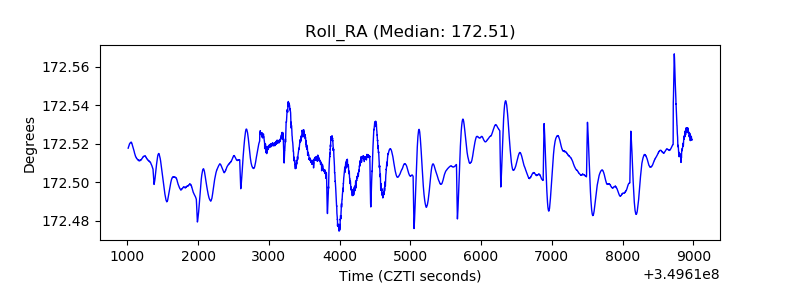 |
| Veto Counter | 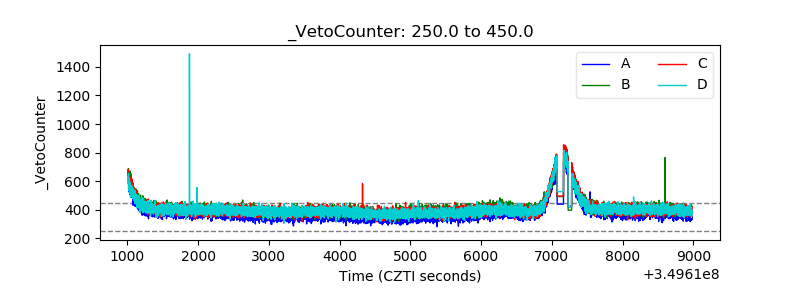 |