| Param | Original file | Final file |
|---|---|---|
| Filename | modeM0/AS1A10_123T07_9000004140cztM0_level2.fits | modeM0/AS1A10_123T07_9000004140cztM0_level2_quad_clean.evt |
| Size (bytes) | 524,344,320 | 401,408,640 |
| Size | 500.1 MB | 382.8 MB |
| Events in quadrant A | 3,299,068 | 2,254,824 |
| Events in quadrant B | 3,164,492 | 2,288,177 |
| Events in quadrant C | 3,203,664 | 2,173,671 |
| Events in quadrant D | 2,550,242 | 1,779,351 |
| Mode M9 | |||
|---|---|---|---|
| Quadrant | BADHDUFLAG | Total packets | Discarded packets |
| A | 0 | 101 | 0 |
| B | 0 | 101 | 0 |
| C | 0 | 101 | 0 |
| D | 0 | 101 | 0 |
| Mode M0 | |||
|---|---|---|---|
| Quadrant | BADHDUFLAG | Total packets | Discarded packets |
| A | 0 | 110156 | 0 |
| B | 0 | 115716 | 0 |
| C | 0 | 114534 | 0 |
| D | 0 | 234063 | 0 |
| Mode SS | |||
|---|---|---|---|
| Quadrant | BADHDUFLAG | Total packets | Discarded packets |
| A | 0 | 1092 | 0 |
| B | 0 | 1092 | 0 |
| C | 0 | 1092 | 0 |
| D | 0 | 1092 | 0 |
| Quadrant | Total seconds | Saturated seconds | Saturation percentage |
|---|---|---|---|
| A | 53301 | 366 | 0.686666% |
| B | 53301 | 719 | 1.348943% |
| C | 53301 | 1144 | 2.146301% |
| D | 53301 | 9459 | 17.746384% |
Noise dominated data is calculated using 1-second bins in cleaned event files. If a bin has >2000 counts, and if more than 50% of those come from <1% of pixels, then it is considered to be noise-dominated and hence unusable.
| Quadrant | # 1 sec bins | Bins with >0 counts | Bins with >2000 counts | High rate bins dominated by noise | Noise dominated (total time) | Noise dominated (detector-on time) | Marked lightcurve |
|---|---|---|---|---|---|---|---|
| A | 63666 | 53293 | 0 | 0 | 0.00% | 0.00% |  |
| B | 63666 | 53293 | 0 | 0 | 0.00% | 0.00% |  |
| C | 63665 | 53284 | 0 | 0 | 0.00% | 0.00% |  |
| D | 63666 | 53013 | 0 | 0 | 0.00% | 0.00% |  |
Top three noisy pixels from each quadrant. If the there are fewer than three noisy pixels in the level2.evt file, extra rows are filled as -1
| Pixel properties | Quadrant properties | ||||||
|---|---|---|---|---|---|---|---|
| Quadrant | DetID | PixID | Counts | Sigma | Mean | Median | Sigma |
| A | 0 | 29 | 3143 | 10.99 | 861 | 811 | 212.2 |
| A | 7 | 110 | 2618 | 8.52 | 861 | 811 | 212.2 |
| A | 0 | 30 | 2537 | 8.13 | 861 | 811 | 212.2 |
| B | 2 | 9 | 2686 | 11.38 | 838 | 801 | 165.7 |
| B | 2 | 8 | 2185 | 8.35 | 838 | 801 | 165.7 |
| B | 3 | 80 | 2067 | 7.64 | 838 | 801 | 165.7 |
| C | 1 | 81 | 2443 | 7.65 | 846 | 794 | 215.6 |
| C | 1 | 80 | 2417 | 7.53 | 846 | 794 | 215.6 |
| C | 12 | 241 | 2305 | 7.01 | 846 | 794 | 215.6 |
| D | 15 | 46 | 1884 | 6.26 | 728 | 664 | 194.9 |
| D | 7 | 3 | 1875 | 6.21 | 728 | 664 | 194.9 |
| D | 6 | 67 | 1843 | 6.05 | 728 | 664 | 194.9 |
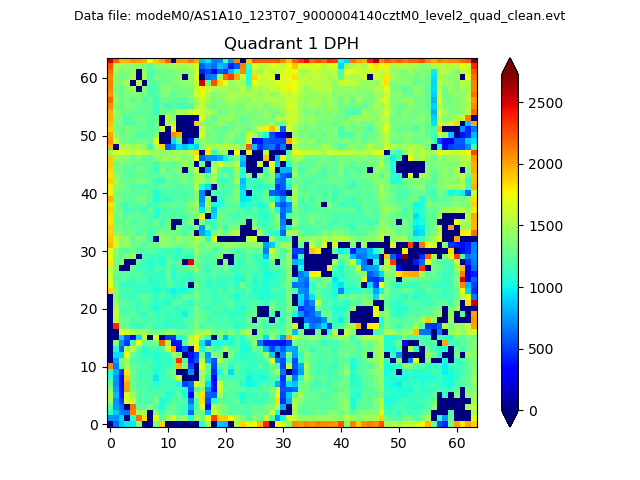
Histogram calculated using DETX and DETY for each event in the final _common_clean file
| Quadrant A |  |
 |
Quadrant B |
|---|---|---|---|
| Quadrant D | 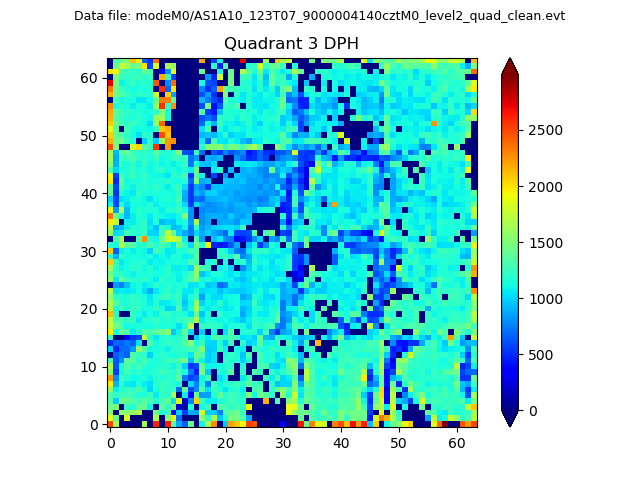 |
 |
Quadrant C |
| Plot type | Count rate plots | Images |
|---|---|---|
| Comparison with Poisson distribution Blue bars denote a histogram of data divided into 1 sec bins. Red curve is a Poisson curve with rate = median count rate of data. |
 |
 |
| Quadrant-wise count rates Data is divided into 100 sec bins |
 |
|
| Module-wise count rates for Quadrant A Data is divided into 100 sec bins |
 |
 |
| Module-wise count rates for Quadrant B Data is divided into 100 sec bins |
 |
 |
| Module-wise count rates for Quadrant C Data is divided into 100 sec bins |
 |
 |
| Module-wise count rates for Quadrant D Data is divided into 100 sec bins |
 |
 |
| Parameter | Plot |
|---|---|
| CZT HV Monitor |  |
| D_VDD | 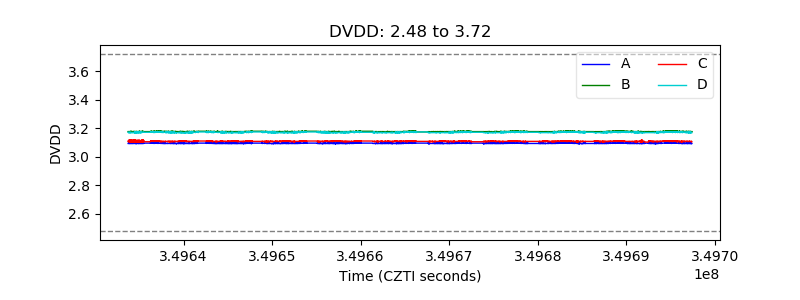 |
| Temperature 1 |  |
| Veto HV Monitor |  |
| Veto LLD |  |
| Alpha Counter |  |
| _CPM_Rate |  |
| CZT Counter |  |
| +2.5 Volts monitor |  |
| +5 Volts monitor |  |
| _ROLL_ROT |  |
| _Roll_DEC |  |
| _Roll_RA |  |
| Veto Counter |  |