| Param | Original file | Final file |
|---|---|---|
| Filename | modeM0/AS1A10_123T07_9000004140_28871cztM0_level2.evt | modeM0/AS1A10_123T07_9000004140_28871cztM0_level2_quad_clean.evt |
| Size (bytes) | 318,908,160 | 41,408,640 |
| Size | 304.1 MB | 39.5 MB |
| Events in quadrant A | 1,697,835 | 263,034 |
| Events in quadrant B | 1,792,023 | 268,700 |
| Events in quadrant C | 1,748,108 | 259,005 |
| Events in quadrant D | 4,187,396 | 220,712 |
| Mode M9 | |||
|---|---|---|---|
| Quadrant | BADHDUFLAG | Total packets | Discarded packets |
| A | 0 | 7 | 0 |
| B | 0 | 7 | 0 |
| C | 0 | 7 | 0 |
| D | 0 | 7 | 0 |
| Mode M0 | |||
|---|---|---|---|
| Quadrant | BADHDUFLAG | Total packets | Discarded packets |
| A | 0 | 7063 | 1 |
| B | 0 | 7354 | 1 |
| C | 0 | 7195 | 1 |
| D | 0 | 14781 | 1 |
| Mode SS | |||
|---|---|---|---|
| Quadrant | BADHDUFLAG | Total packets | Discarded packets |
| A | 0 | 72 | 0 |
| B | 0 | 72 | 0 |
| C | 0 | 72 | 0 |
| D | 0 | 72 | 0 |
| Quadrant | Total seconds | Saturated seconds | Saturation percentage |
|---|---|---|---|
| A | 3406 | 52 | 1.526718% |
| B | 3406 | 68 | 1.996477% |
| C | 3406 | 97 | 2.847915% |
| D | 3406 | 689 | 20.229008% |
Noise dominated data is calculated using 1-second bins in cleaned event files. If a bin has >2000 counts, and if more than 50% of those come from <1% of pixels, then it is considered to be noise-dominated and hence unusable.
| Quadrant | # 1 sec bins | Bins with >0 counts | Bins with >2000 counts | High rate bins dominated by noise | Noise dominated (total time) | Noise dominated (detector-on time) | Marked lightcurve |
|---|---|---|---|---|---|---|---|
| A | 4141 | 3406 | 0 | 0 | 0.00% | 0.00% | 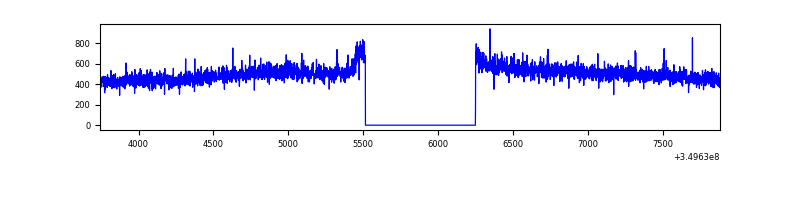 |
| B | 4141 | 3406 | 10 | 10 | 0.24% | 0.29% | 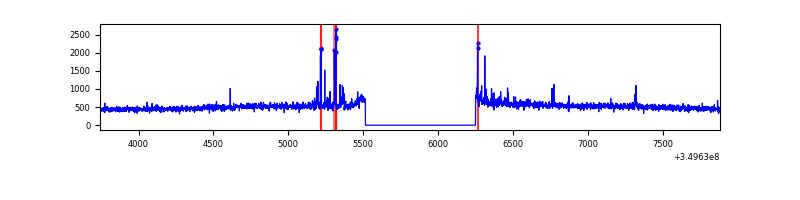 |
| C | 4141 | 3406 | 0 | 0 | 0.00% | 0.00% | 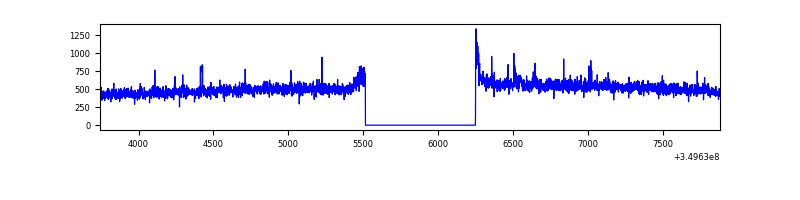 |
| D | 4141 | 3406 | 571 | 571 | 13.79% | 16.76% | 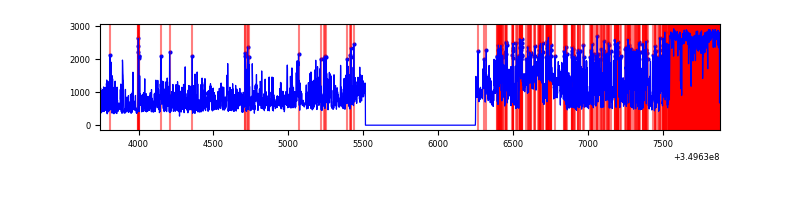 |
Top three noisy pixels from each quadrant. If the there are fewer than three noisy pixels in the level2.evt file, extra rows are filled as -1
| Pixel properties | Quadrant properties | ||||||
|---|---|---|---|---|---|---|---|
| Quadrant | DetID | PixID | Counts | Sigma | Mean | Median | Sigma |
| A | 13 | 254 | 6087 | 63.04 | 437 | 427 | 89.8 |
| A | 3 | 137 | 4379 | 44.02 | 437 | 427 | 89.8 |
| A | 0 | 226 | 3740 | 36.9 | 437 | 427 | 89.8 |
| B | 10 | 245 | 50429 | 583.31 | 431 | 418 | 85.7 |
| B | 5 | 255 | 20534 | 234.62 | 431 | 418 | 85.7 |
| B | 0 | 190 | 13507 | 152.66 | 431 | 418 | 85.7 |
| C | 14 | 238 | 75164 | 751.47 | 416 | 417 | 99.5 |
| C | 3 | 233 | 29609 | 293.48 | 416 | 417 | 99.5 |
| C | 14 | 254 | 13133 | 127.84 | 416 | 417 | 99.5 |
| D | 8 | 195 | 1898684 | 20165.64 | 389 | 376 | 94.1 |
| D | 7 | 80 | 688170 | 7306.4 | 389 | 376 | 94.1 |
| D | 1 | 52 | 85993 | 909.5 | 389 | 376 | 94.1 |
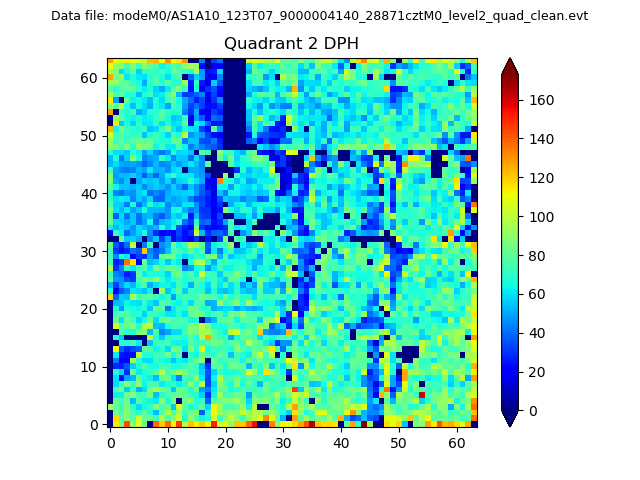
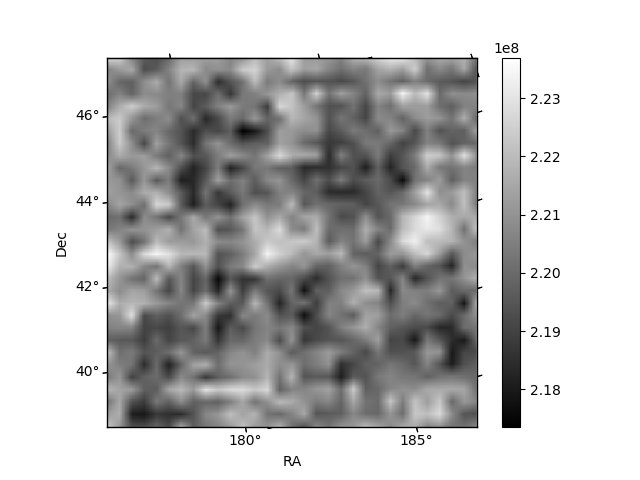
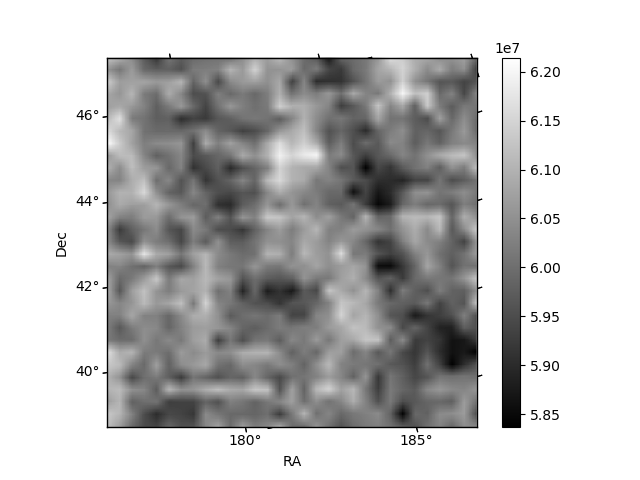
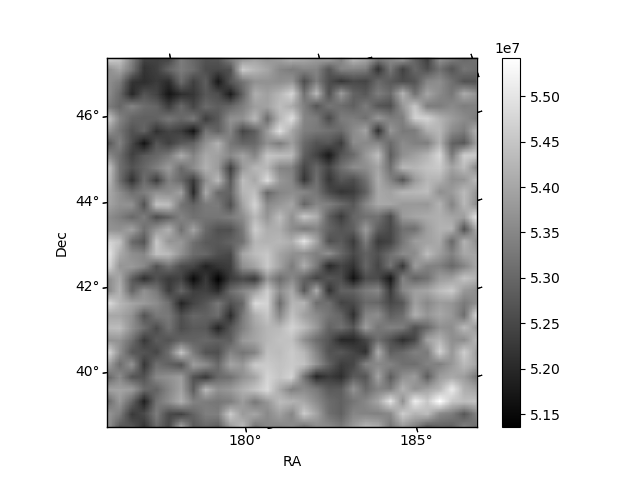
Histogram calculated using DETX and DETY for each event in the final _common_clean file
| Quadrant A | 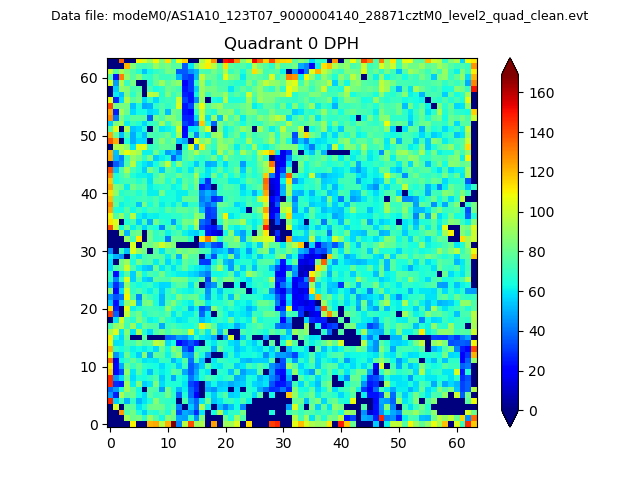 |
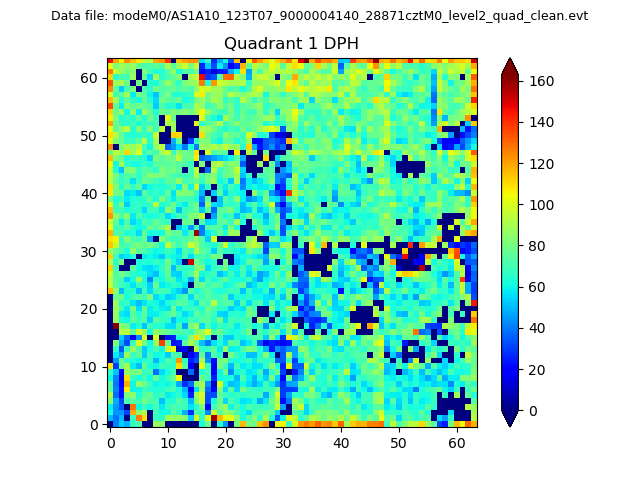 |
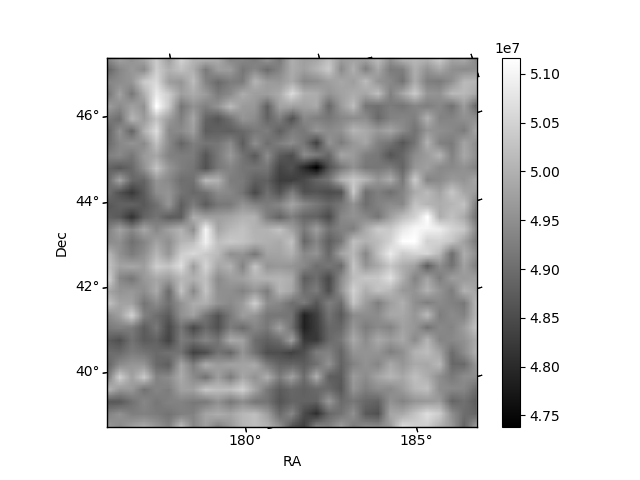
Quadrant B |
|---|---|---|---|
| Quadrant D | 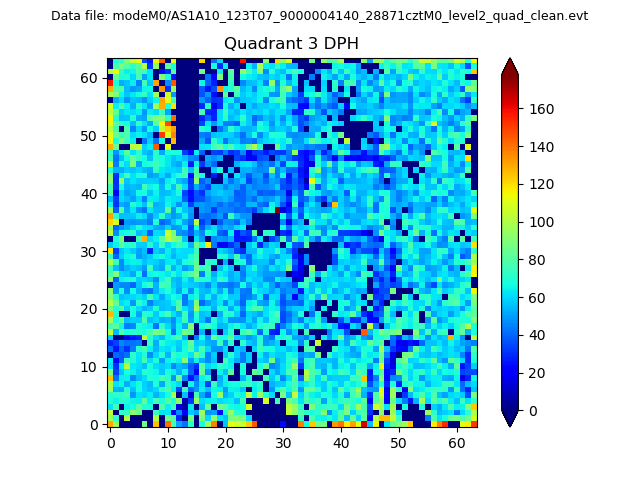 |
 |
Quadrant C |
| Plot type | Count rate plots | Images |
|---|---|---|
| Comparison with Poisson distribution Blue bars denote a histogram of data divided into 1 sec bins. Red curve is a Poisson curve with rate = median count rate of data. |
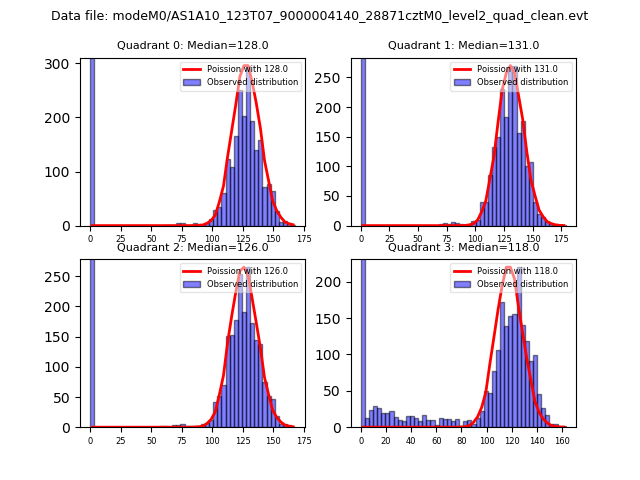 |
 |
| Quadrant-wise count rates Data is divided into 100 sec bins |
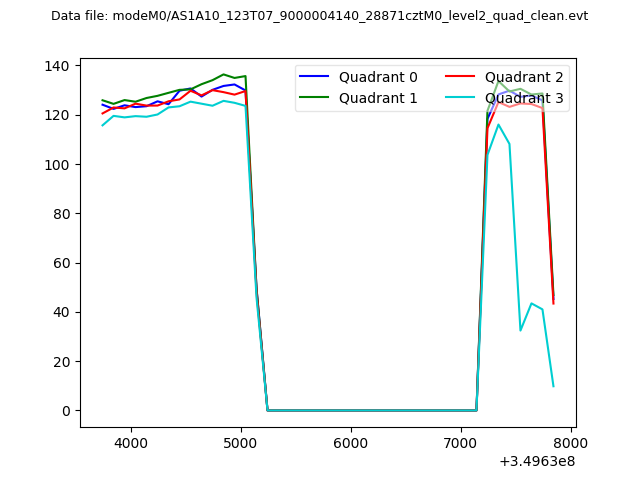 |
|
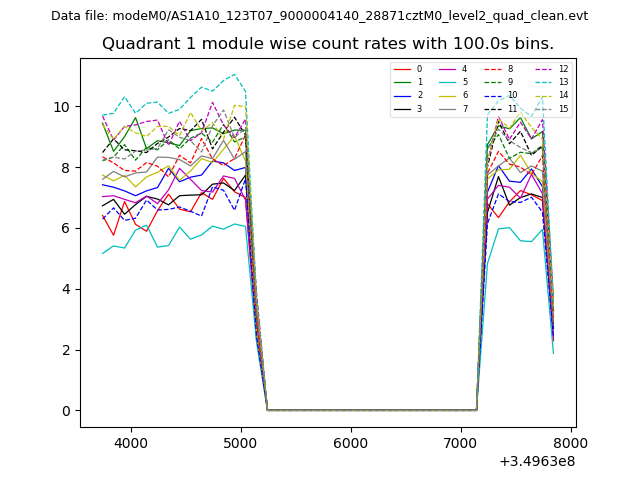
| Module-wise count rates for Quadrant A Data is divided into 100 sec bins |
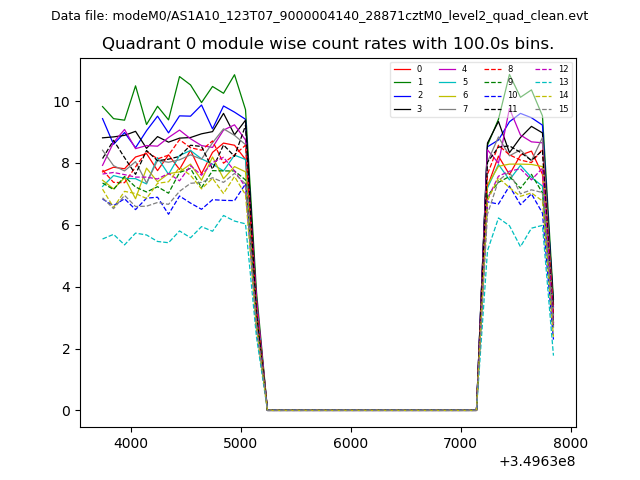 |
 |
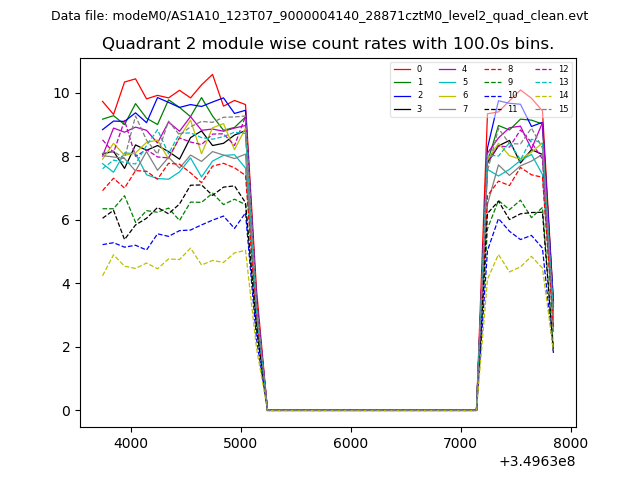
| Module-wise count rates for Quadrant B Data is divided into 100 sec bins |
 |
 |
| Module-wise count rates for Quadrant C Data is divided into 100 sec bins |
 |
 |
| Module-wise count rates for Quadrant D Data is divided into 100 sec bins |
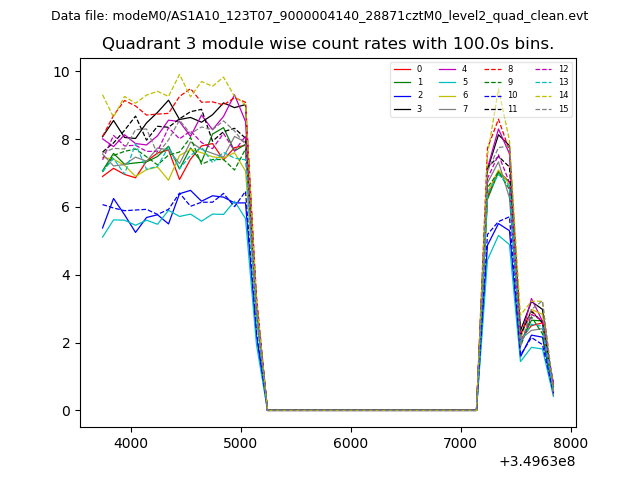 |
 |
| Parameter | Plot |
|---|---|
| CZT HV Monitor | 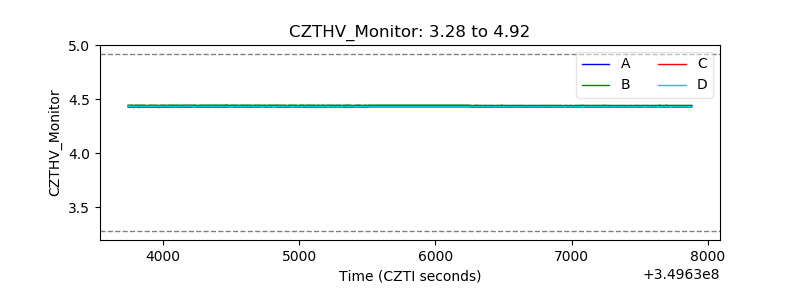 |
| D_VDD |  |
| Temperature 1 |  |
| Veto HV Monitor | 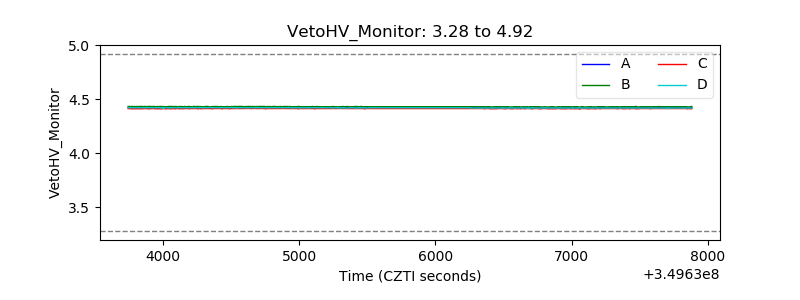 |
| Veto LLD |  |
| Alpha Counter | 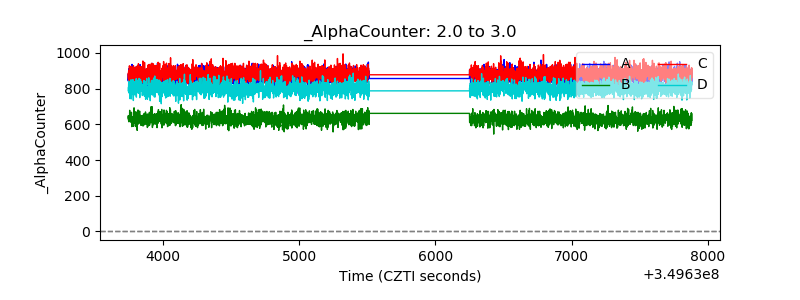 |
| _CPM_Rate | 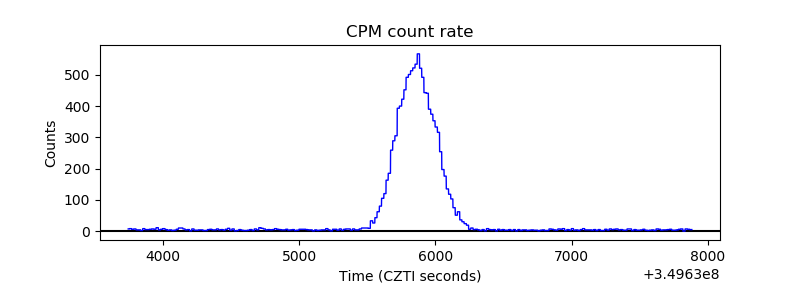 |
| CZT Counter | 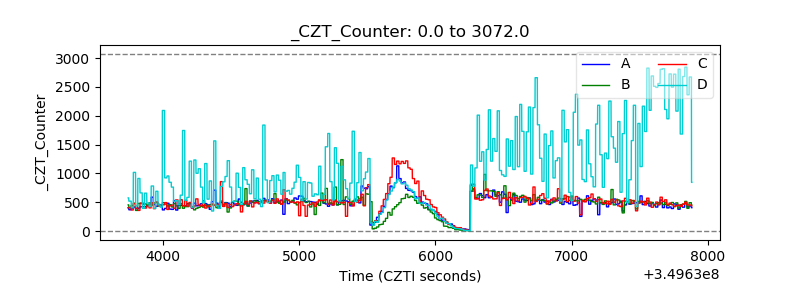 |
| +2.5 Volts monitor |  |
| +5 Volts monitor |  |
| _ROLL_ROT | 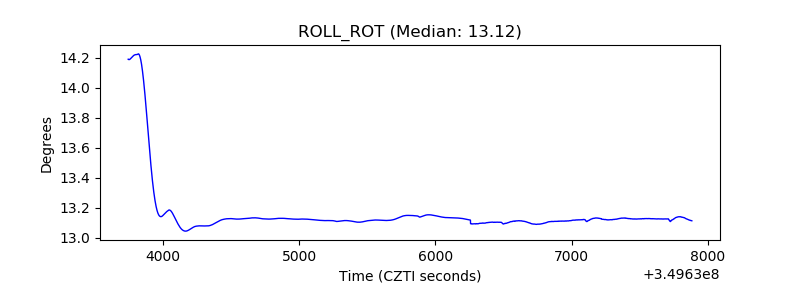 |
| _Roll_DEC | 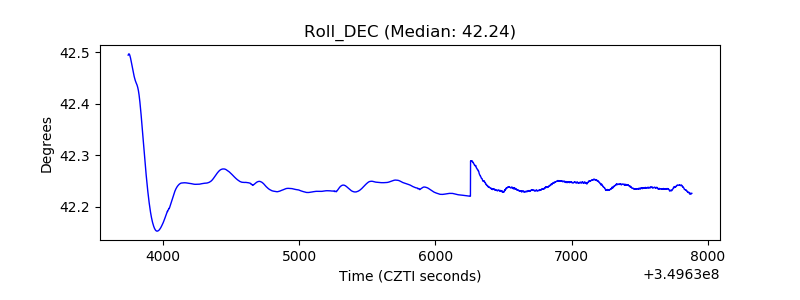 |
| _Roll_RA | 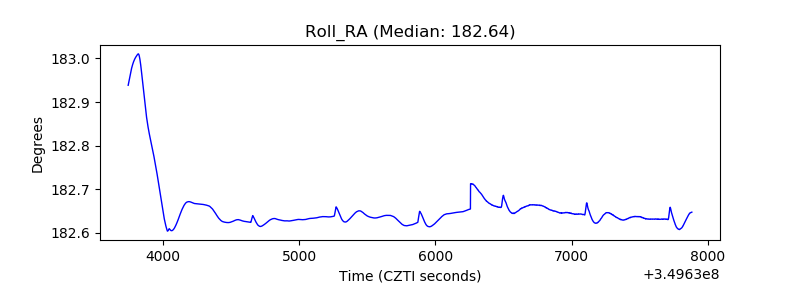 |
| Veto Counter | 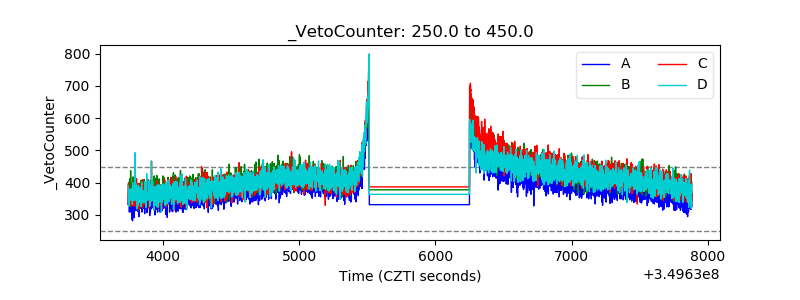 |