| Param | Original file | Final file |
|---|---|---|
| Filename | modeM0/AS1A10_123T07_9000004140_28872cztM0_level2.evt | modeM0/AS1A10_123T07_9000004140_28872cztM0_level2_quad_clean.evt |
| Size (bytes) | 589,311,360 | 91,048,320 |
| Size | 562.0 MB | 86.8 MB |
| Events in quadrant A | 3,259,498 | 587,212 |
| Events in quadrant B | 4,183,149 | 590,684 |
| Events in quadrant C | 3,377,598 | 575,798 |
| Events in quadrant D | 6,562,300 | 525,374 |
| Mode M9 | |||
|---|---|---|---|
| Quadrant | BADHDUFLAG | Total packets | Discarded packets |
| A | 0 | 11 | 0 |
| B | 0 | 12 | 0 |
| C | 0 | 12 | 0 |
| D | 0 | 12 | 0 |
| Mode M0 | |||
|---|---|---|---|
| Quadrant | BADHDUFLAG | Total packets | Discarded packets |
| A | 0 | 14181 | 2 |
| B | 0 | 17002 | 2 |
| C | 0 | 14444 | 2 |
| D | 0 | 24186 | 2 |
| Mode SS | |||
|---|---|---|---|
| Quadrant | BADHDUFLAG | Total packets | Discarded packets |
| A | 0 | 140 | 0 |
| B | 0 | 140 | 0 |
| C | 0 | 140 | 0 |
| D | 0 | 140 | 0 |
| Quadrant | Total seconds | Saturated seconds | Saturation percentage |
|---|---|---|---|
| A | 6856 | 40 | 0.583431% |
| B | 6856 | 219 | 3.194282% |
| C | 6856 | 125 | 1.823221% |
| D | 6856 | 819 | 11.945741% |
Noise dominated data is calculated using 1-second bins in cleaned event files. If a bin has >2000 counts, and if more than 50% of those come from <1% of pixels, then it is considered to be noise-dominated and hence unusable.
| Quadrant | # 1 sec bins | Bins with >0 counts | Bins with >2000 counts | High rate bins dominated by noise | Noise dominated (total time) | Noise dominated (detector-on time) | Marked lightcurve |
|---|---|---|---|---|---|---|---|
| A | 7756 | 6856 | 0 | 0 | 0.00% | 0.00% |  |
| B | 7756 | 6856 | 87 | 87 | 1.12% | 1.27% | 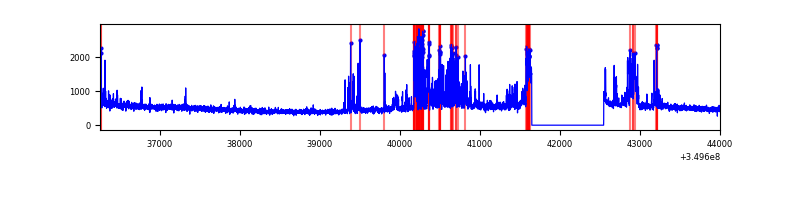 |
| C | 7756 | 6856 | 0 | 0 | 0.00% | 0.00% | 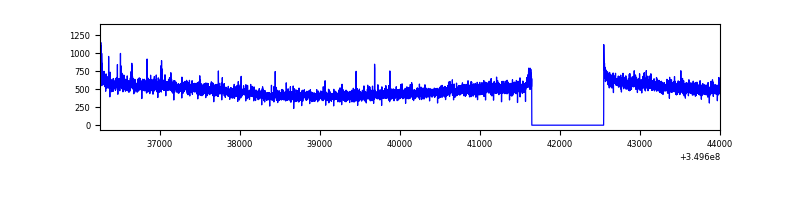 |
| D | 7756 | 6856 | 771 | 771 | 9.94% | 11.25% | 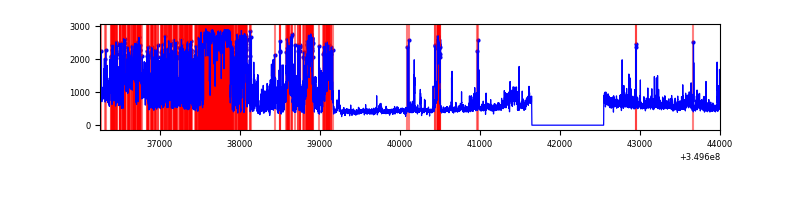 |
Top three noisy pixels from each quadrant. If the there are fewer than three noisy pixels in the level2.evt file, extra rows are filled as -1
| Pixel properties | Quadrant properties | ||||||
|---|---|---|---|---|---|---|---|
| Quadrant | DetID | PixID | Counts | Sigma | Mean | Median | Sigma |
| A | 13 | 254 | 15222 | 85.32 | 839 | 823 | 168.8 |
| A | 3 | 137 | 8317 | 44.41 | 839 | 823 | 168.8 |
| A | 0 | 226 | 6988 | 36.53 | 839 | 823 | 168.8 |
| B | 10 | 246 | 437632 | 2764.96 | 828 | 807 | 158.0 |
| B | 10 | 245 | 425800 | 2690.07 | 828 | 807 | 158.0 |
| B | 5 | 255 | 22742 | 138.84 | 828 | 807 | 158.0 |
| C | 14 | 238 | 137810 | 712.55 | 812 | 817 | 192.3 |
| C | 3 | 233 | 54599 | 279.74 | 812 | 817 | 192.3 |
| C | 14 | 254 | 14598 | 71.68 | 812 | 817 | 192.3 |
| D | 8 | 195 | 2067787 | 11032.28 | 779 | 756 | 187.4 |
| D | 7 | 80 | 953908 | 5087.22 | 779 | 756 | 187.4 |
| D | 13 | 104 | 332540 | 1770.82 | 779 | 756 | 187.4 |
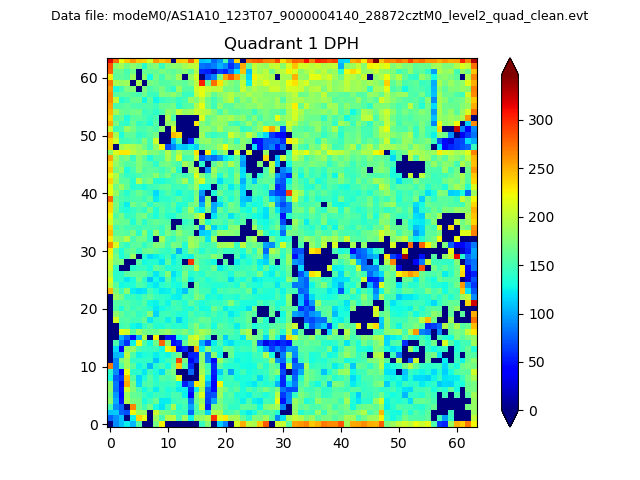
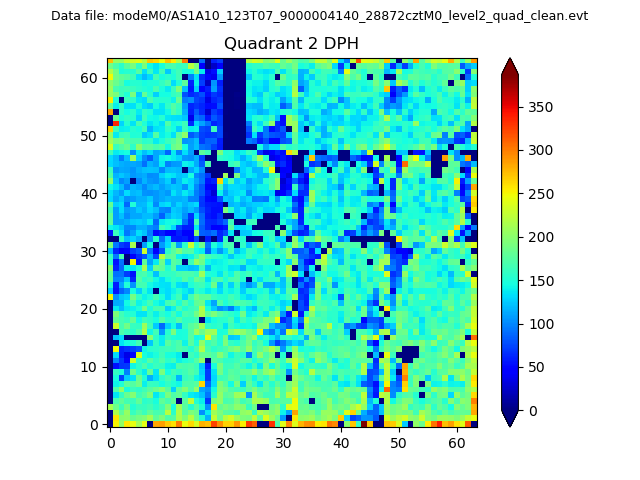
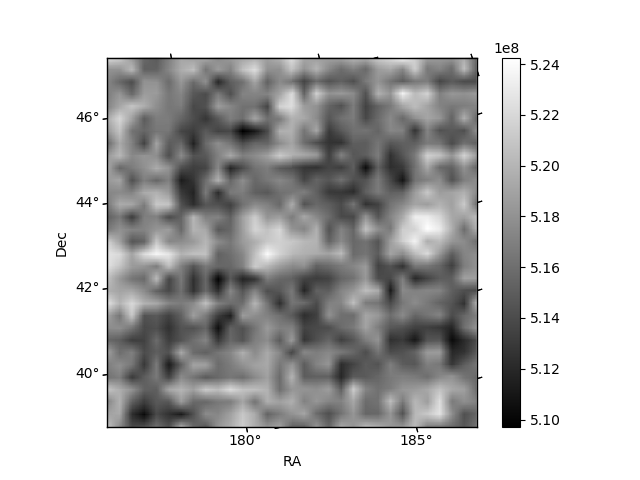
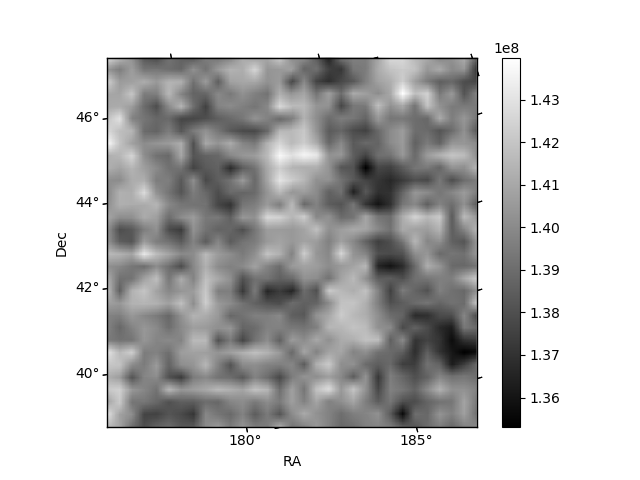
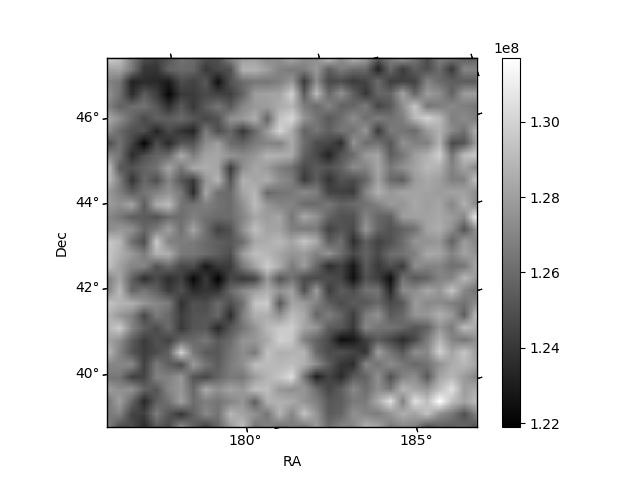
Histogram calculated using DETX and DETY for each event in the final _common_clean file
| Quadrant A | 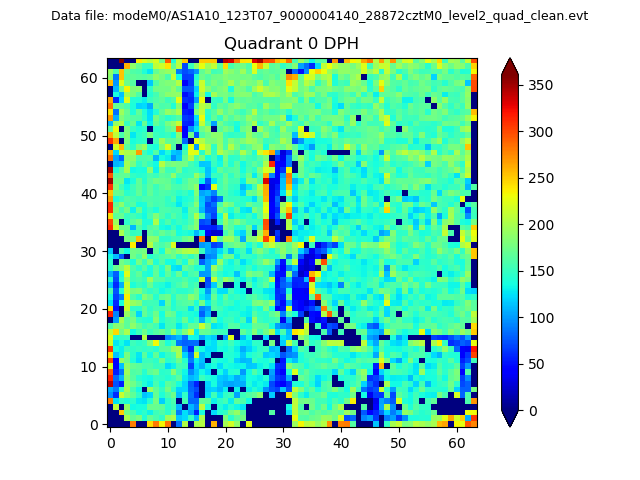 |
 |
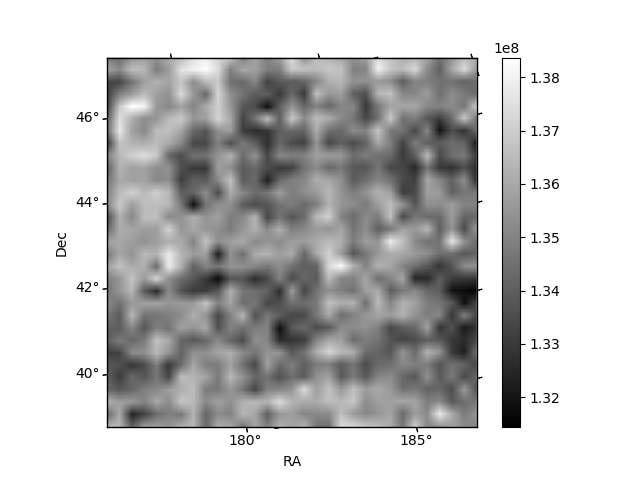
Quadrant B |
|---|---|---|---|
| Quadrant D | 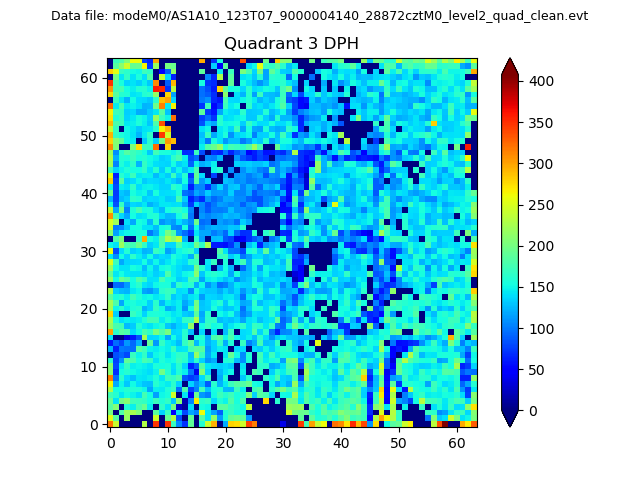 |
 |
Quadrant C |
| Plot type | Count rate plots | Images |
|---|---|---|
| Comparison with Poisson distribution Blue bars denote a histogram of data divided into 1 sec bins. Red curve is a Poisson curve with rate = median count rate of data. |
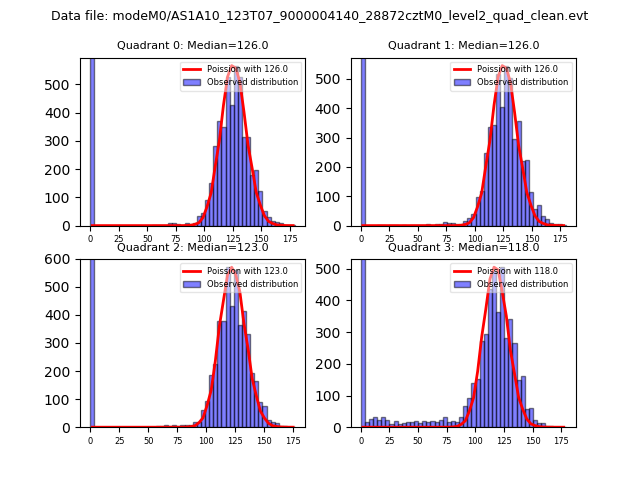 |
 |
| Quadrant-wise count rates Data is divided into 100 sec bins |
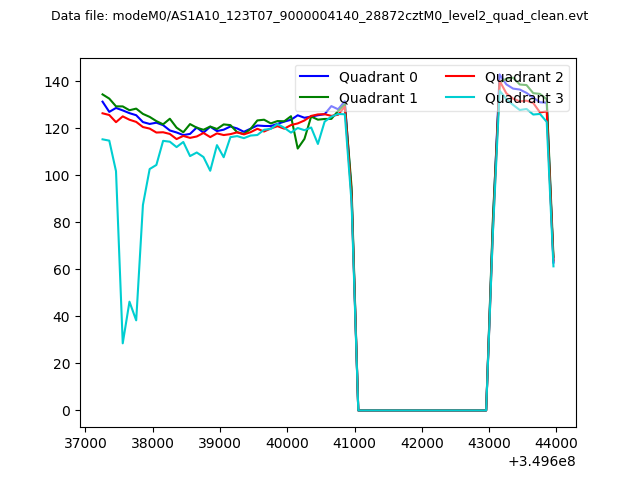 |
|
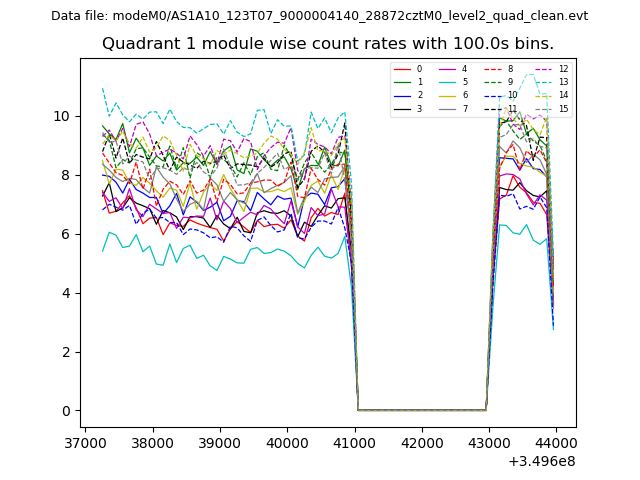
| Module-wise count rates for Quadrant A Data is divided into 100 sec bins |
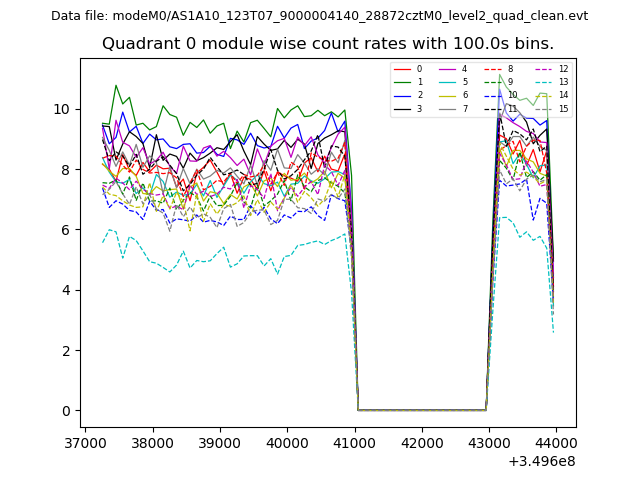 |
 |
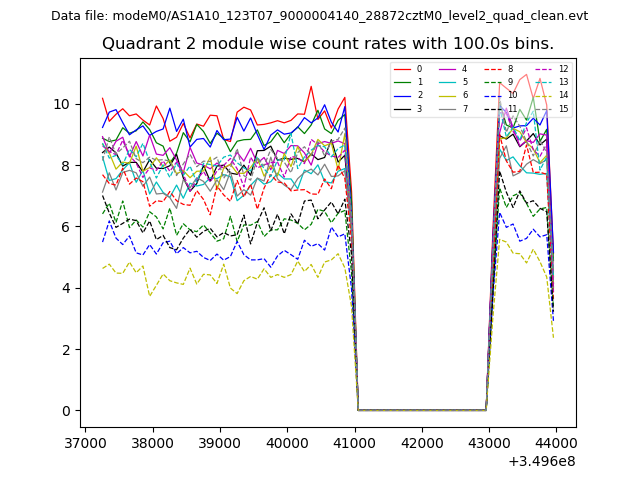
| Module-wise count rates for Quadrant B Data is divided into 100 sec bins |
 |
 |
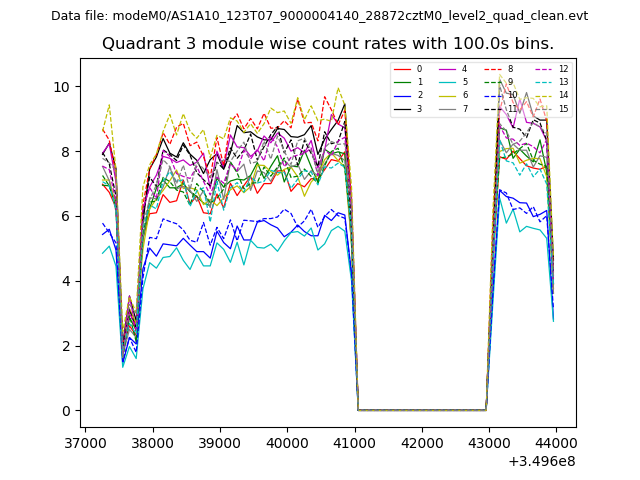
| Module-wise count rates for Quadrant C Data is divided into 100 sec bins |
 |
 |
| Module-wise count rates for Quadrant D Data is divided into 100 sec bins |
 |
 |
| Parameter | Plot |
|---|---|
| CZT HV Monitor | 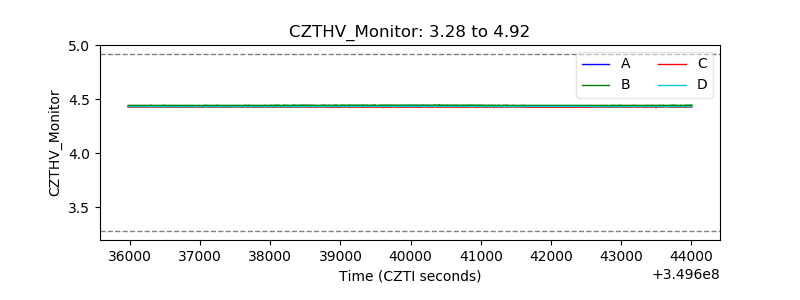 |
| D_VDD | 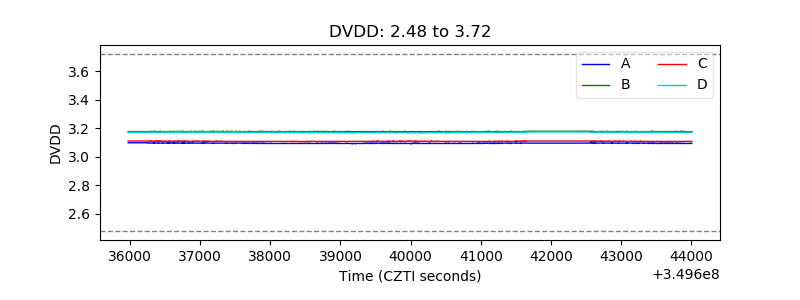 |
| Temperature 1 | 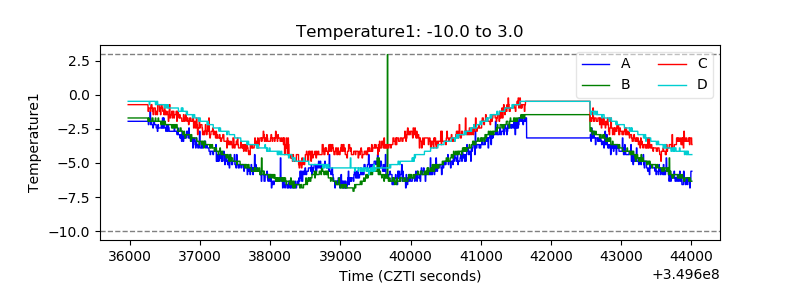 |
| Veto HV Monitor | 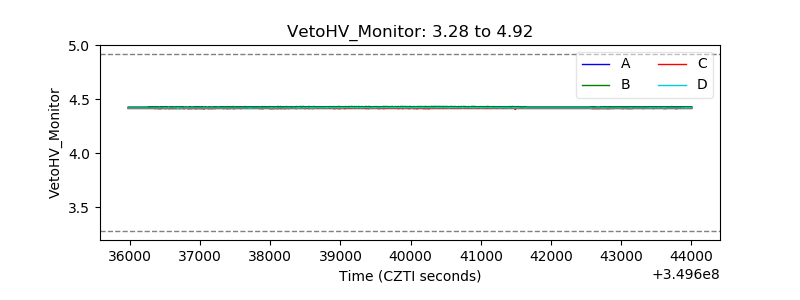 |
| Veto LLD | 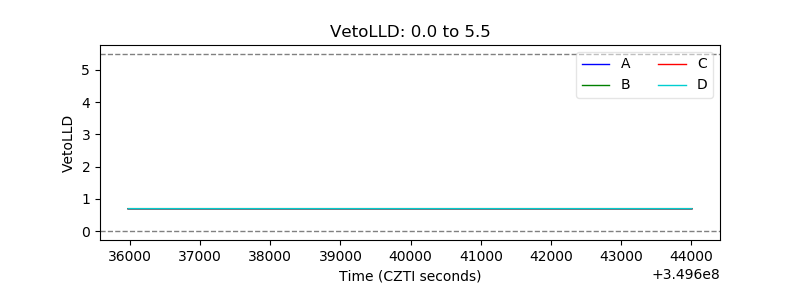 |
| Alpha Counter | 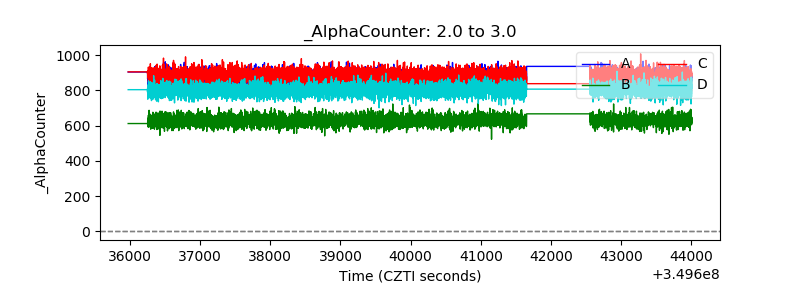 |
| _CPM_Rate | 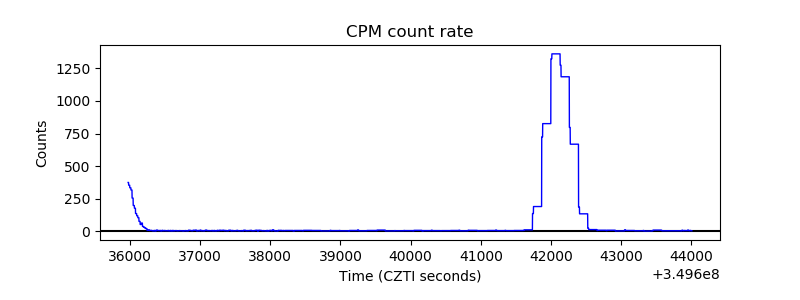 |
| CZT Counter | 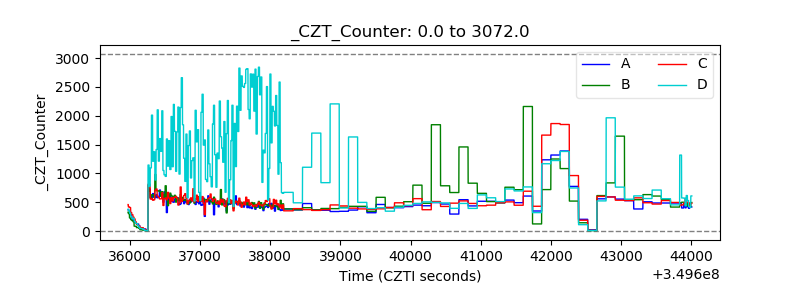 |
| +2.5 Volts monitor |  |
| +5 Volts monitor |  |
| _ROLL_ROT | 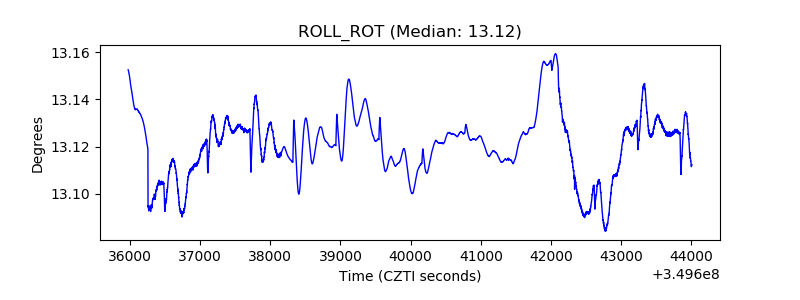 |
| _Roll_DEC | 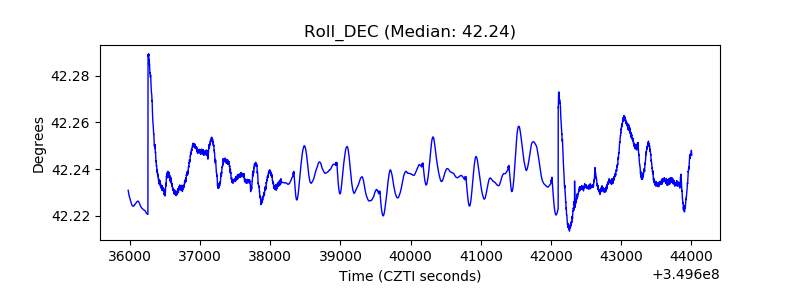 |
| _Roll_RA | 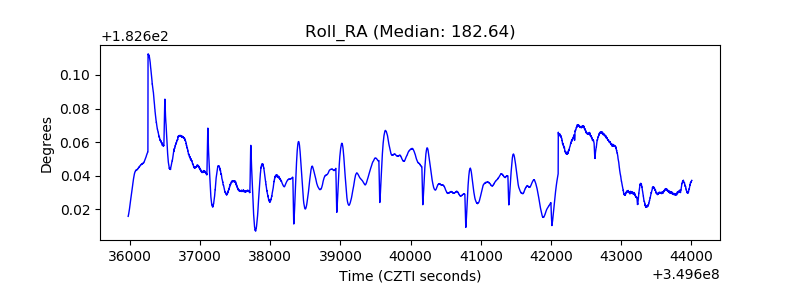 |
| Veto Counter | 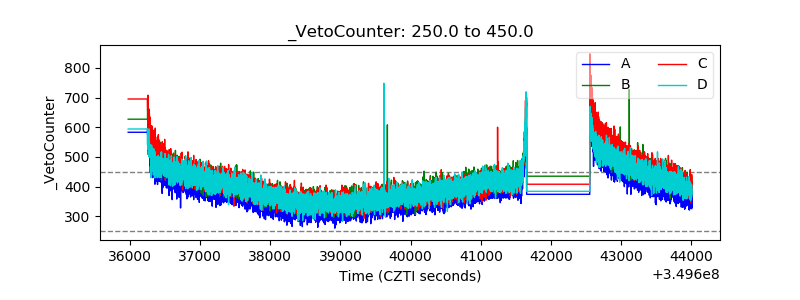 |