| Param | Original file | Final file |
|---|---|---|
| Filename | modeM0/AS1A10_123T07_9000004140_28873cztM0_level2.evt | modeM0/AS1A10_123T07_9000004140_28873cztM0_level2_quad_clean.evt |
| Size (bytes) | 556,885,440 | 101,784,960 |
| Size | 531.1 MB | 97.1 MB |
| Events in quadrant A | 3,350,275 | 659,256 |
| Events in quadrant B | 3,703,624 | 679,097 |
| Events in quadrant C | 3,448,703 | 652,816 |
| Events in quadrant D | 5,894,289 | 610,034 |
| Mode M9 | |||
|---|---|---|---|
| Quadrant | BADHDUFLAG | Total packets | Discarded packets |
| A | 0 | 19 | 0 |
| B | 0 | 19 | 0 |
| C | 0 | 19 | 0 |
| D | 0 | 19 | 0 |
| Mode M0 | |||
|---|---|---|---|
| Quadrant | BADHDUFLAG | Total packets | Discarded packets |
| A | 0 | 14477 | 3 |
| B | 0 | 15630 | 2 |
| C | 0 | 14728 | 2 |
| D | 0 | 22378 | 2 |
| Mode SS | |||
|---|---|---|---|
| Quadrant | BADHDUFLAG | Total packets | Discarded packets |
| A | 0 | 144 | 0 |
| B | 0 | 144 | 0 |
| C | 0 | 144 | 0 |
| D | 0 | 144 | 0 |
| Quadrant | Total seconds | Saturated seconds | Saturation percentage |
|---|---|---|---|
| A | 6901 | 56 | 0.811477% |
| B | 6901 | 165 | 2.390958% |
| C | 6901 | 137 | 1.985220% |
| D | 6901 | 646 | 9.360962% |
Noise dominated data is calculated using 1-second bins in cleaned event files. If a bin has >2000 counts, and if more than 50% of those come from <1% of pixels, then it is considered to be noise-dominated and hence unusable.
| Quadrant | # 1 sec bins | Bins with >0 counts | Bins with >2000 counts | High rate bins dominated by noise | Noise dominated (total time) | Noise dominated (detector-on time) | Marked lightcurve |
|---|---|---|---|---|---|---|---|
| A | 8851 | 6901 | 0 | 0 | 0.00% | 0.00% | 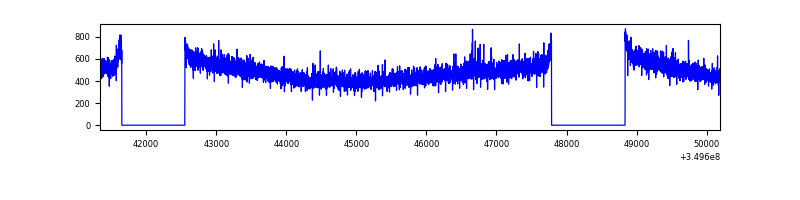 |
| B | 8851 | 6901 | 25 | 25 | 0.28% | 0.36% | 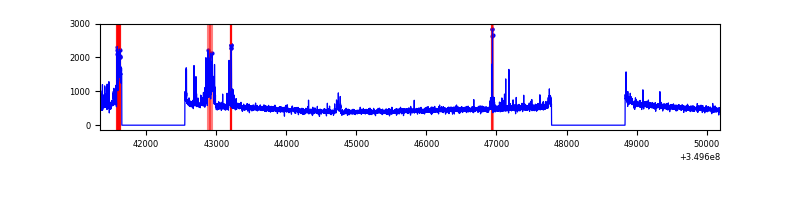 |
| C | 8851 | 6901 | 0 | 0 | 0.00% | 0.00% | 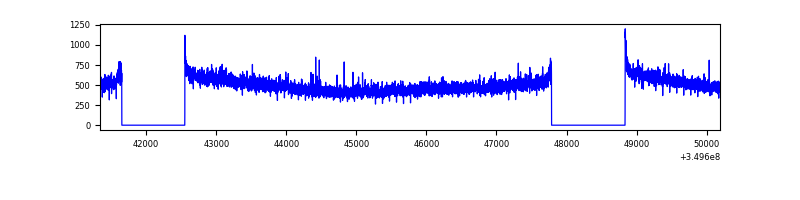 |
| D | 8851 | 6901 | 597 | 597 | 6.75% | 8.65% | 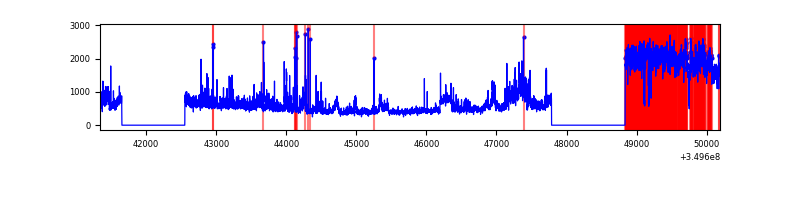 |
Top three noisy pixels from each quadrant. If the there are fewer than three noisy pixels in the level2.evt file, extra rows are filled as -1
| Pixel properties | Quadrant properties | ||||||
|---|---|---|---|---|---|---|---|
| Quadrant | DetID | PixID | Counts | Sigma | Mean | Median | Sigma |
| A | 13 | 6 | 18192 | 100.2 | 859 | 840 | 173.2 |
| A | 13 | 254 | 15554 | 84.97 | 859 | 840 | 173.2 |
| A | 14 | 235 | 14407 | 78.35 | 859 | 840 | 173.2 |
| B | 10 | 246 | 308461 | 1909.83 | 852 | 832 | 161.1 |
| B | 12 | 17 | 21035 | 125.42 | 852 | 832 | 161.1 |
| B | 12 | 111 | 20092 | 119.57 | 852 | 832 | 161.1 |
| C | 14 | 238 | 138922 | 711.8 | 832 | 838 | 194.0 |
| C | 3 | 233 | 48850 | 247.49 | 832 | 838 | 194.0 |
| C | 14 | 254 | 9553 | 44.92 | 832 | 838 | 194.0 |
| D | 8 | 195 | 2066732 | 10489.44 | 819 | 795 | 197.0 |
| D | 13 | 104 | 300500 | 1521.7 | 819 | 795 | 197.0 |
| D | 1 | 52 | 205086 | 1037.25 | 819 | 795 | 197.0 |
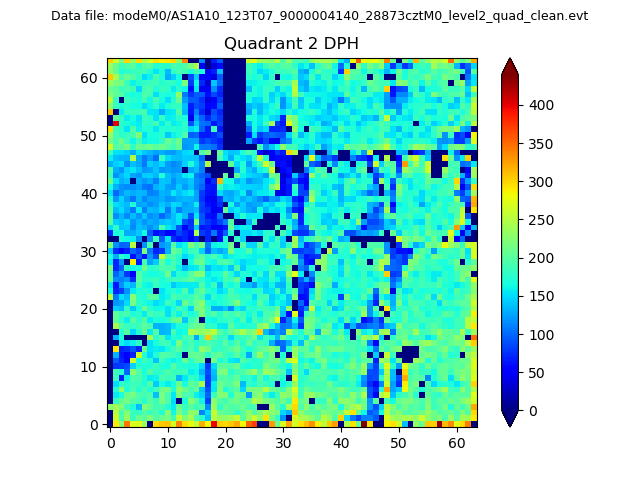
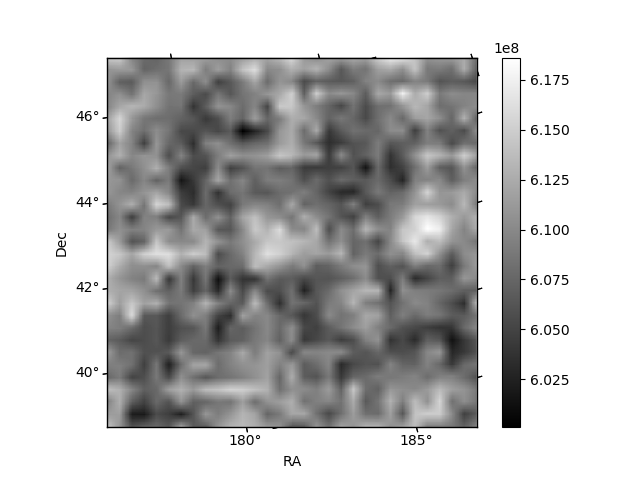
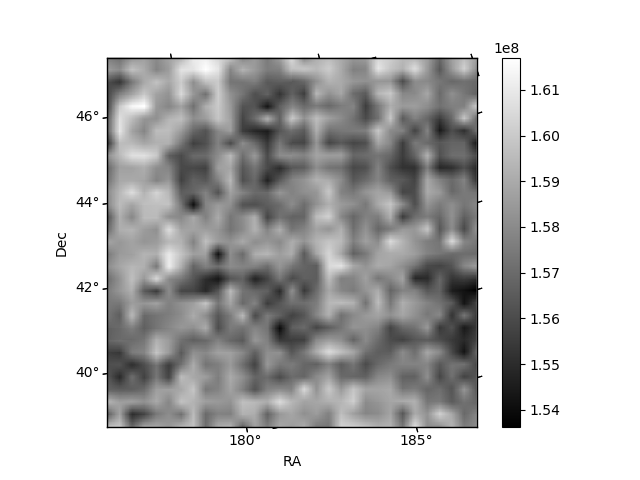
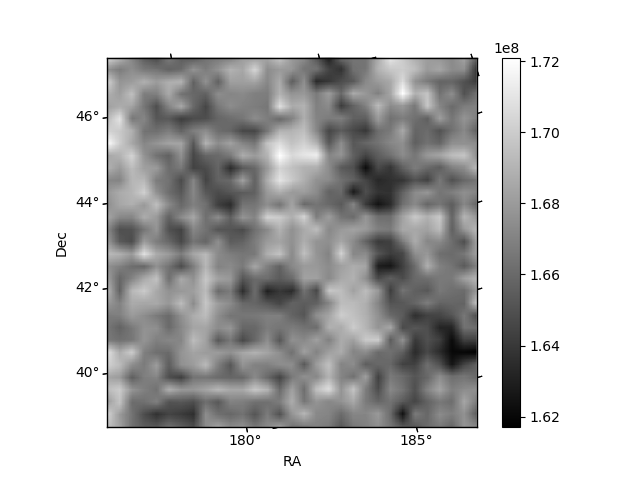
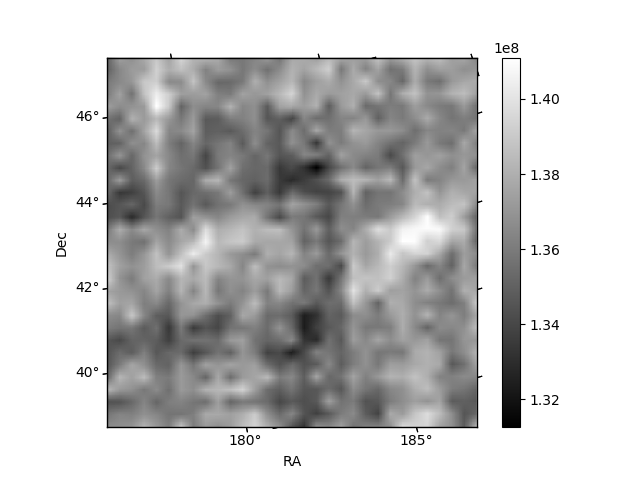
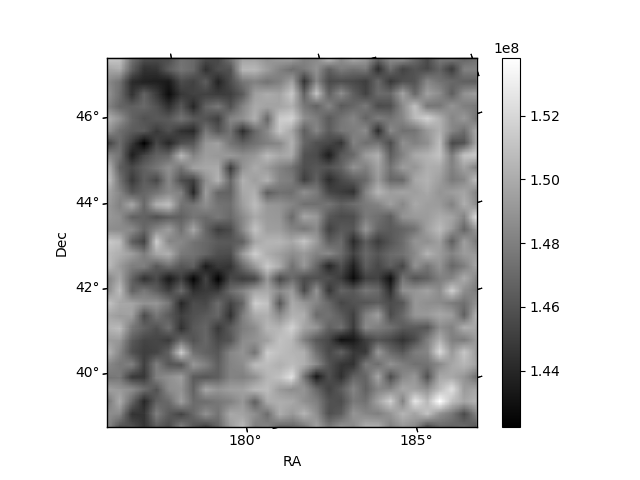
Histogram calculated using DETX and DETY for each event in the final _common_clean file
| Quadrant A | 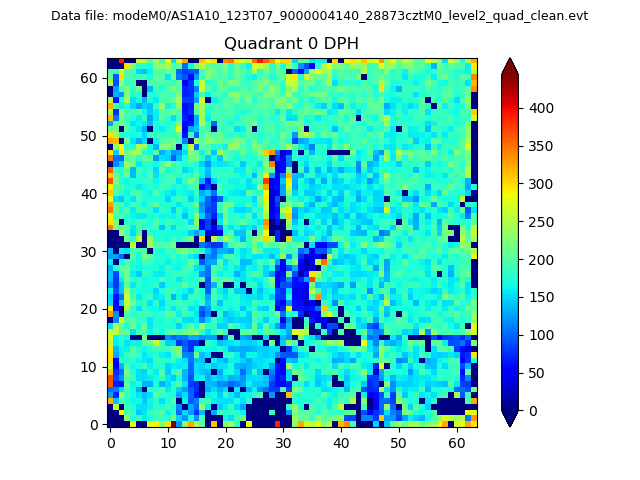 |
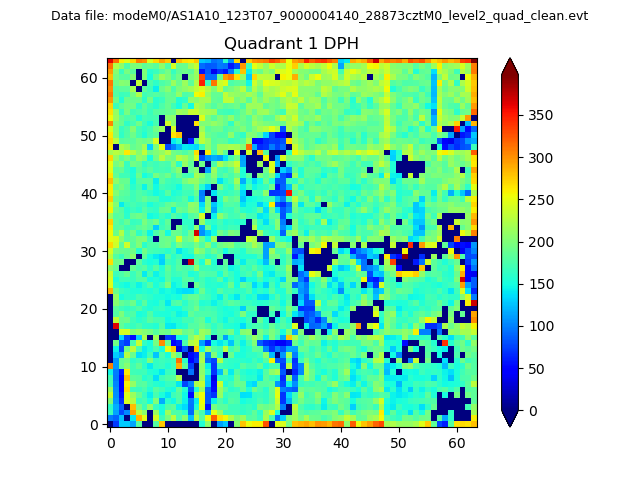 |
Quadrant B |
|---|---|---|---|
| Quadrant D | 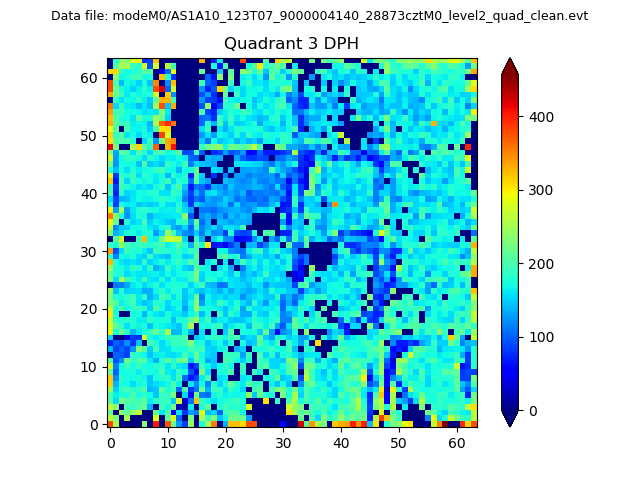 |
 |
Quadrant C |
| Plot type | Count rate plots | Images |
|---|---|---|
| Comparison with Poisson distribution Blue bars denote a histogram of data divided into 1 sec bins. Red curve is a Poisson curve with rate = median count rate of data. |
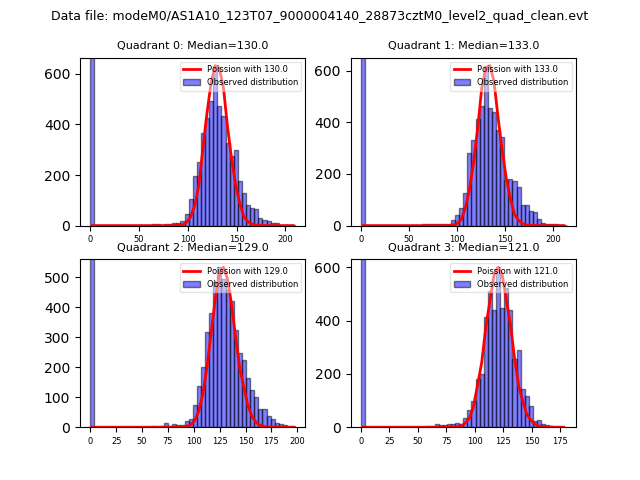 |
 |
| Quadrant-wise count rates Data is divided into 100 sec bins |
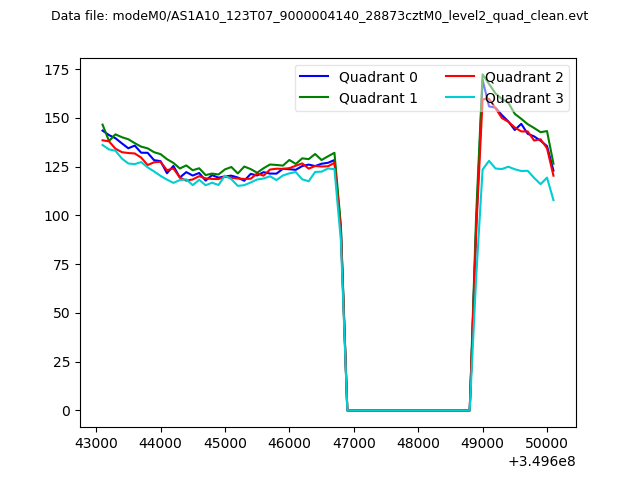 |
|
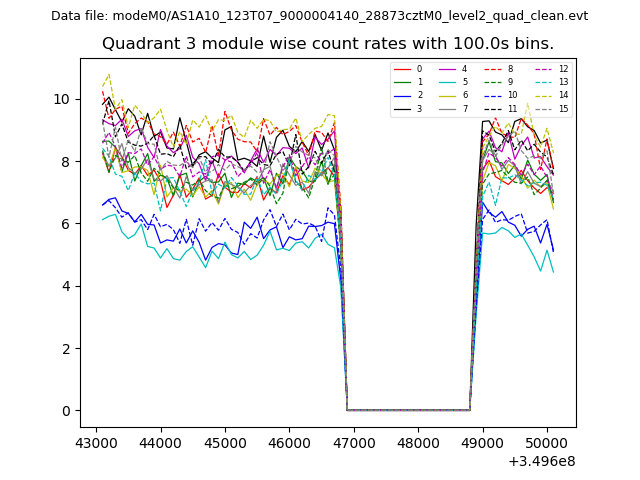
| Module-wise count rates for Quadrant A Data is divided into 100 sec bins |
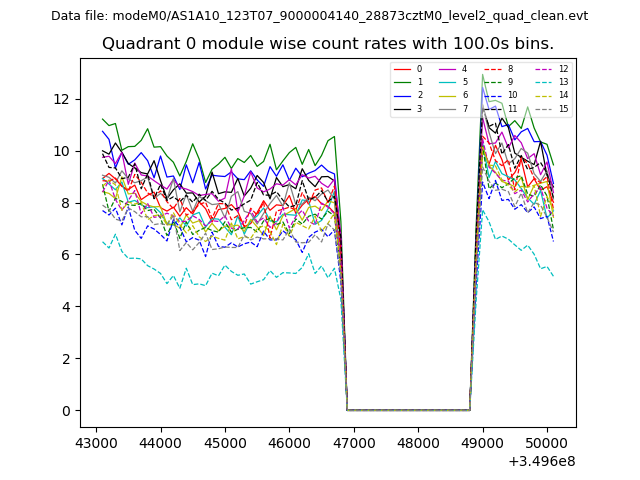 |
 |
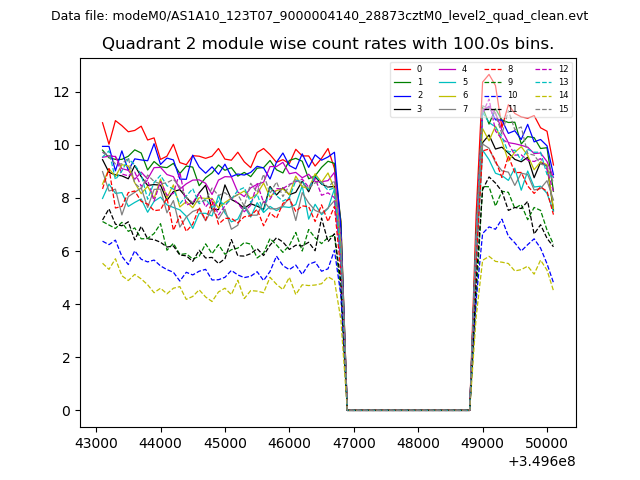
| Module-wise count rates for Quadrant B Data is divided into 100 sec bins |
 |
 |
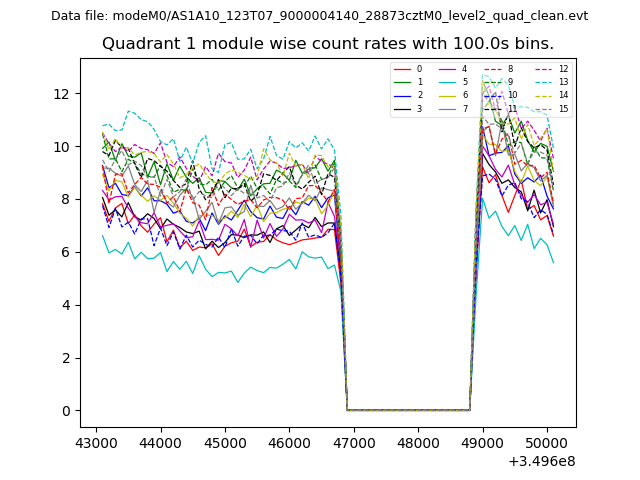
| Module-wise count rates for Quadrant C Data is divided into 100 sec bins |
 |
 |
| Module-wise count rates for Quadrant D Data is divided into 100 sec bins |
 |
 |
| Parameter | Plot |
|---|---|
| CZT HV Monitor | 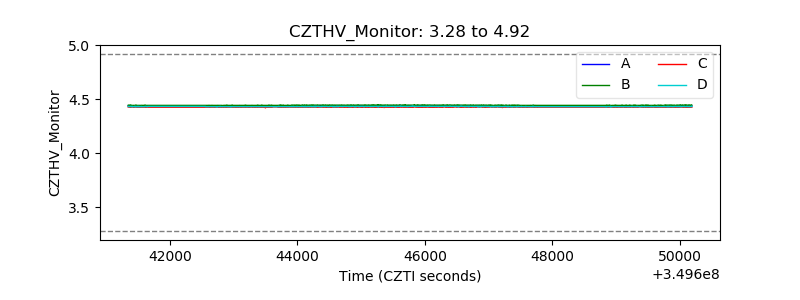 |
| D_VDD | 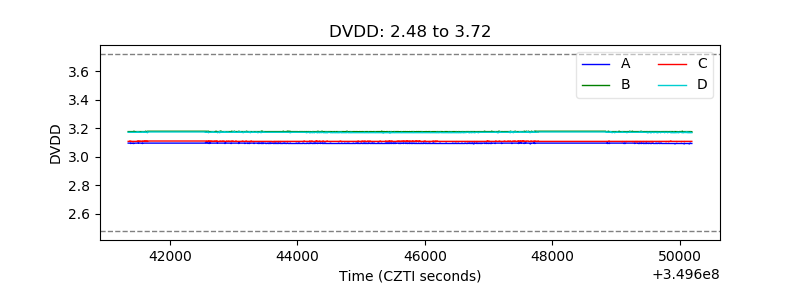 |
| Temperature 1 | 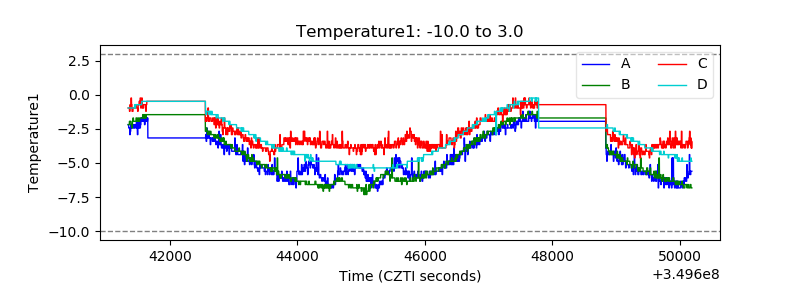 |
| Veto HV Monitor | 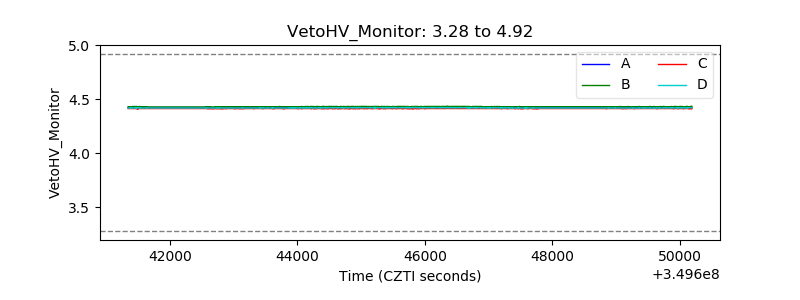 |
| Veto LLD | 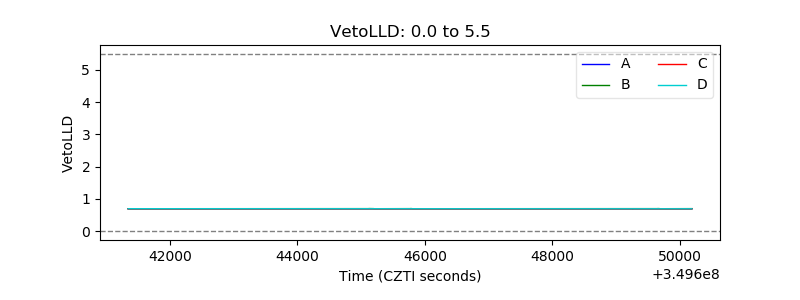 |
| Alpha Counter | 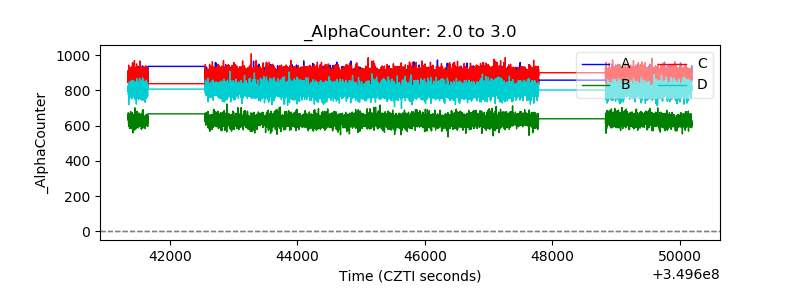 |
| _CPM_Rate | 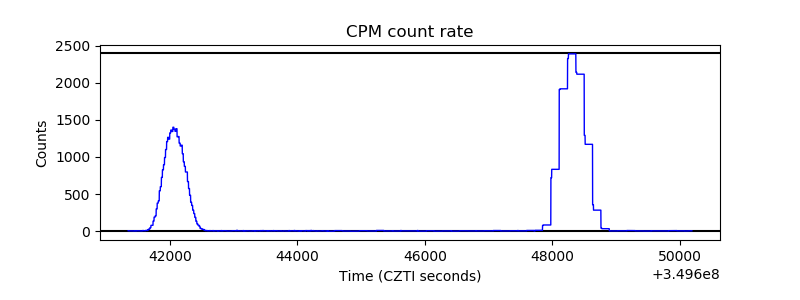 |
| CZT Counter | 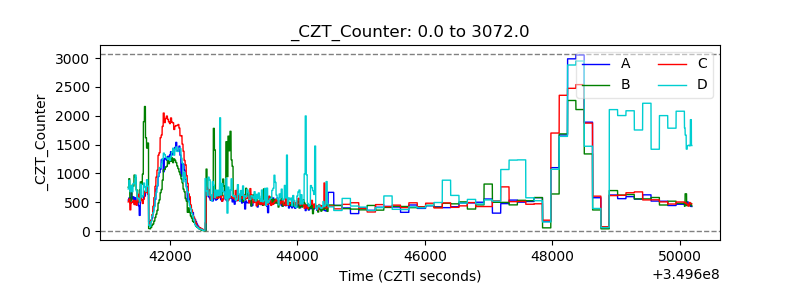 |
| +2.5 Volts monitor |  |
| +5 Volts monitor |  |
| _ROLL_ROT | 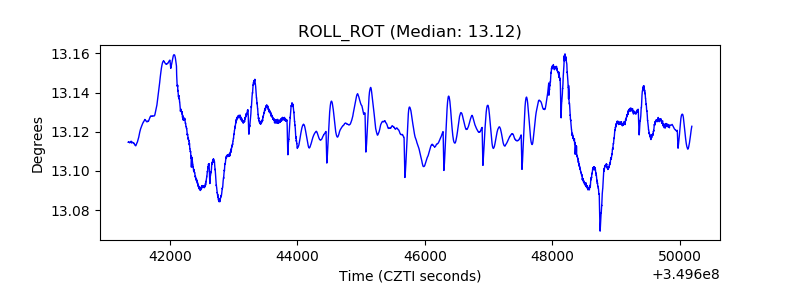 |
| _Roll_DEC | 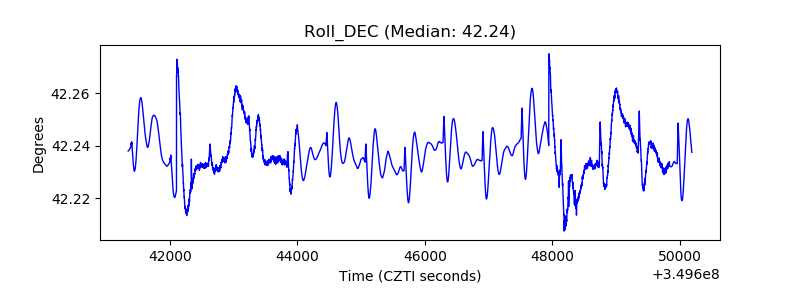 |
| _Roll_RA | 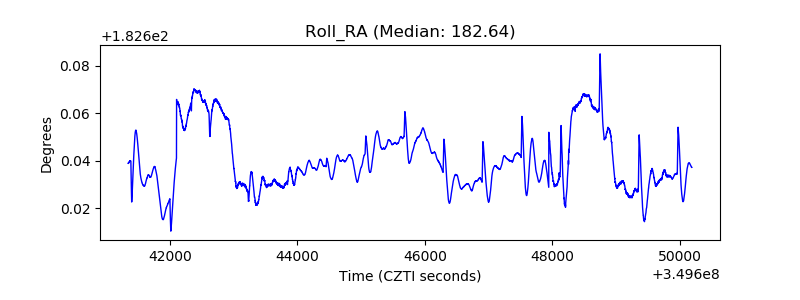 |
| Veto Counter | 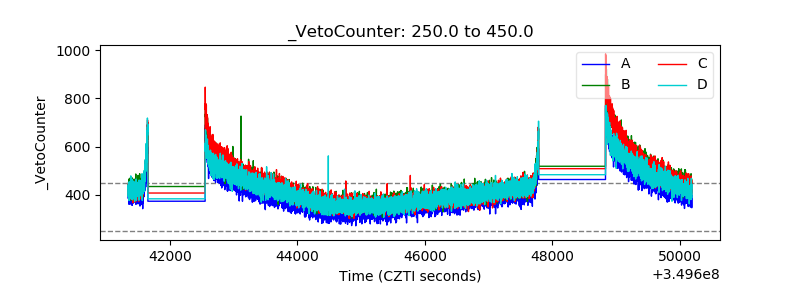 |