| Param | Original file | Final file |
|---|---|---|
| Filename | modeM0/AS1A10_123T07_9000004140_28880cztM0_level2.evt | modeM0/AS1A10_123T07_9000004140_28880cztM0_level2_quad_clean.evt |
| Size (bytes) | 601,234,560 | 83,027,520 |
| Size | 573.4 MB | 79.2 MB |
| Events in quadrant A | 2,941,906 | 540,193 |
| Events in quadrant B | 2,951,932 | 555,976 |
| Events in quadrant C | 3,247,230 | 526,639 |
| Events in quadrant D | 8,650,783 | 461,632 |
| Mode M9 | |||
|---|---|---|---|
| Quadrant | BADHDUFLAG | Total packets | Discarded packets |
| A | 0 | 9 | 0 |
| B | 0 | 9 | 0 |
| C | 0 | 9 | 0 |
| D | 0 | 9 | 0 |
| Mode M0 | |||
|---|---|---|---|
| Quadrant | BADHDUFLAG | Total packets | Discarded packets |
| A | 0 | 12532 | 1 |
| B | 0 | 12621 | 1 |
| C | 0 | 13461 | 1 |
| D | 0 | 29916 | 1 |
| Mode SS | |||
|---|---|---|---|
| Quadrant | BADHDUFLAG | Total packets | Discarded packets |
| A | 0 | 126 | 0 |
| B | 0 | 126 | 0 |
| C | 0 | 126 | 0 |
| D | 0 | 126 | 0 |
| Quadrant | Total seconds | Saturated seconds | Saturation percentage |
|---|---|---|---|
| A | 6147 | 50 | 0.813405% |
| B | 6147 | 56 | 0.911014% |
| C | 6148 | 133 | 2.163305% |
| D | 6148 | 1623 | 26.398829% |
Noise dominated data is calculated using 1-second bins in cleaned event files. If a bin has >2000 counts, and if more than 50% of those come from <1% of pixels, then it is considered to be noise-dominated and hence unusable.
| Quadrant | # 1 sec bins | Bins with >0 counts | Bins with >2000 counts | High rate bins dominated by noise | Noise dominated (total time) | Noise dominated (detector-on time) | Marked lightcurve |
|---|---|---|---|---|---|---|---|
| A | 7062 | 6147 | 0 | 0 | 0.00% | 0.00% | 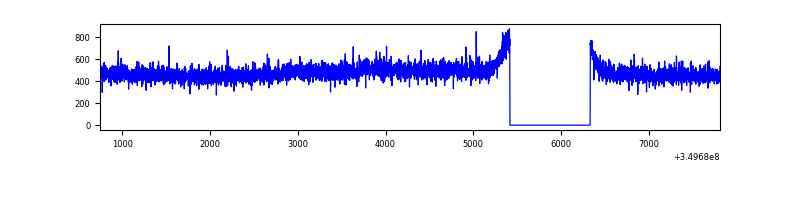 |
| B | 7062 | 6147 | 0 | 0 | 0.00% | 0.00% | 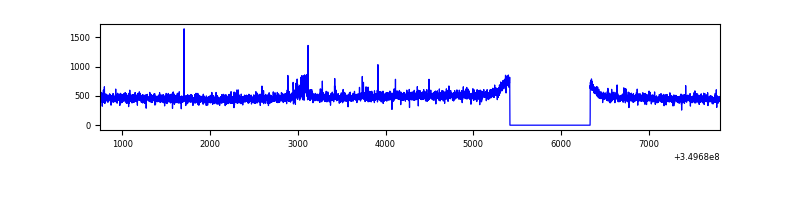 |
| C | 7063 | 6148 | 17 | 17 | 0.24% | 0.28% |  |
| D | 7063 | 6148 | 1536 | 1536 | 21.75% | 24.98% | 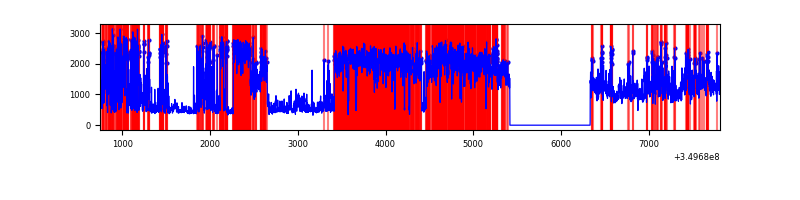 |
Top three noisy pixels from each quadrant. If the there are fewer than three noisy pixels in the level2.evt file, extra rows are filled as -1
| Pixel properties | Quadrant properties | ||||||
|---|---|---|---|---|---|---|---|
| Quadrant | DetID | PixID | Counts | Sigma | Mean | Median | Sigma |
| A | 13 | 6 | 21314 | 136.01 | 755 | 739 | 151.3 |
| A | 13 | 254 | 11044 | 68.12 | 755 | 739 | 151.3 |
| A | 3 | 137 | 7254 | 43.07 | 755 | 739 | 151.3 |
| B | 15 | 32 | 20141 | 135.92 | 747 | 727 | 142.8 |
| B | 12 | 111 | 17447 | 117.06 | 747 | 727 | 142.8 |
| B | 11 | 111 | 15790 | 105.46 | 747 | 727 | 142.8 |
| C | 3 | 233 | 220847 | 1326.23 | 714 | 718 | 166.0 |
| C | 14 | 238 | 131085 | 785.43 | 714 | 718 | 166.0 |
| C | 15 | 208 | 48815 | 289.77 | 714 | 718 | 166.0 |
| D | 8 | 195 | 4373872 | 27188.87 | 677 | 657 | 160.8 |
| D | 7 | 80 | 1455023 | 9041.99 | 677 | 657 | 160.8 |
| D | 1 | 52 | 211503 | 1310.86 | 677 | 657 | 160.8 |
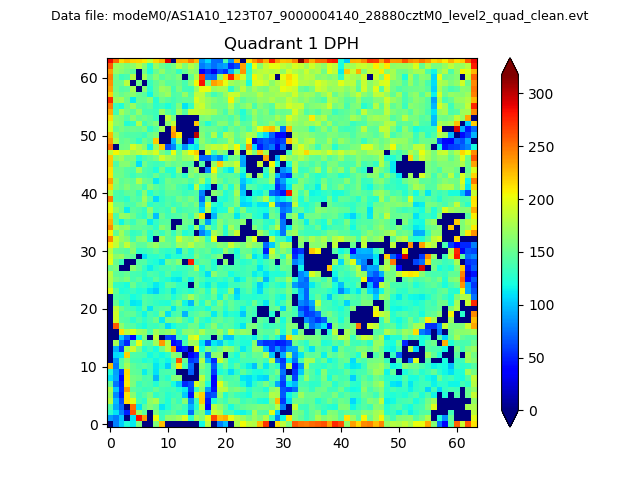
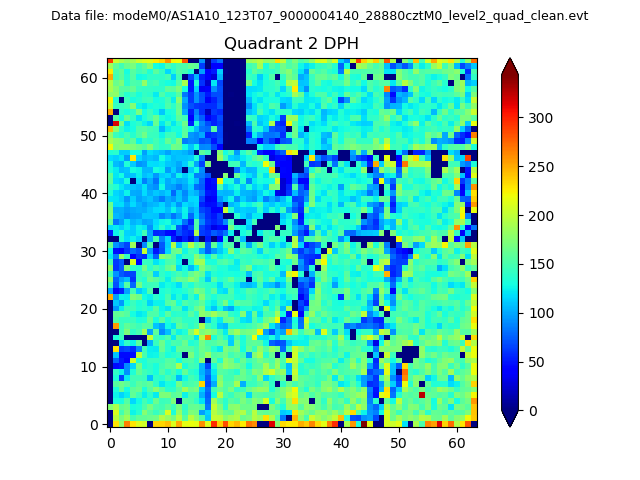
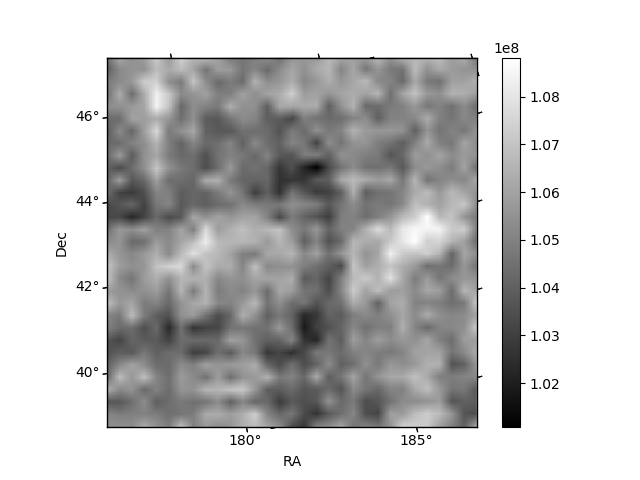
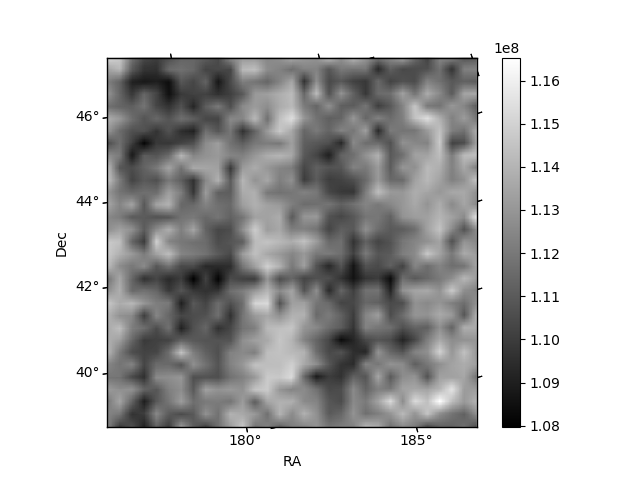
Histogram calculated using DETX and DETY for each event in the final _common_clean file
| Quadrant A | 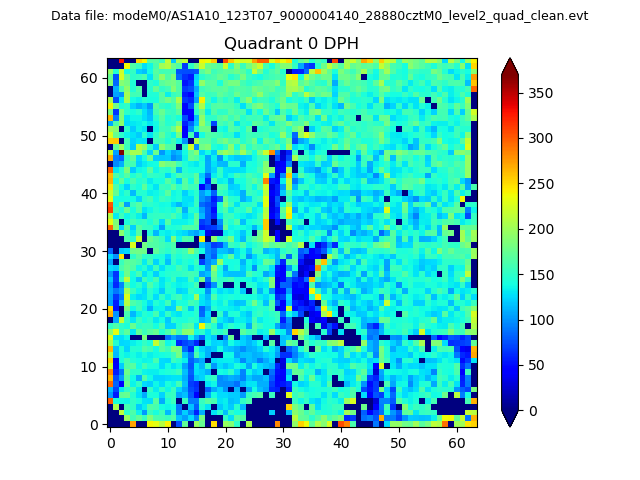 |
 |
Quadrant B |
|---|---|---|---|
| Quadrant D | 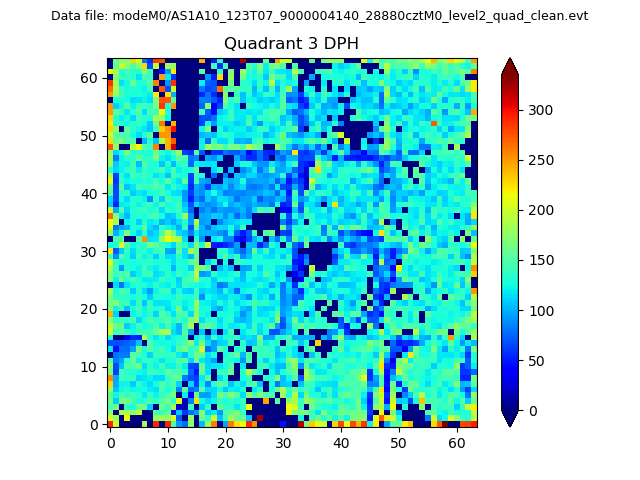 |
 |
Quadrant C |
| Plot type | Count rate plots | Images |
|---|---|---|
| Comparison with Poisson distribution Blue bars denote a histogram of data divided into 1 sec bins. Red curve is a Poisson curve with rate = median count rate of data. |
 |
 |
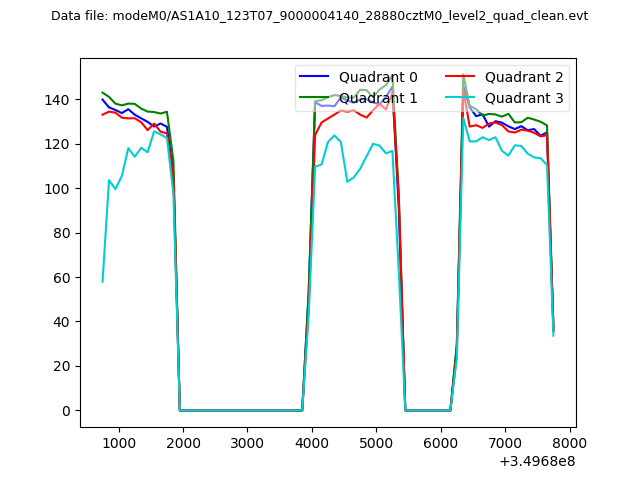
| Quadrant-wise count rates Data is divided into 100 sec bins |
 |
|
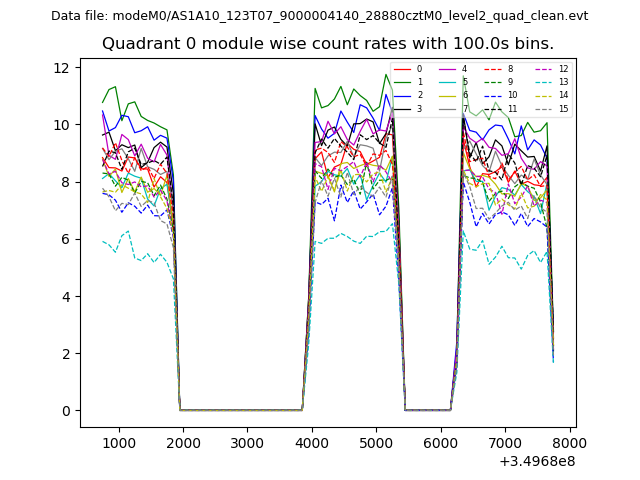
| Module-wise count rates for Quadrant A Data is divided into 100 sec bins |
 |
 |
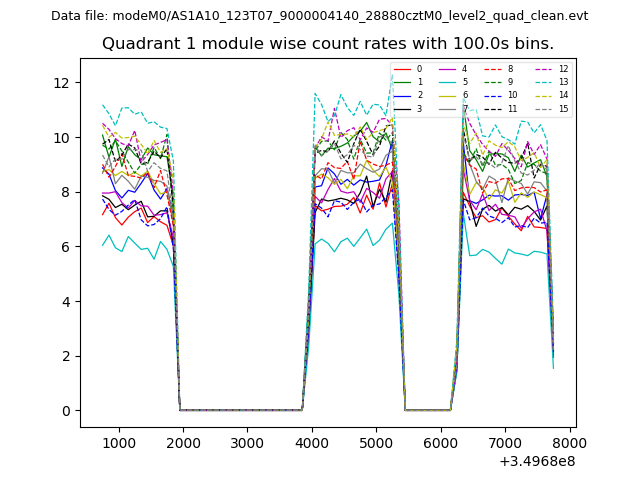
| Module-wise count rates for Quadrant B Data is divided into 100 sec bins |
 |
 |
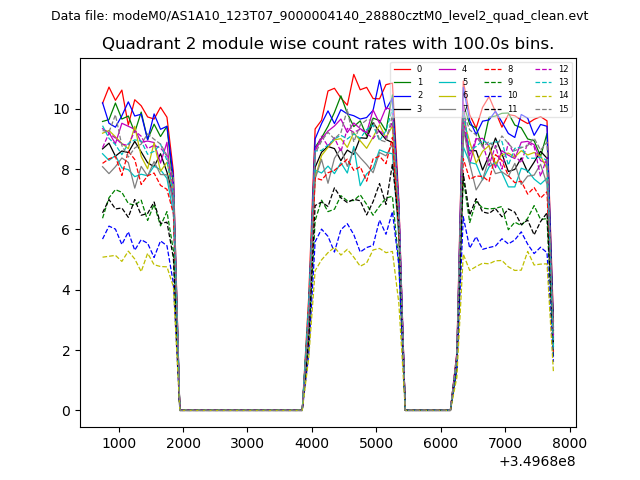
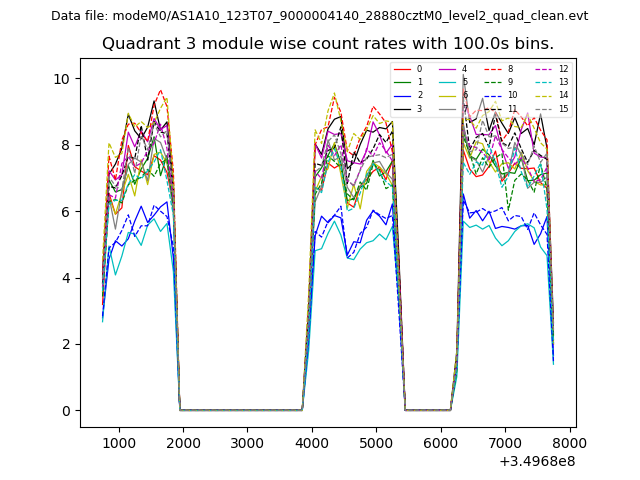
| Module-wise count rates for Quadrant C Data is divided into 100 sec bins |
 |
 |
| Module-wise count rates for Quadrant D Data is divided into 100 sec bins |
 |
 |
| Parameter | Plot |
|---|---|
| CZT HV Monitor | 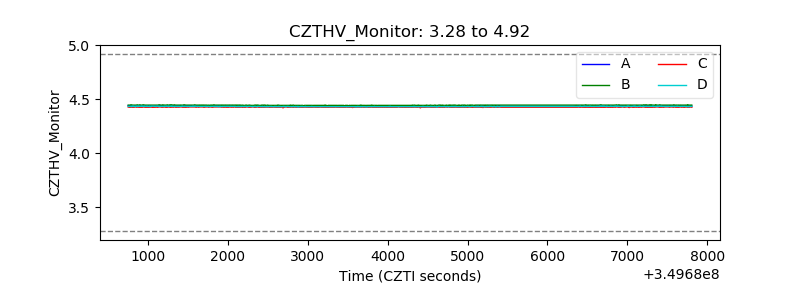 |
| D_VDD |  |
| Temperature 1 | 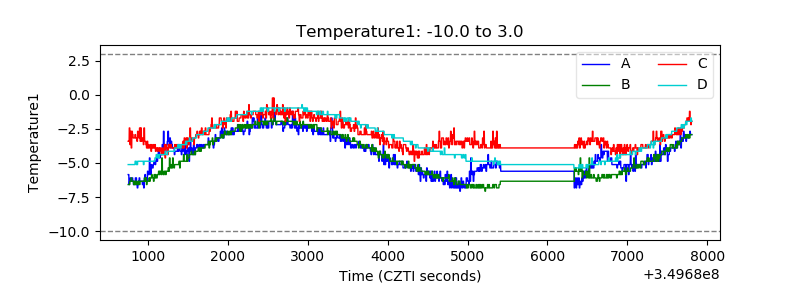 |
| Veto HV Monitor |  |
| Veto LLD | 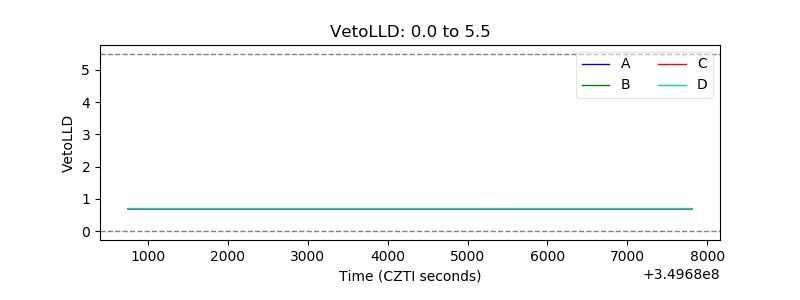 |
| Alpha Counter | 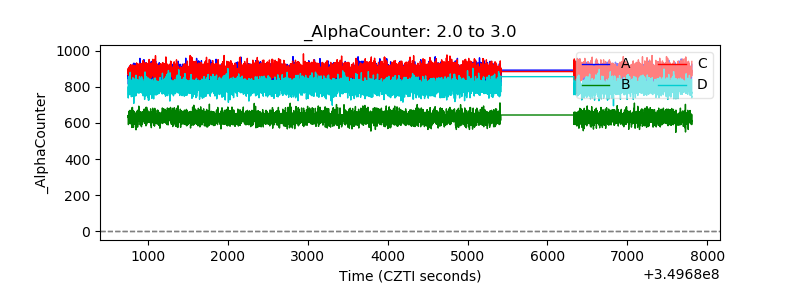 |
| _CPM_Rate | 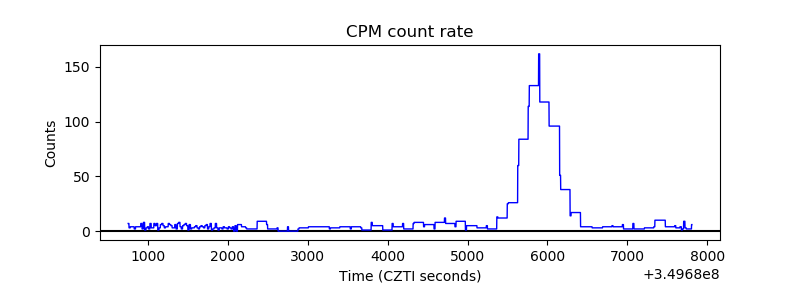 |
| CZT Counter | 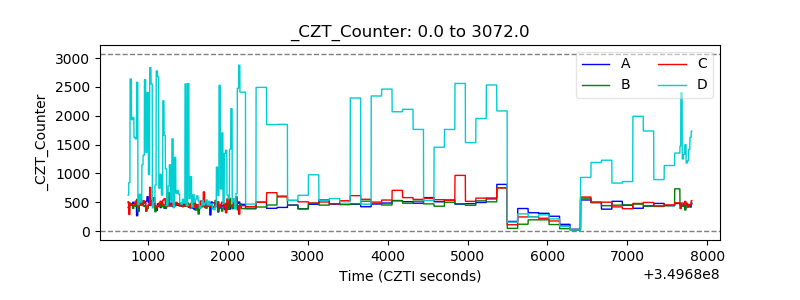 |
| +2.5 Volts monitor |  |
| +5 Volts monitor |  |
| _ROLL_ROT | 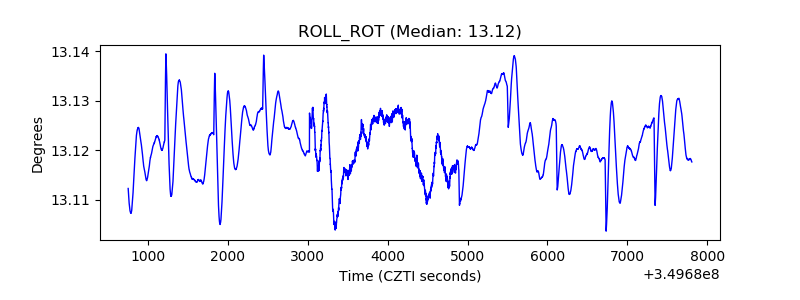 |
| _Roll_DEC | 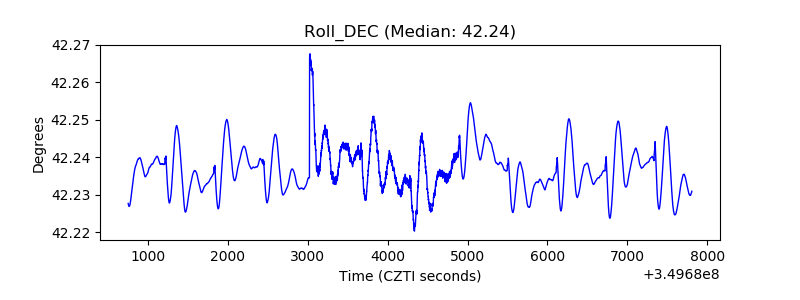 |
| _Roll_RA |  |
| Veto Counter |  |