| Param | Original file | Final file |
|---|---|---|
| Filename | modeM0/AS1A10_123T07_9000004140_28881cztM0_level2.evt | modeM0/AS1A10_123T07_9000004140_28881cztM0_level2_quad_clean.evt |
| Size (bytes) | 630,293,760 | 81,532,800 |
| Size | 601.1 MB | 77.8 MB |
| Events in quadrant A | 3,047,515 | 519,999 |
| Events in quadrant B | 3,050,968 | 534,459 |
| Events in quadrant C | 3,301,097 | 505,244 |
| Events in quadrant D | 9,256,119 | 462,616 |
| Mode M9 | |||
|---|---|---|---|
| Quadrant | BADHDUFLAG | Total packets | Discarded packets |
| A | 0 | 4 | 0 |
| B | 0 | 4 | 0 |
| C | 0 | 4 | 0 |
| D | 0 | 4 | 0 |
| Mode M0 | |||
|---|---|---|---|
| Quadrant | BADHDUFLAG | Total packets | Discarded packets |
| A | 0 | 13175 | 2 |
| B | 0 | 13124 | 2 |
| C | 0 | 13673 | 2 |
| D | 0 | 32008 | 3 |
| Mode SS | |||
|---|---|---|---|
| Quadrant | BADHDUFLAG | Total packets | Discarded packets |
| A | 0 | 132 | 0 |
| B | 0 | 132 | 0 |
| C | 0 | 132 | 0 |
| D | 0 | 132 | 0 |
| Quadrant | Total seconds | Saturated seconds | Saturation percentage |
|---|---|---|---|
| A | 6389 | 91 | 1.424323% |
| B | 6390 | 102 | 1.596244% |
| C | 6390 | 237 | 3.708920% |
| D | 6389 | 1266 | 19.815308% |
Noise dominated data is calculated using 1-second bins in cleaned event files. If a bin has >2000 counts, and if more than 50% of those come from <1% of pixels, then it is considered to be noise-dominated and hence unusable.
| Quadrant | # 1 sec bins | Bins with >0 counts | Bins with >2000 counts | High rate bins dominated by noise | Noise dominated (total time) | Noise dominated (detector-on time) | Marked lightcurve |
|---|---|---|---|---|---|---|---|
| A | 6874 | 6389 | 0 | 0 | 0.00% | 0.00% | 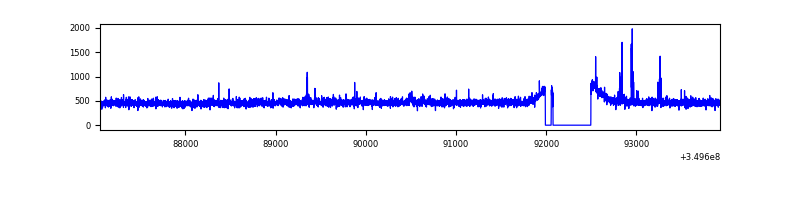 |
| B | 6875 | 6390 | 0 | 0 | 0.00% | 0.00% | 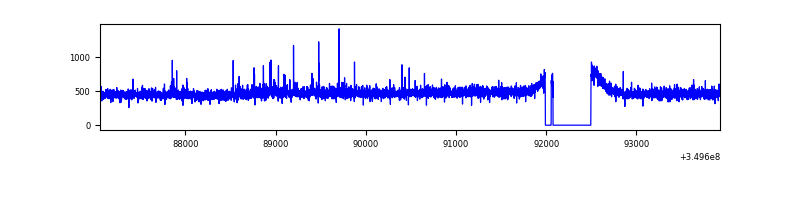 |
| C | 6875 | 6391 | 11 | 11 | 0.16% | 0.17% | 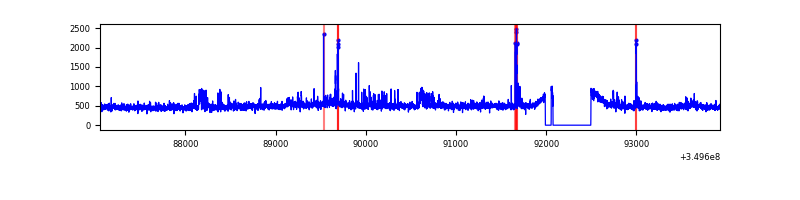 |
| D | 6873 | 6388 | 1203 | 1203 | 17.50% | 18.83% | 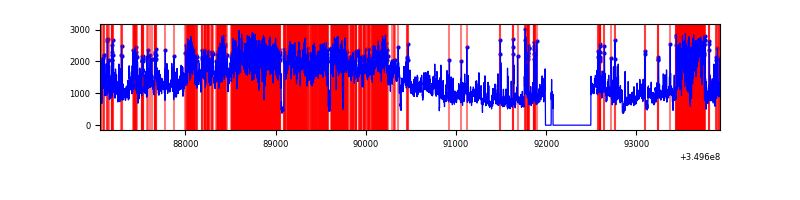 |
Top three noisy pixels from each quadrant. If the there are fewer than three noisy pixels in the level2.evt file, extra rows are filled as -1
| Pixel properties | Quadrant properties | ||||||
|---|---|---|---|---|---|---|---|
| Quadrant | DetID | PixID | Counts | Sigma | Mean | Median | Sigma |
| A | 12 | 96 | 31963 | 198.94 | 775 | 757 | 156.9 |
| A | 13 | 6 | 11888 | 70.96 | 775 | 757 | 156.9 |
| A | 13 | 254 | 11110 | 66.0 | 775 | 757 | 156.9 |
| B | 12 | 111 | 18333 | 118.28 | 769 | 748 | 148.7 |
| B | 11 | 111 | 16779 | 107.82 | 769 | 748 | 148.7 |
| B | 14 | 111 | 15079 | 96.39 | 769 | 748 | 148.7 |
| C | 14 | 238 | 166371 | 966.15 | 731 | 734 | 171.4 |
| C | 3 | 233 | 118406 | 686.37 | 731 | 734 | 171.4 |
| C | 14 | 254 | 73180 | 422.57 | 731 | 734 | 171.4 |
| D | 8 | 195 | 4879139 | 29219.5 | 697 | 675 | 167.0 |
| D | 7 | 80 | 1437907 | 8608.28 | 697 | 675 | 167.0 |
| D | 1 | 52 | 267829 | 1600.12 | 697 | 675 | 167.0 |
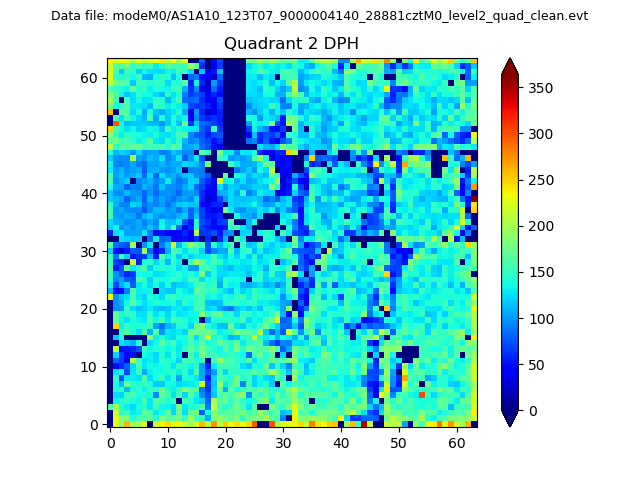
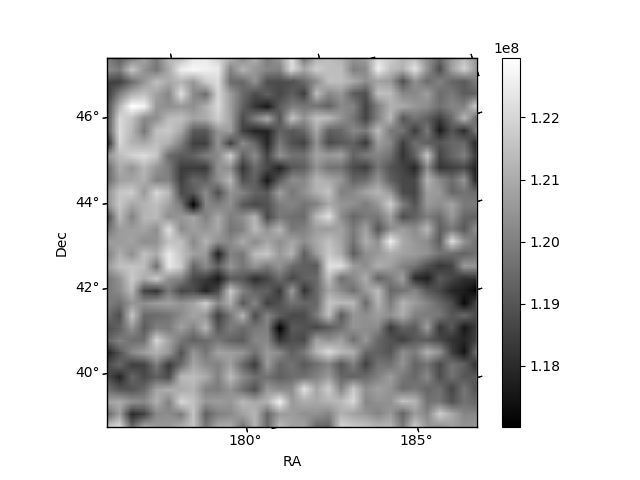
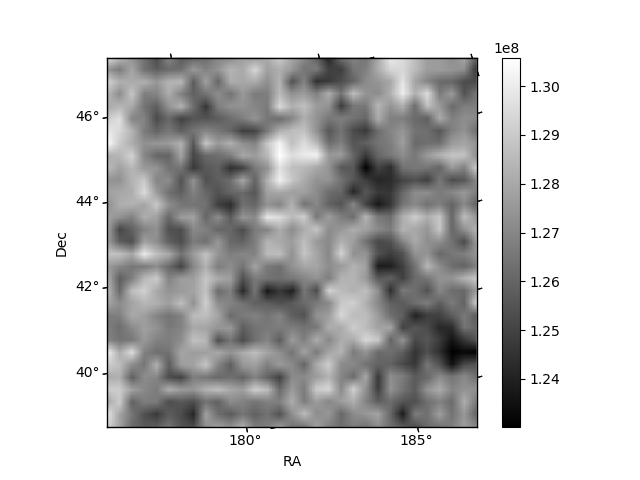
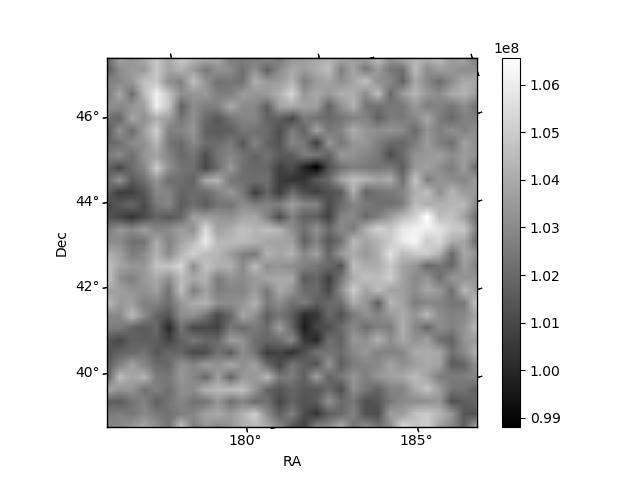
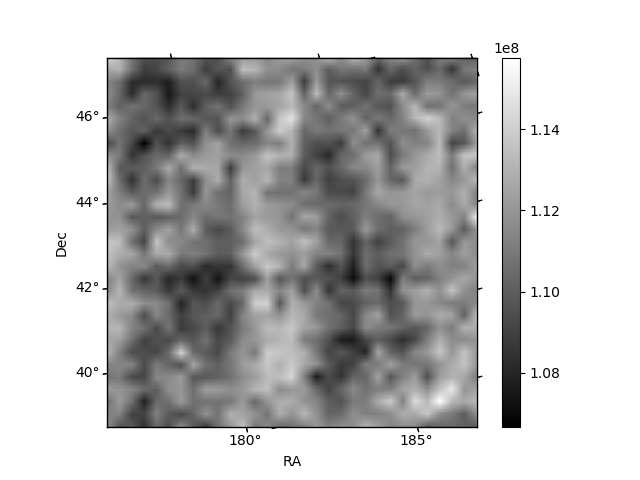
Histogram calculated using DETX and DETY for each event in the final _common_clean file
| Quadrant A | 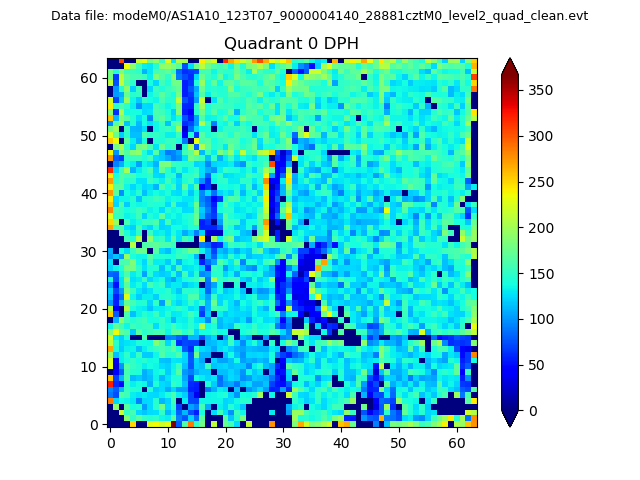 |
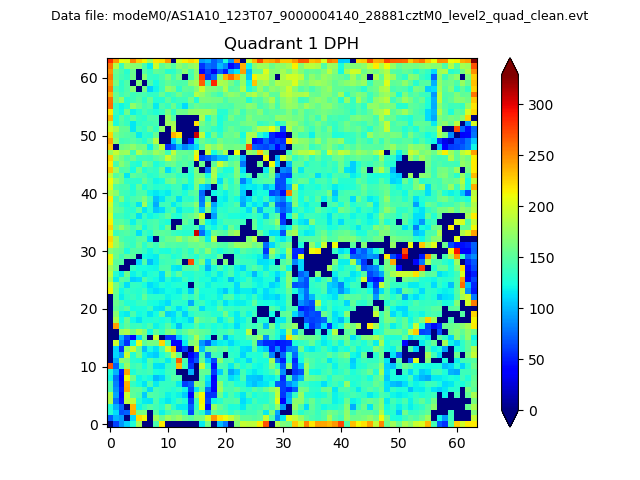 |
Quadrant B |
|---|---|---|---|
| Quadrant D | 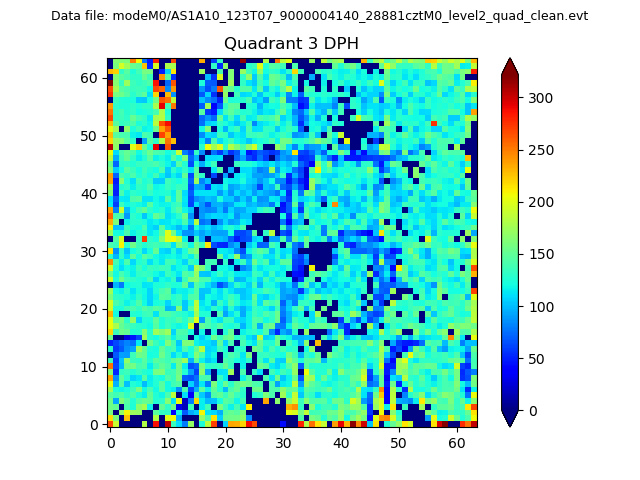 |
 |
Quadrant C |
| Plot type | Count rate plots | Images |
|---|---|---|
| Comparison with Poisson distribution Blue bars denote a histogram of data divided into 1 sec bins. Red curve is a Poisson curve with rate = median count rate of data. |
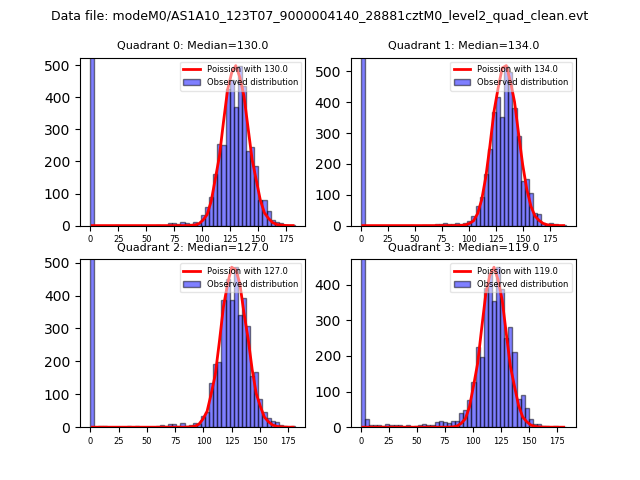 |
 |
| Quadrant-wise count rates Data is divided into 100 sec bins |
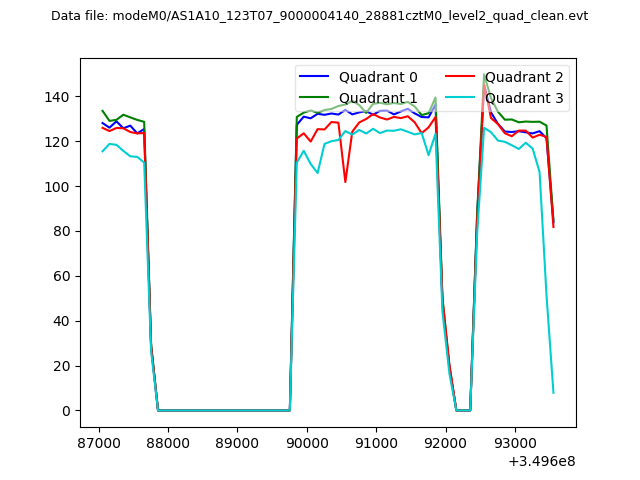 |
|
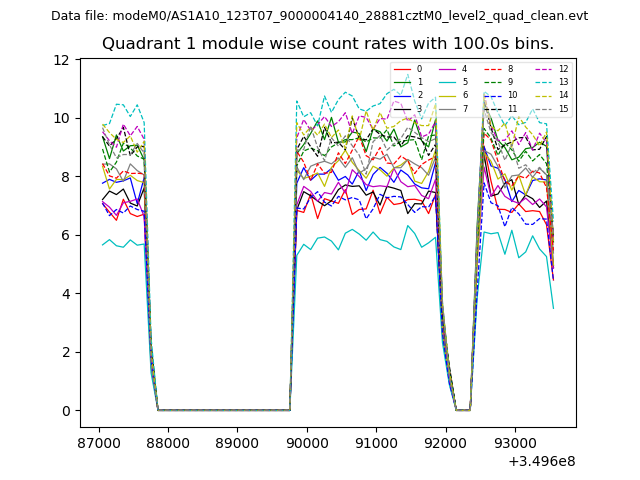
| Module-wise count rates for Quadrant A Data is divided into 100 sec bins |
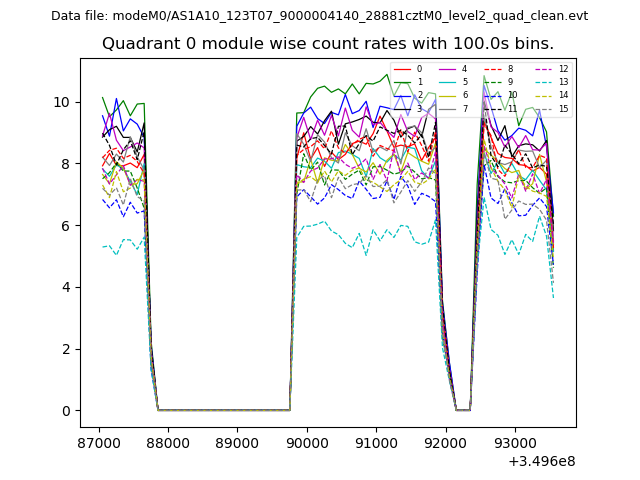 |
 |
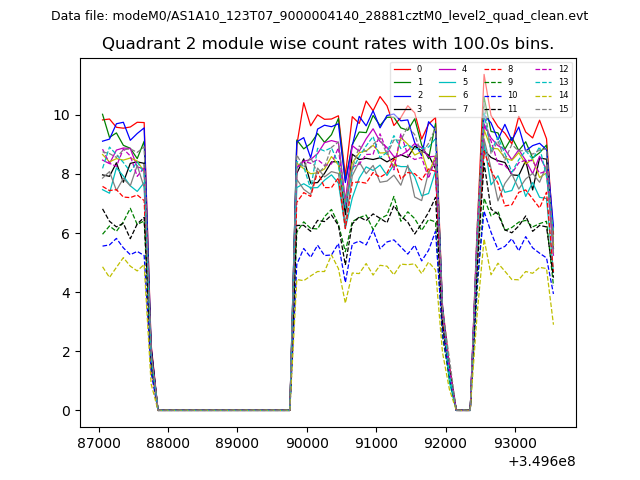
| Module-wise count rates for Quadrant B Data is divided into 100 sec bins |
 |
 |
| Module-wise count rates for Quadrant C Data is divided into 100 sec bins |
 |
 |
| Module-wise count rates for Quadrant D Data is divided into 100 sec bins |
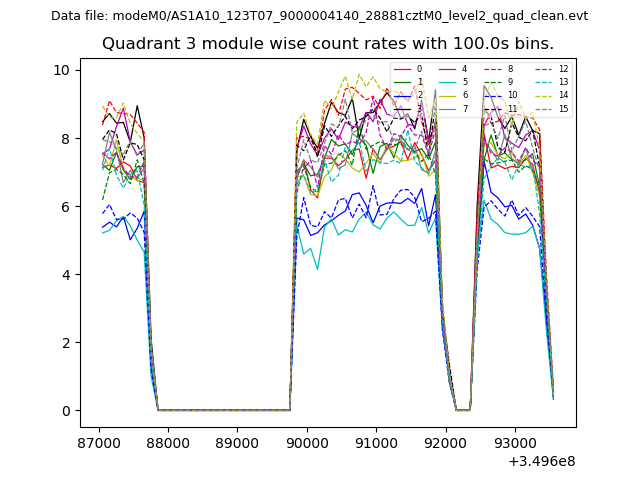 |
 |
| Parameter | Plot |
|---|---|
| CZT HV Monitor | 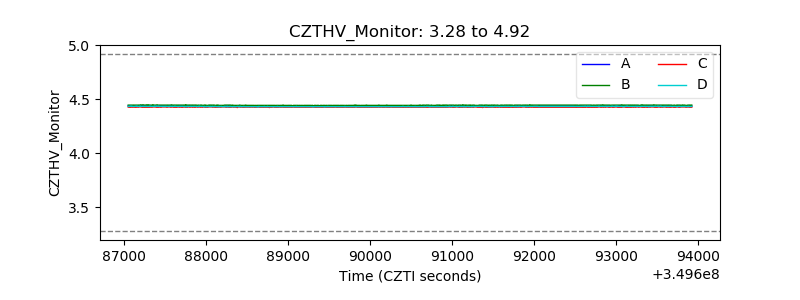 |
| D_VDD | 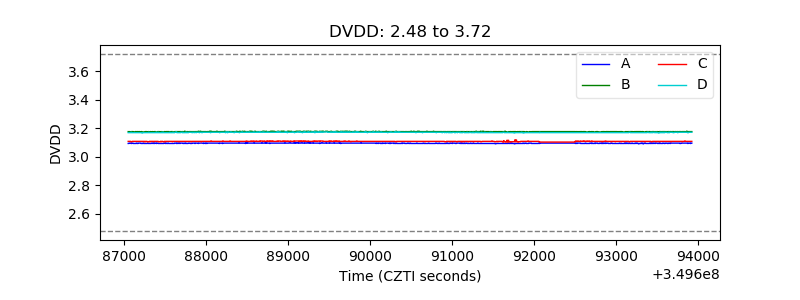 |
| Temperature 1 | 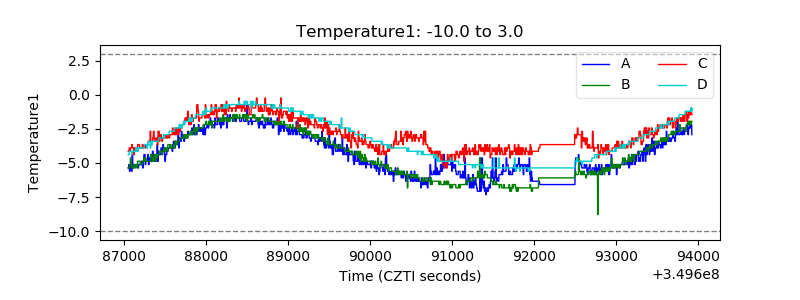 |
| Veto HV Monitor | 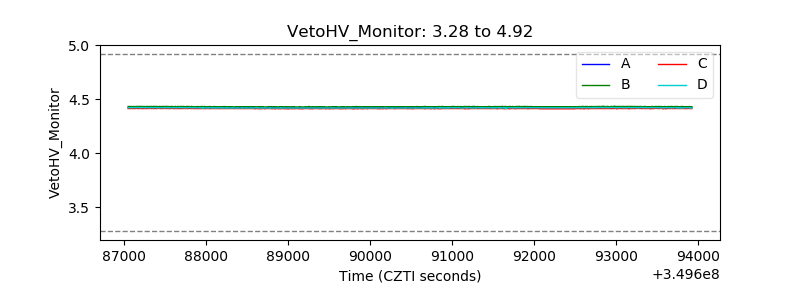 |
| Veto LLD | 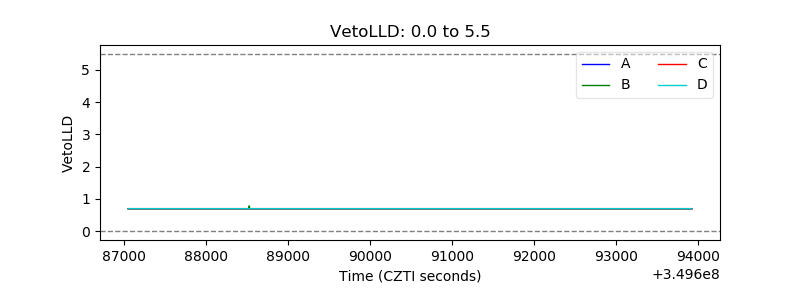 |
| Alpha Counter | 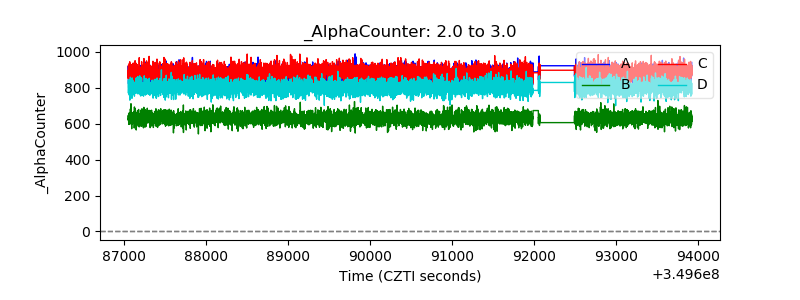 |
| _CPM_Rate | 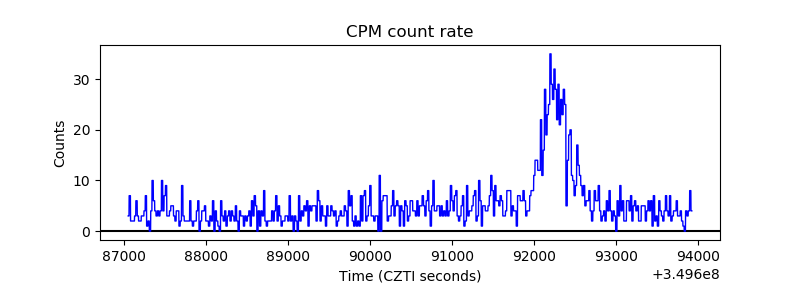 |
| CZT Counter | 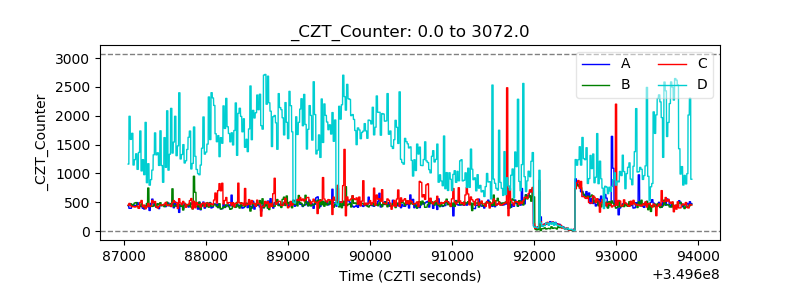 |
| +2.5 Volts monitor |  |
| +5 Volts monitor | 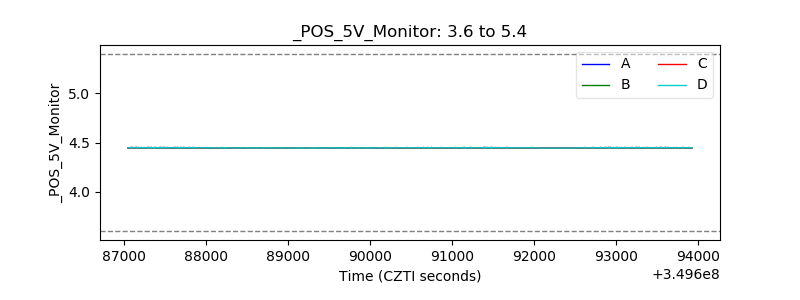 |
| _ROLL_ROT | 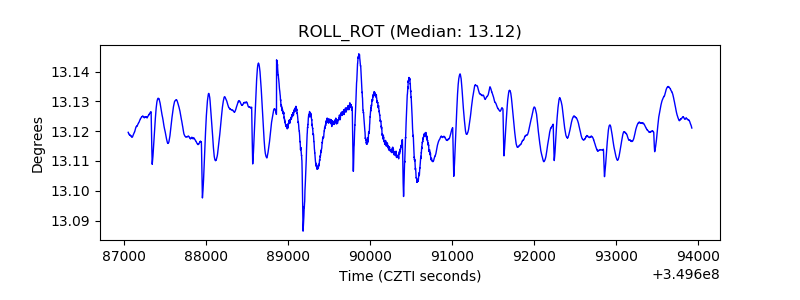 |
| _Roll_DEC | 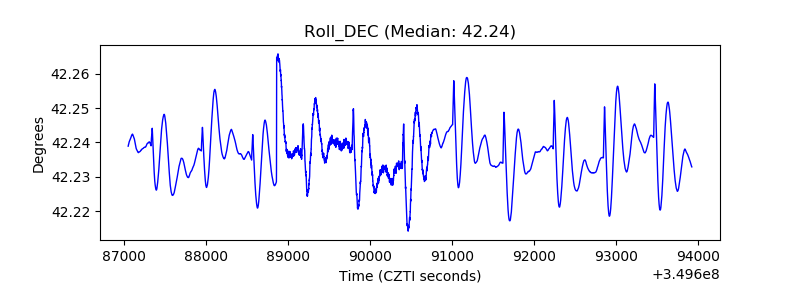 |
| _Roll_RA | 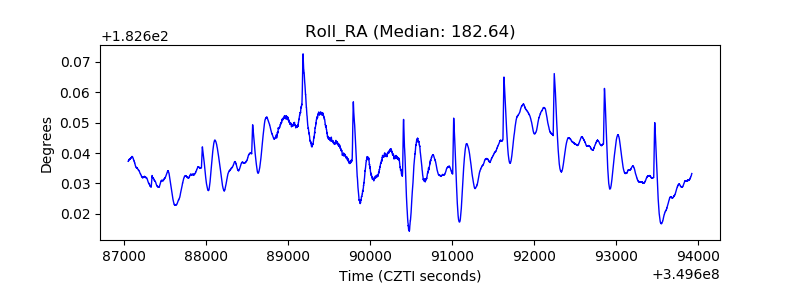 |
| Veto Counter | 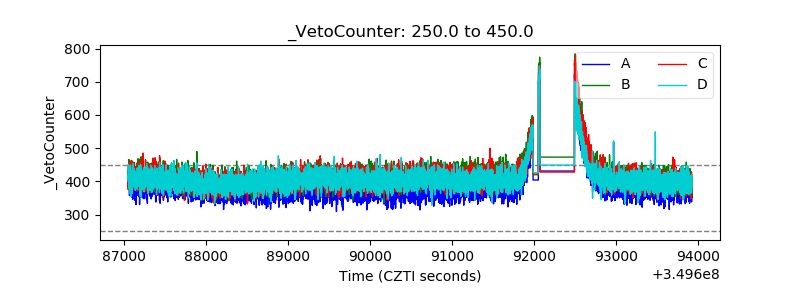 |