| Param | Original file | Final file |
|---|---|---|
| Filename | modeM0/AS1A10_123T07_9000004140_28882cztM0_level2.evt | modeM0/AS1A10_123T07_9000004140_28882cztM0_level2_quad_clean.evt |
| Size (bytes) | 439,139,520 | 53,847,360 |
| Size | 418.8 MB | 51.4 MB |
| Events in quadrant A | 2,178,611 | 338,314 |
| Events in quadrant B | 2,245,924 | 345,134 |
| Events in quadrant C | 2,731,405 | 325,428 |
| Events in quadrant D | 5,820,849 | 287,867 |
| Mode M0 | |||
|---|---|---|---|
| Quadrant | BADHDUFLAG | Total packets | Discarded packets |
| A | 0 | 9581 | 0 |
| B | 0 | 9701 | 0 |
| C | 0 | 11044 | 0 |
| D | 0 | 20551 | 0 |
| Mode SS | |||
|---|---|---|---|
| Quadrant | BADHDUFLAG | Total packets | Discarded packets |
| A | 0 | 96 | 0 |
| B | 0 | 96 | 0 |
| C | 0 | 96 | 0 |
| D | 0 | 96 | 0 |
| Quadrant | Total seconds | Saturated seconds | Saturation percentage |
|---|---|---|---|
| A | 4741 | 3 | 0.063278% |
| B | 4741 | 9 | 0.189833% |
| C | 4741 | 146 | 3.079519% |
| D | 4741 | 1003 | 21.155874% |
Noise dominated data is calculated using 1-second bins in cleaned event files. If a bin has >2000 counts, and if more than 50% of those come from <1% of pixels, then it is considered to be noise-dominated and hence unusable.
| Quadrant | # 1 sec bins | Bins with >0 counts | Bins with >2000 counts | High rate bins dominated by noise | Noise dominated (total time) | Noise dominated (detector-on time) | Marked lightcurve |
|---|---|---|---|---|---|---|---|
| A | 4741 | 4741 | 0 | 0 | 0.00% | 0.00% | 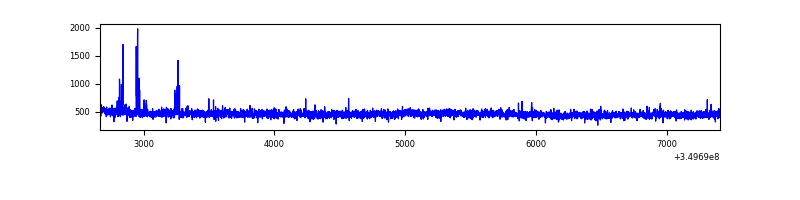 |
| B | 4741 | 4741 | 2 | 2 | 0.04% | 0.04% | 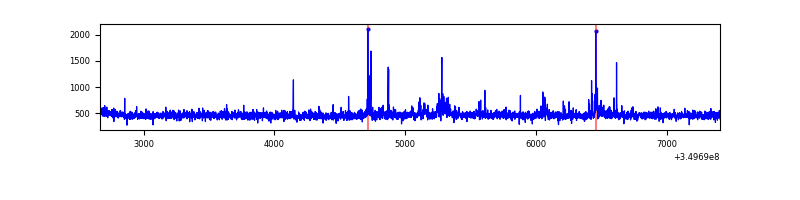 |
| C | 4741 | 4741 | 43 | 43 | 0.91% | 0.91% |  |
| D | 4741 | 4741 | 938 | 938 | 19.78% | 19.78% | 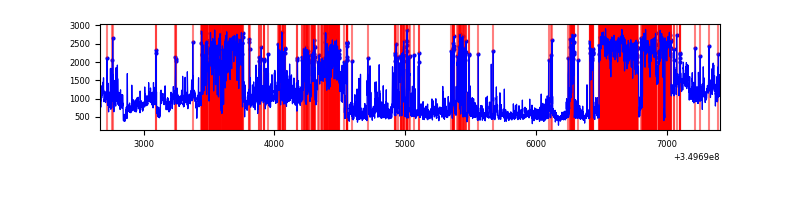 |
Top three noisy pixels from each quadrant. If the there are fewer than three noisy pixels in the level2.evt file, extra rows are filled as -1
| Pixel properties | Quadrant properties | ||||||
|---|---|---|---|---|---|---|---|
| Quadrant | DetID | PixID | Counts | Sigma | Mean | Median | Sigma |
| A | 12 | 96 | 30253 | 264.92 | 554 | 540 | 112.2 |
| A | 13 | 254 | 8715 | 72.89 | 554 | 540 | 112.2 |
| A | 3 | 137 | 5397 | 43.3 | 554 | 540 | 112.2 |
| B | 10 | 245 | 28467 | 260.96 | 552 | 538 | 107.0 |
| B | 15 | 33 | 22738 | 207.43 | 552 | 538 | 107.0 |
| B | 15 | 32 | 21738 | 198.08 | 552 | 538 | 107.0 |
| C | 15 | 208 | 241842 | 1937.33 | 526 | 528 | 124.6 |
| C | 3 | 233 | 207918 | 1664.98 | 526 | 528 | 124.6 |
| C | 14 | 238 | 113932 | 910.44 | 526 | 528 | 124.6 |
| D | 8 | 195 | 2180856 | 18267.85 | 491 | 477 | 119.4 |
| D | 7 | 80 | 992156 | 8308.57 | 491 | 477 | 119.4 |
| D | 1 | 52 | 741595 | 6209.3 | 491 | 477 | 119.4 |
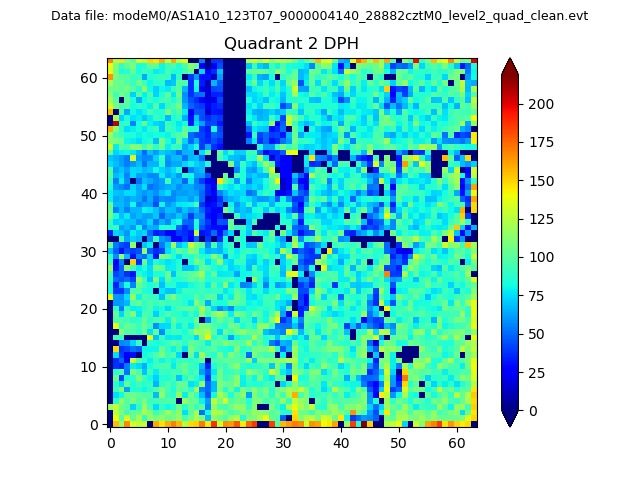
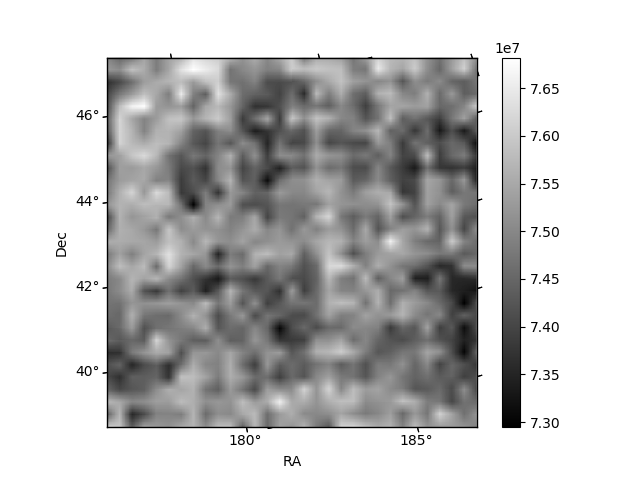
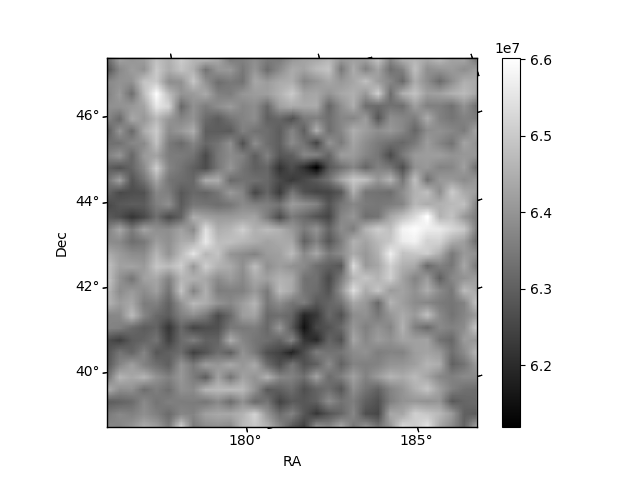
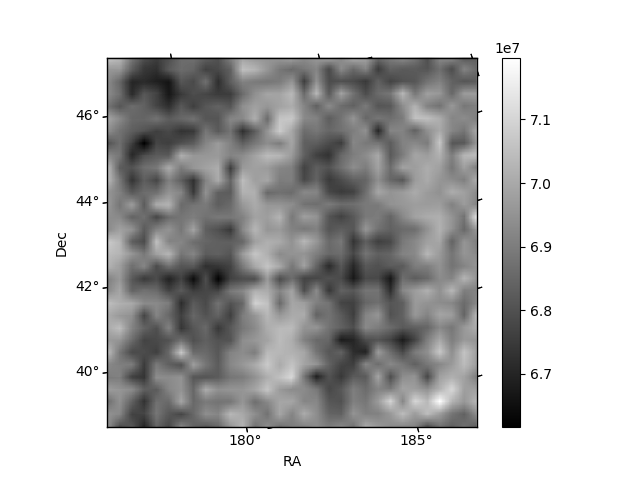
Histogram calculated using DETX and DETY for each event in the final _common_clean file
| Quadrant A | 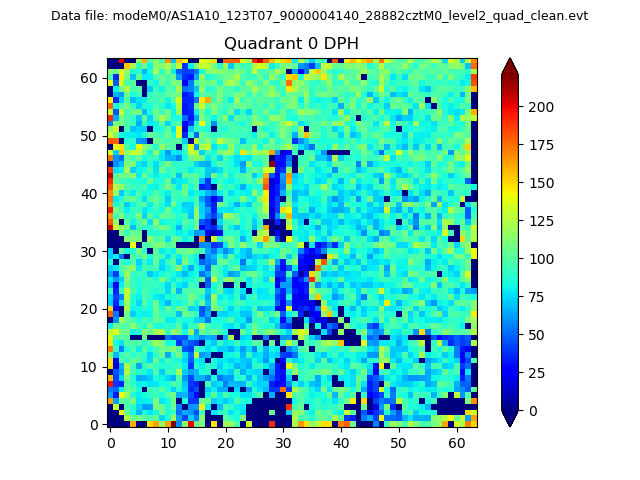 |
 |
Quadrant B |
|---|---|---|---|
| Quadrant D |  |
 |
Quadrant C |
| Plot type | Count rate plots | Images |
|---|---|---|
| Comparison with Poisson distribution Blue bars denote a histogram of data divided into 1 sec bins. Red curve is a Poisson curve with rate = median count rate of data. |
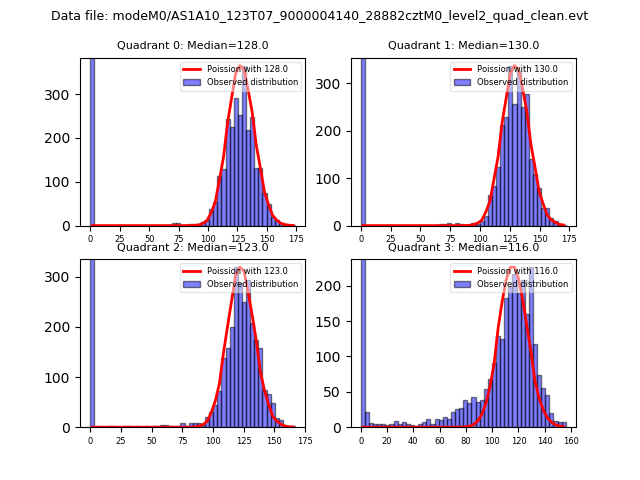 |
 |
| Quadrant-wise count rates Data is divided into 100 sec bins |
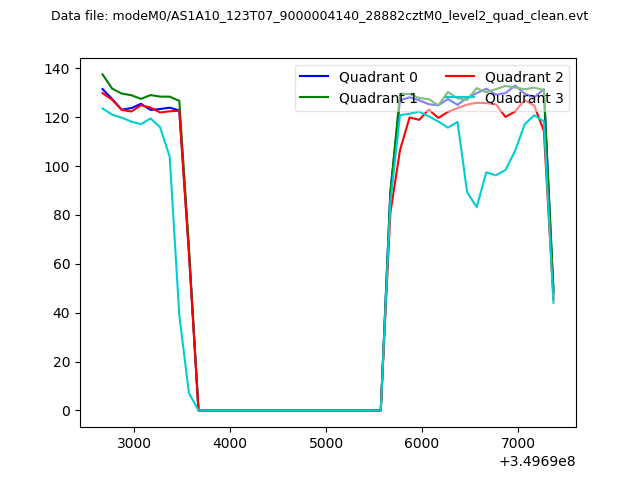 |
|
| Module-wise count rates for Quadrant A Data is divided into 100 sec bins |
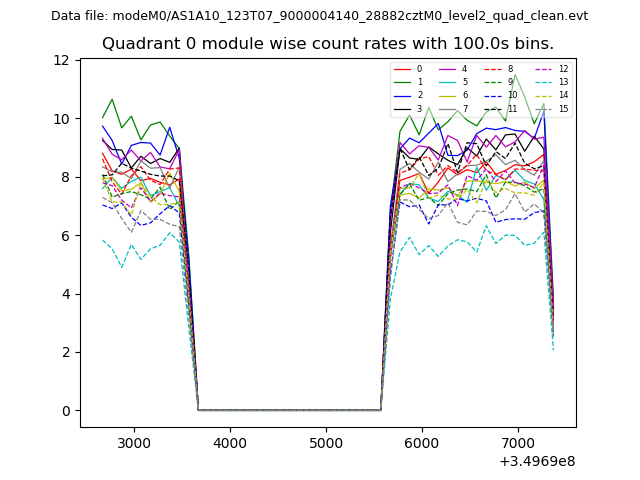 |
 |
| Module-wise count rates for Quadrant B Data is divided into 100 sec bins |
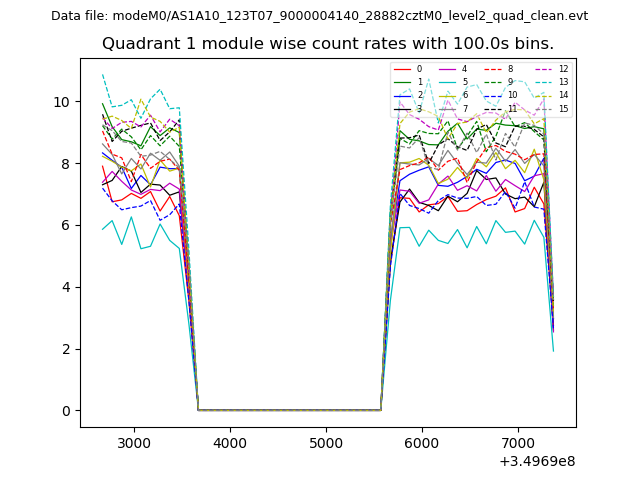 |
 |
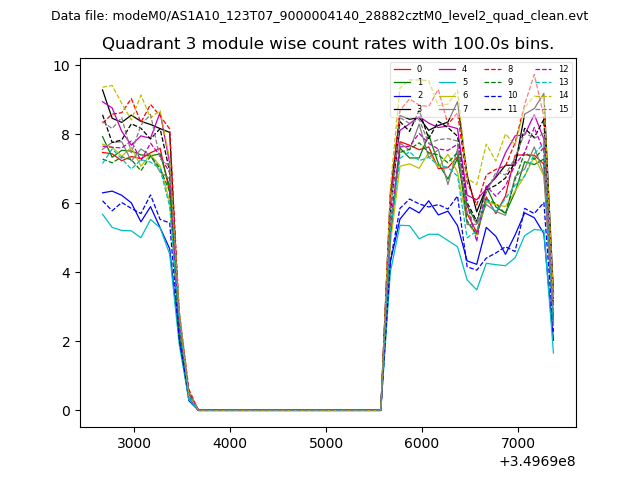
| Module-wise count rates for Quadrant C Data is divided into 100 sec bins |
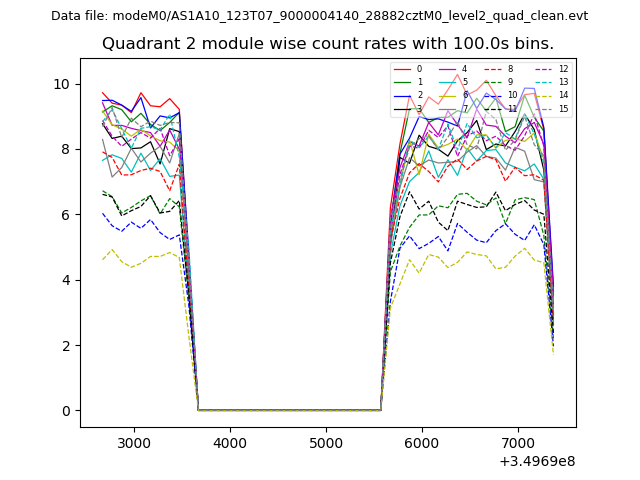 |
 |
| Module-wise count rates for Quadrant D Data is divided into 100 sec bins |
 |
 |
| Parameter | Plot |
|---|---|
| CZT HV Monitor | 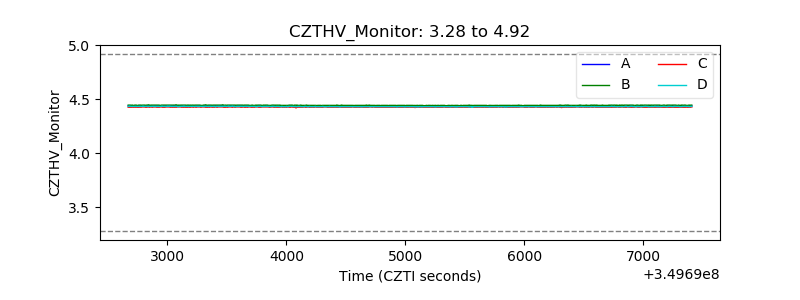 |
| D_VDD | 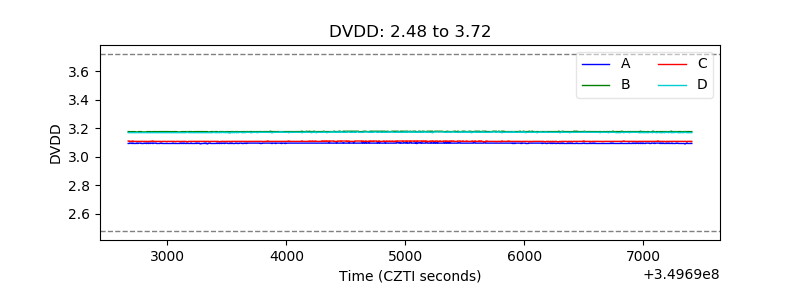 |
| Temperature 1 | 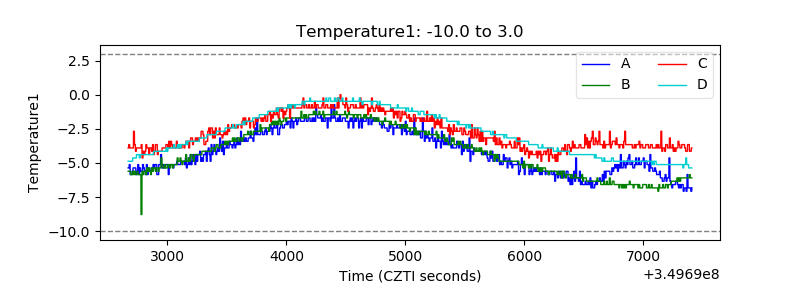 |
| Veto HV Monitor | 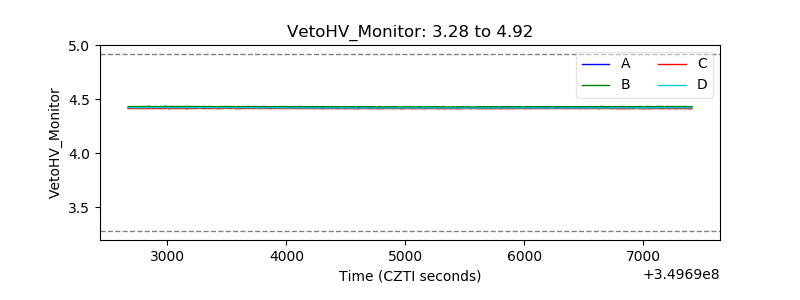 |
| Veto LLD | 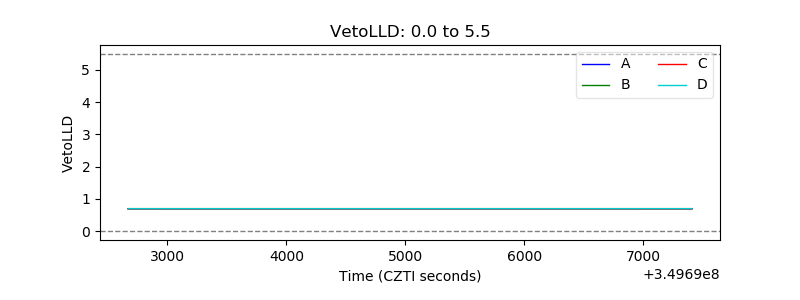 |
| Alpha Counter | 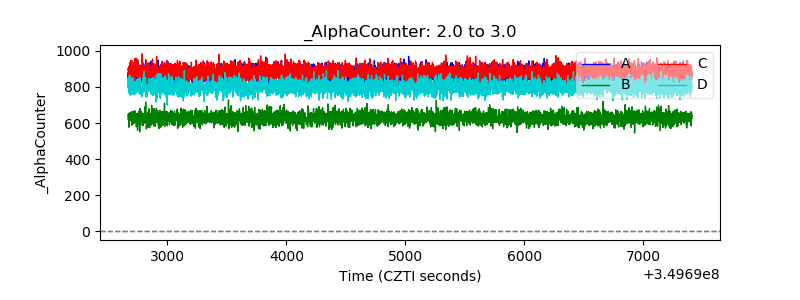 |
| _CPM_Rate | 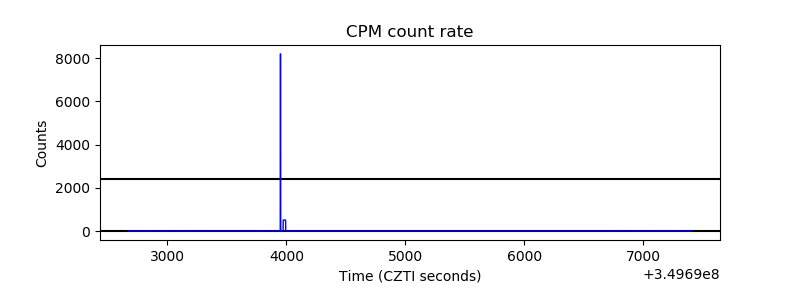 |
| CZT Counter | 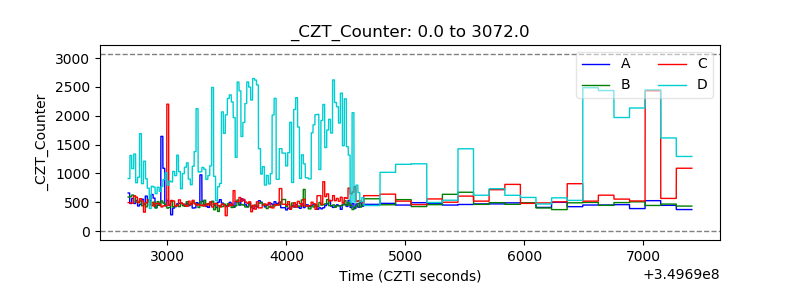 |
| +2.5 Volts monitor |  |
| +5 Volts monitor |  |
| _ROLL_ROT | 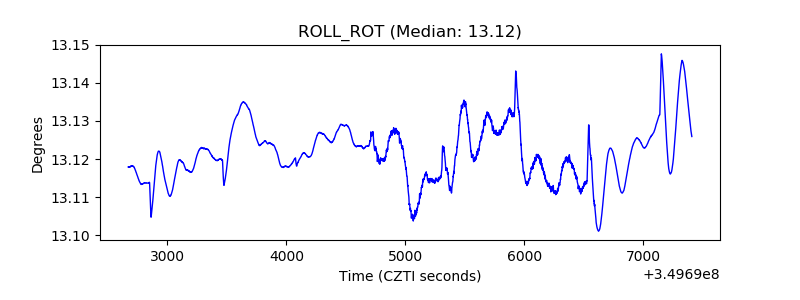 |
| _Roll_DEC | 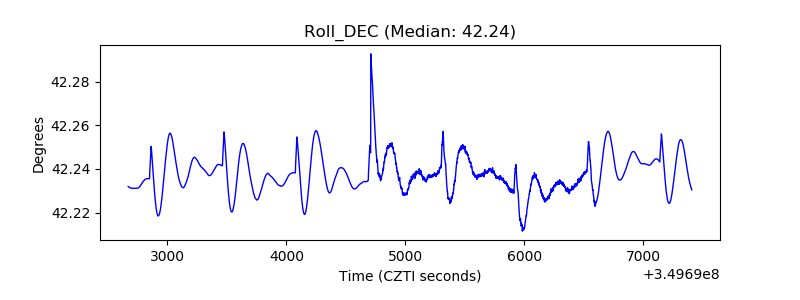 |
| _Roll_RA | 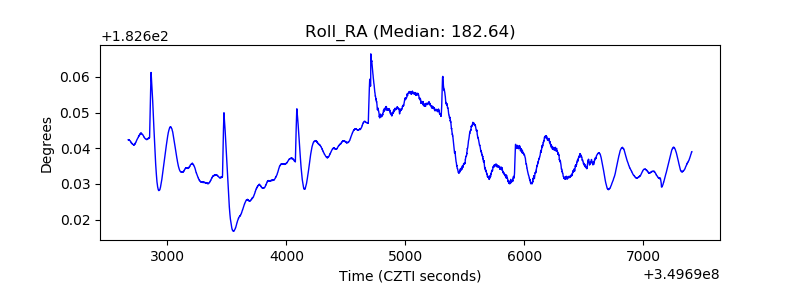 |
| Veto Counter | 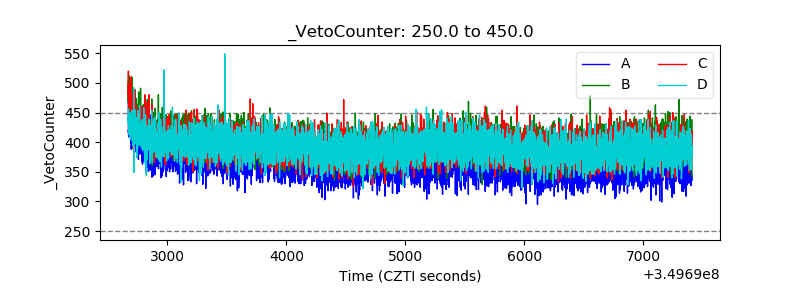 |