| Param | Original file | Final file |
|---|---|---|
| Filename | modeM0/AS1A10_064T01_9000004144_28886cztM0_level2.evt | modeM0/AS1A10_064T01_9000004144_28886cztM0_level2_quad_clean.evt |
| Size (bytes) | 310,847,040 | 45,953,280 |
| Size | 296.4 MB | 43.8 MB |
| Events in quadrant A | 1,332,525 | 319,369 |
| Events in quadrant B | 1,367,616 | 325,732 |
| Events in quadrant C | 2,631,113 | 295,661 |
| Events in quadrant D | 3,902,044 | 260,496 |
| Mode M0 | |||
|---|---|---|---|
| Quadrant | BADHDUFLAG | Total packets | Discarded packets |
| A | 0 | 5490 | 1 |
| B | 0 | 5620 | 1 |
| C | 0 | 9703 | 1 |
| D | 0 | 13485 | 5 |
| Mode SS | |||
|---|---|---|---|
| Quadrant | BADHDUFLAG | Total packets | Discarded packets |
| A | 0 | 56 | 0 |
| B | 0 | 56 | 0 |
| C | 0 | 56 | 0 |
| D | 0 | 56 | 0 |
| Mode M9 | |||
|---|---|---|---|
| Quadrant | BADHDUFLAG | Total packets | Discarded packets |
| A | 0 | 8 | 0 |
| B | 0 | 8 | 0 |
| C | 0 | 8 | 0 |
| D | 0 | 8 | 0 |
| Quadrant | Total seconds | Saturated seconds | Saturation percentage |
|---|---|---|---|
| A | 2643 | 25 | 0.945895% |
| B | 2643 | 41 | 1.551267% |
| C | 2643 | 216 | 8.172531% |
| D | 2642 | 783 | 29.636639% |
Noise dominated data is calculated using 1-second bins in cleaned event files. If a bin has >2000 counts, and if more than 50% of those come from <1% of pixels, then it is considered to be noise-dominated and hence unusable.
| Quadrant | # 1 sec bins | Bins with >0 counts | Bins with >2000 counts | High rate bins dominated by noise | Noise dominated (total time) | Noise dominated (detector-on time) | Marked lightcurve |
|---|---|---|---|---|---|---|---|
| A | 3473 | 2643 | 0 | 0 | 0.00% | 0.00% | 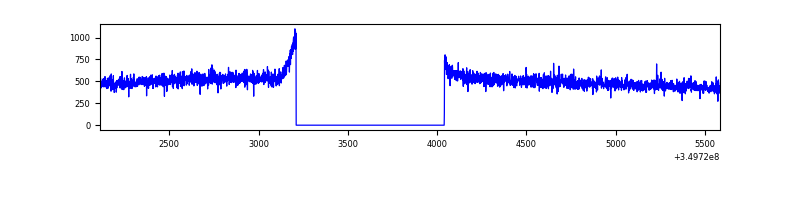 |
| B | 3473 | 2643 | 1 | 1 | 0.03% | 0.04% | 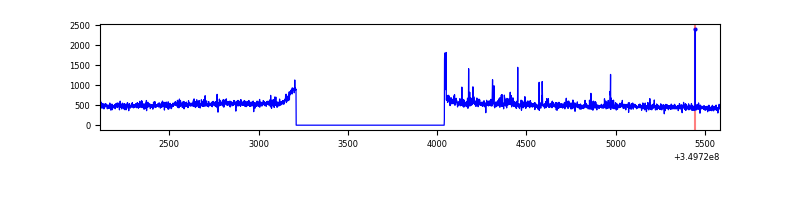 |
| C | 3473 | 2643 | 41 | 41 | 1.18% | 1.55% | 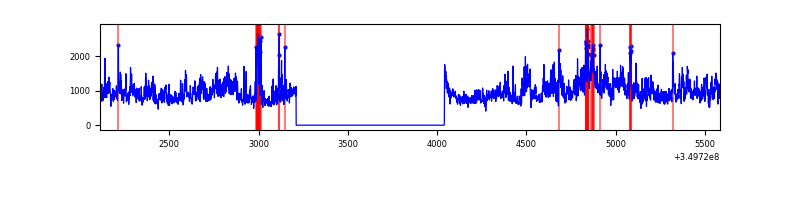 |
| D | 3471 | 2641 | 732 | 732 | 21.09% | 27.72% | 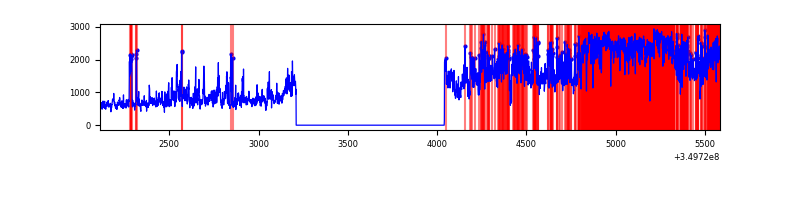 |
Top three noisy pixels from each quadrant. If the there are fewer than three noisy pixels in the level2.evt file, extra rows are filled as -1
| Pixel properties | Quadrant properties | ||||||
|---|---|---|---|---|---|---|---|
| Quadrant | DetID | PixID | Counts | Sigma | Mean | Median | Sigma |
| A | 13 | 254 | 5018 | 65.7 | 344 | 338 | 71.2 |
| A | 3 | 137 | 3383 | 42.75 | 344 | 338 | 71.2 |
| A | 0 | 226 | 2897 | 35.93 | 344 | 338 | 71.2 |
| B | 15 | 32 | 21199 | 312.75 | 339 | 330 | 66.7 |
| B | 12 | 111 | 8242 | 118.57 | 339 | 330 | 66.7 |
| B | 15 | 201 | 7388 | 105.77 | 339 | 330 | 66.7 |
| C | 3 | 233 | 1206397 | 15466.35 | 322 | 323 | 78.0 |
| C | 15 | 208 | 97348 | 1244.22 | 322 | 323 | 78.0 |
| C | 14 | 238 | 54659 | 696.79 | 322 | 323 | 78.0 |
| D | 8 | 195 | 1957672 | 26351.78 | 306 | 297 | 74.3 |
| D | 1 | 52 | 446367 | 6005.36 | 306 | 297 | 74.3 |
| D | 7 | 80 | 306429 | 4121.4 | 306 | 297 | 74.3 |
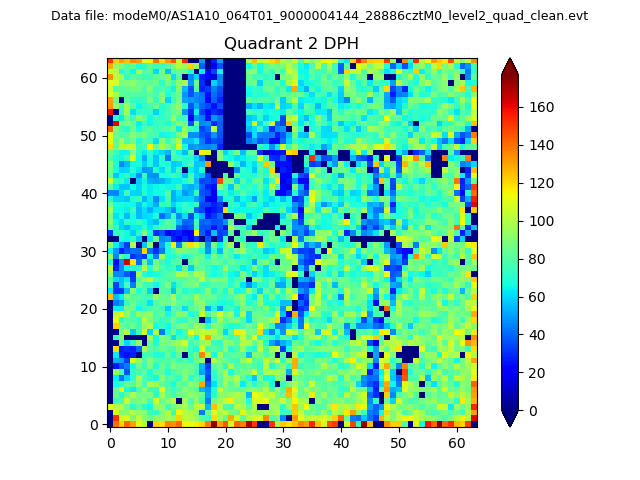
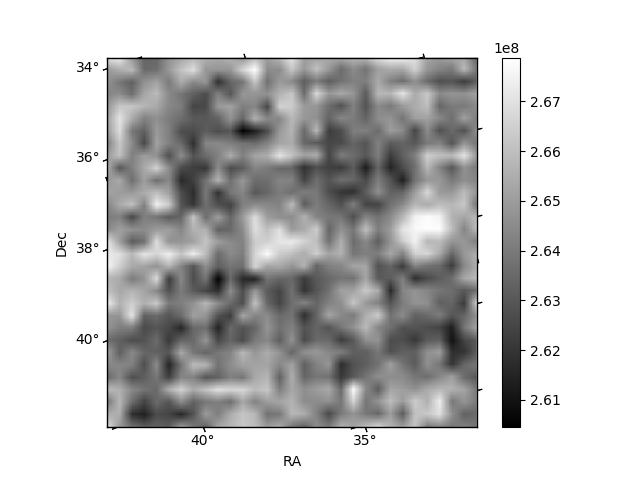
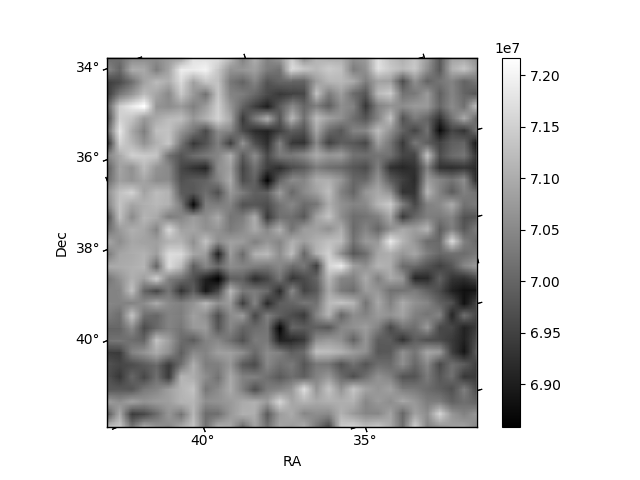
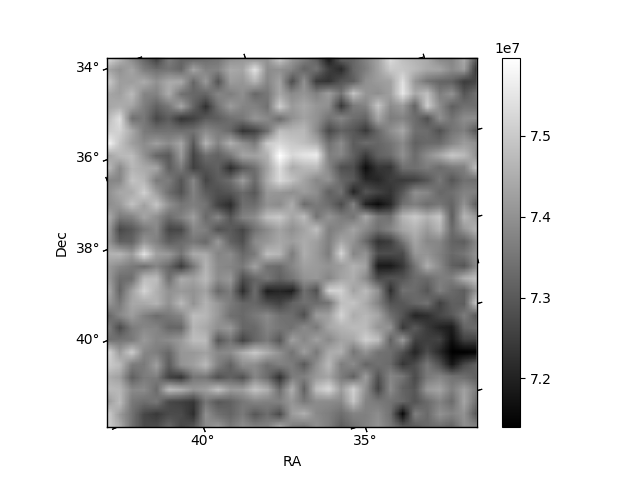
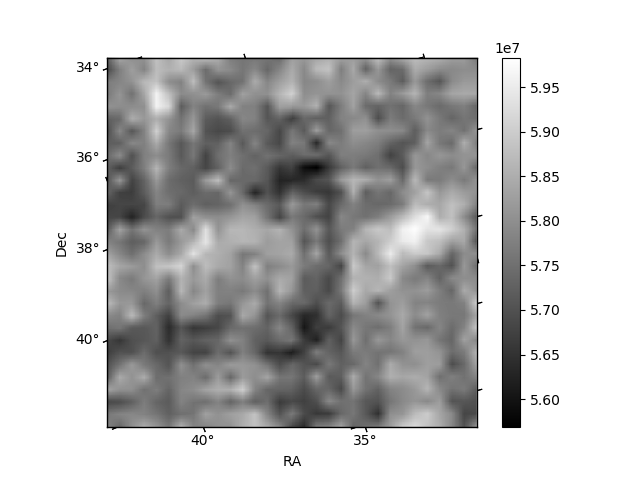
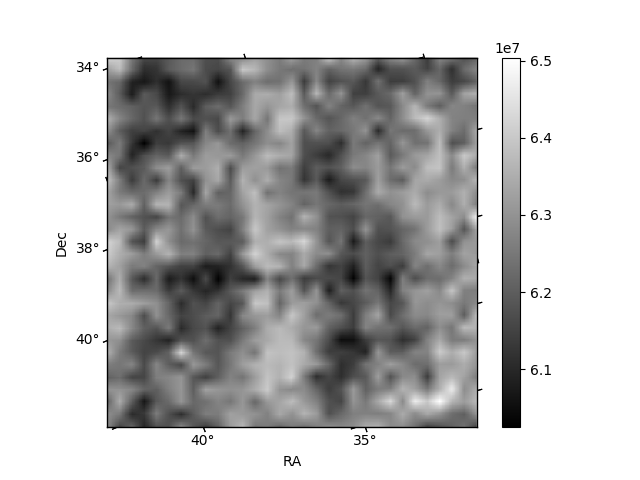
Histogram calculated using DETX and DETY for each event in the final _common_clean file
| Quadrant A | 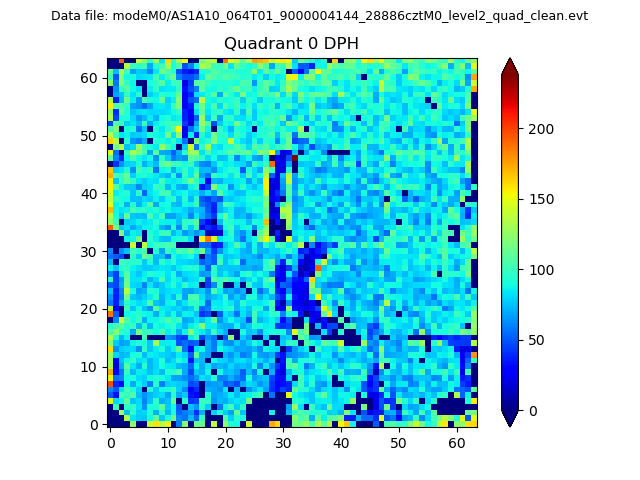 |
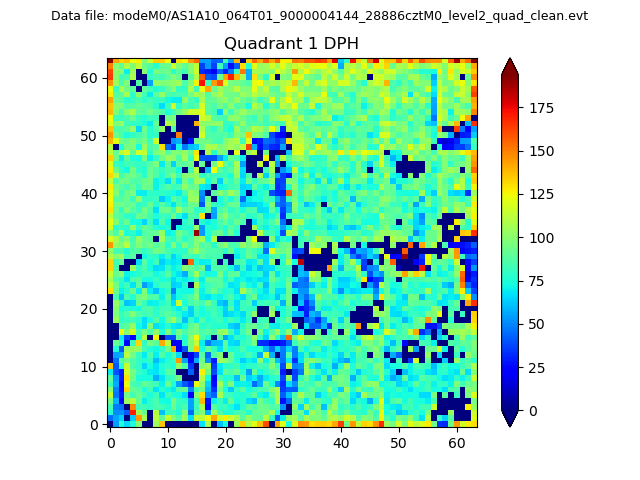 |
Quadrant B |
|---|---|---|---|
| Quadrant D | 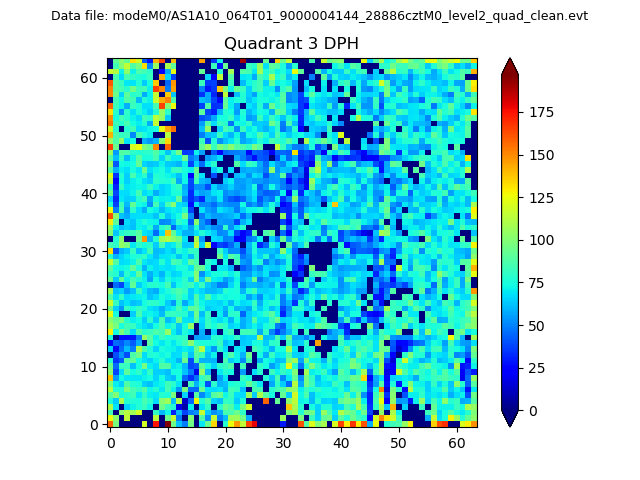 |
 |
Quadrant C |
| Plot type | Count rate plots | Images |
|---|---|---|
| Comparison with Poisson distribution Blue bars denote a histogram of data divided into 1 sec bins. Red curve is a Poisson curve with rate = median count rate of data. |
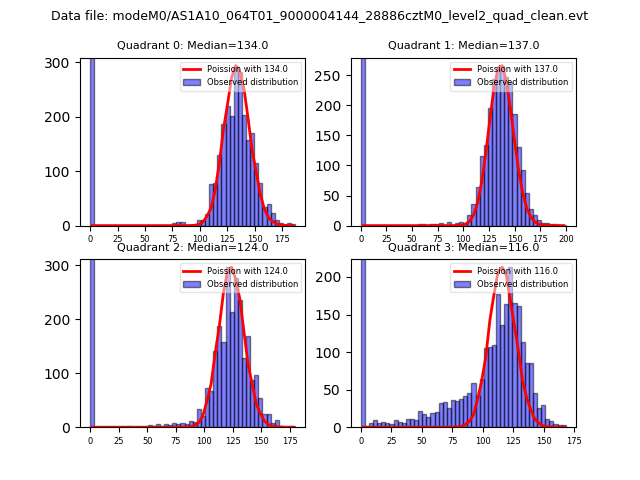 |
 |
| Quadrant-wise count rates Data is divided into 100 sec bins |
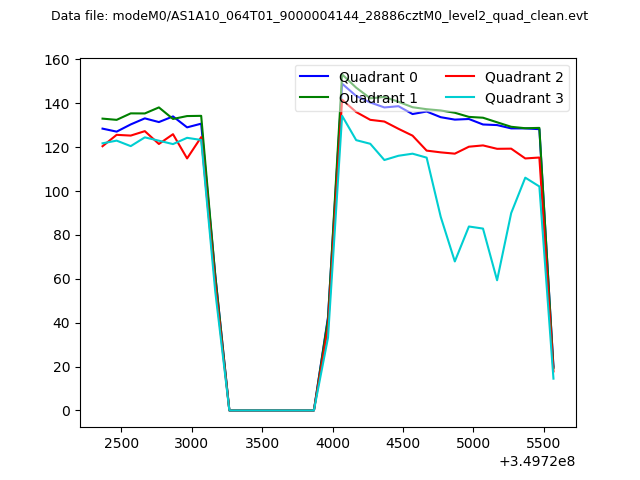 |
|
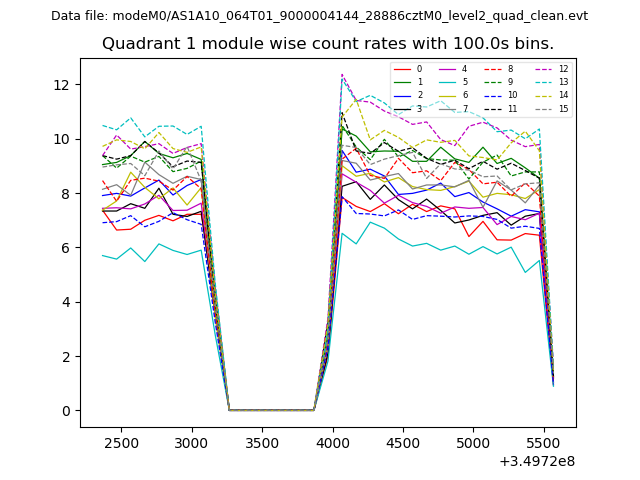
| Module-wise count rates for Quadrant A Data is divided into 100 sec bins |
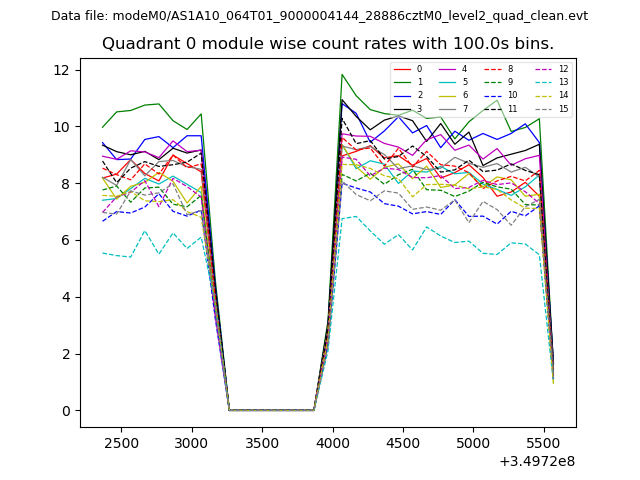 |
 |
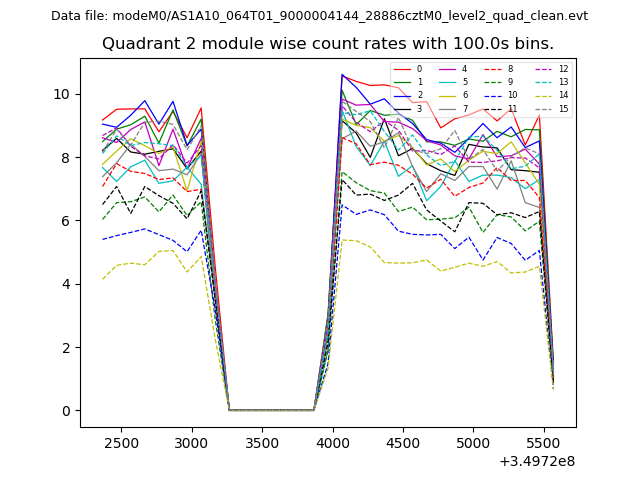
| Module-wise count rates for Quadrant B Data is divided into 100 sec bins |
 |
 |
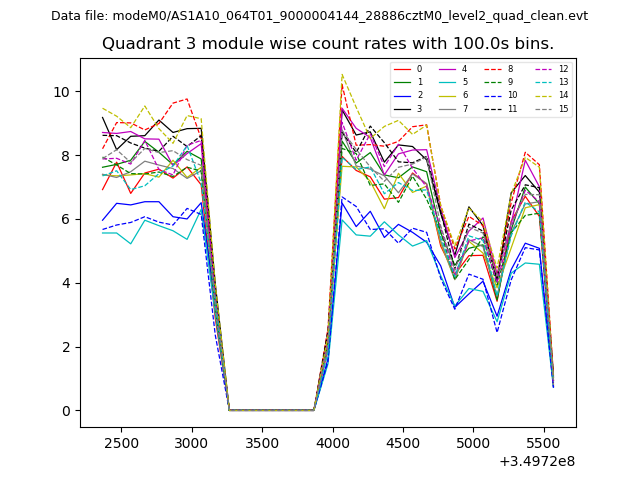
| Module-wise count rates for Quadrant C Data is divided into 100 sec bins |
 |
 |
| Module-wise count rates for Quadrant D Data is divided into 100 sec bins |
 |
 |
| Parameter | Plot |
|---|---|
| CZT HV Monitor | 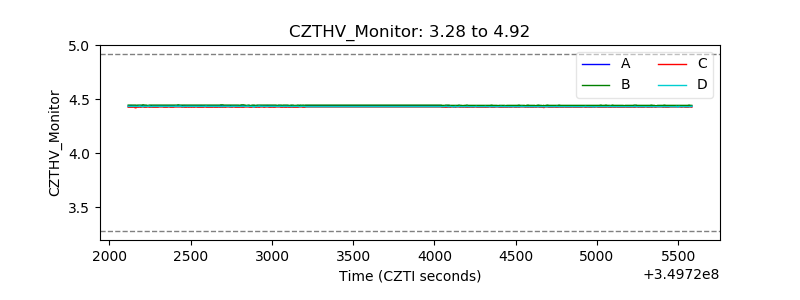 |
| D_VDD | 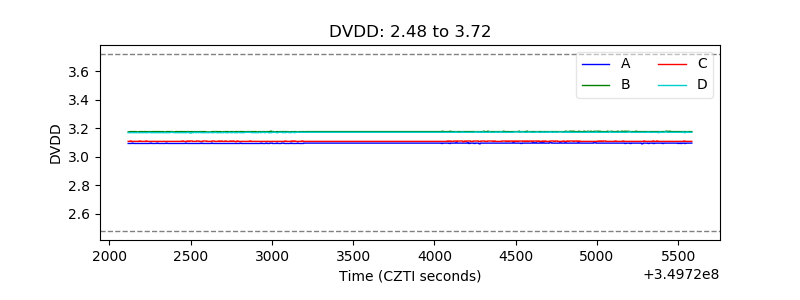 |
| Temperature 1 | 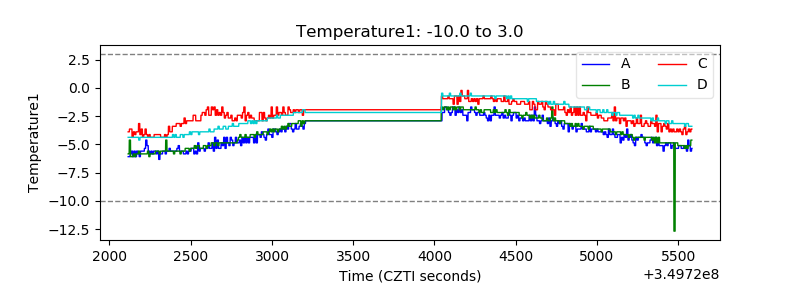 |
| Veto HV Monitor | 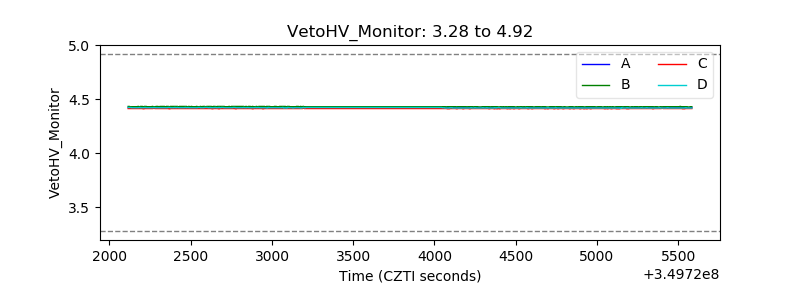 |
| Veto LLD | 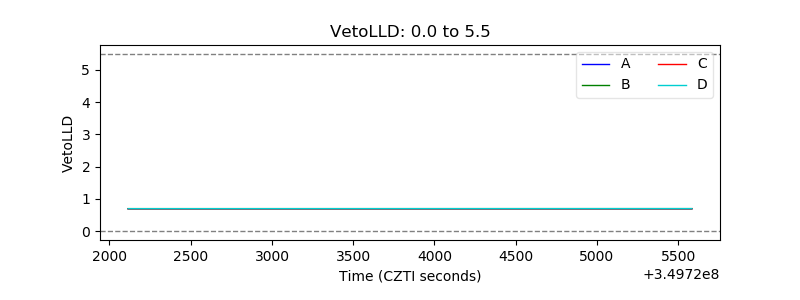 |
| Alpha Counter | 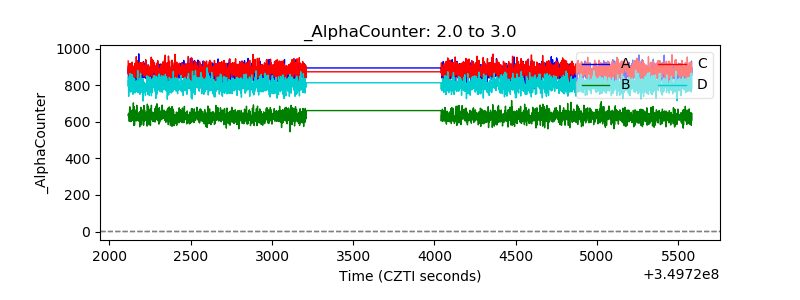 |
| _CPM_Rate | 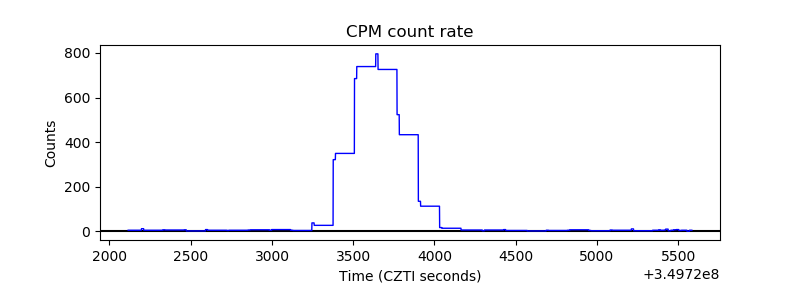 |
| CZT Counter | 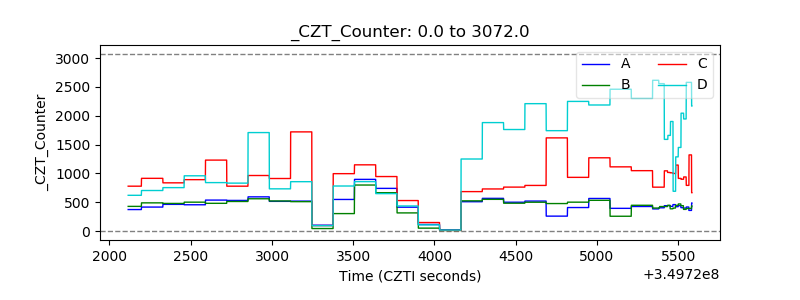 |
| +2.5 Volts monitor |  |
| +5 Volts monitor |  |
| _ROLL_ROT | 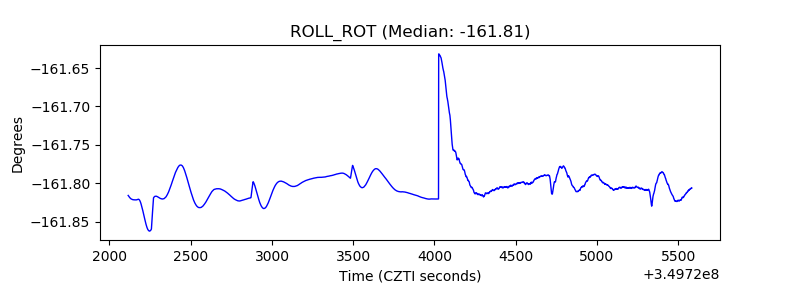 |
| _Roll_DEC | 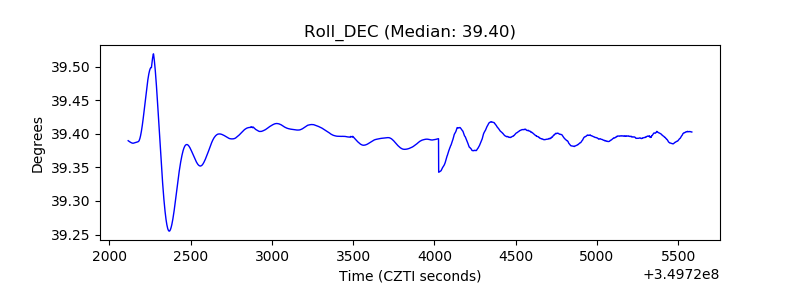 |
| _Roll_RA | 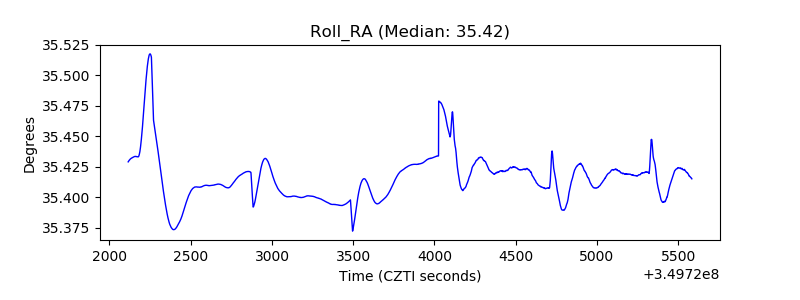 |
| Veto Counter | 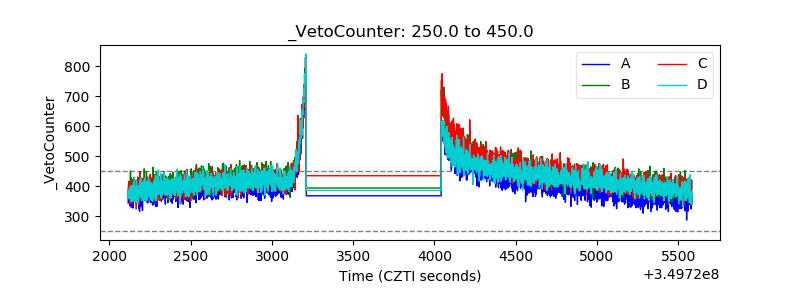 |