| Param | Original file | Final file |
|---|---|---|
| Filename | modeM0/AS1A10_064T01_9000004144_28887cztM0_level2.evt | modeM0/AS1A10_064T01_9000004144_28887cztM0_level2_quad_clean.evt |
| Size (bytes) | 765,610,560 | 87,347,520 |
| Size | 730.1 MB | 83.3 MB |
| Events in quadrant A | 3,007,461 | 592,890 |
| Events in quadrant B | 3,088,329 | 603,570 |
| Events in quadrant C | 4,857,537 | 557,641 |
| Events in quadrant D | 11,798,899 | 441,178 |
| Mode M0 | |||
|---|---|---|---|
| Quadrant | BADHDUFLAG | Total packets | Discarded packets |
| A | 0 | 13160 | 1 |
| B | 0 | 13324 | 1 |
| C | 0 | 18950 | 1 |
| D | 0 | 39457 | 7 |
| Mode SS | |||
|---|---|---|---|
| Quadrant | BADHDUFLAG | Total packets | Discarded packets |
| A | 0 | 130 | 0 |
| B | 0 | 130 | 0 |
| C | 0 | 130 | 0 |
| D | 0 | 130 | 0 |
| Mode M9 | |||
|---|---|---|---|
| Quadrant | BADHDUFLAG | Total packets | Discarded packets |
| A | 0 | 10 | 0 |
| B | 0 | 10 | 0 |
| C | 0 | 10 | 0 |
| D | 0 | 10 | 0 |
| Quadrant | Total seconds | Saturated seconds | Saturation percentage |
|---|---|---|---|
| A | 6433 | 34 | 0.528525% |
| B | 6434 | 45 | 0.699409% |
| C | 6434 | 235 | 3.652471% |
| D | 6433 | 3096 | 48.126846% |
Noise dominated data is calculated using 1-second bins in cleaned event files. If a bin has >2000 counts, and if more than 50% of those come from <1% of pixels, then it is considered to be noise-dominated and hence unusable.
| Quadrant | # 1 sec bins | Bins with >0 counts | Bins with >2000 counts | High rate bins dominated by noise | Noise dominated (total time) | Noise dominated (detector-on time) | Marked lightcurve |
|---|---|---|---|---|---|---|---|
| A | 7398 | 6433 | 0 | 0 | 0.00% | 0.00% | 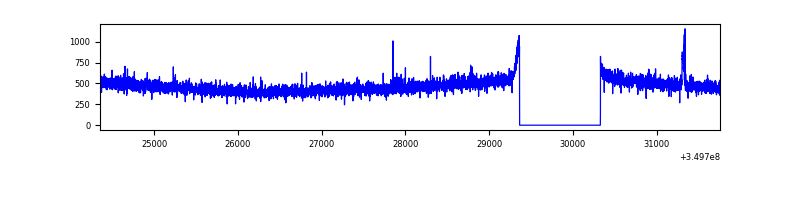 |
| B | 7399 | 6434 | 1 | 1 | 0.01% | 0.02% | 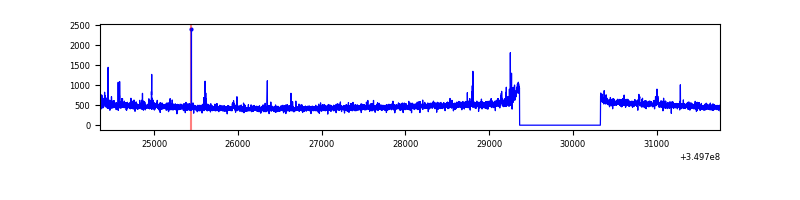 |
| C | 7399 | 6434 | 41 | 41 | 0.55% | 0.64% | 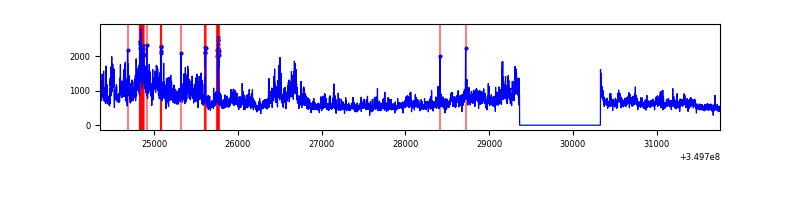 |
| D | 7397 | 6432 | 3296 | 3296 | 44.56% | 51.24% |  |
Top three noisy pixels from each quadrant. If the there are fewer than three noisy pixels in the level2.evt file, extra rows are filled as -1
| Pixel properties | Quadrant properties | ||||||
|---|---|---|---|---|---|---|---|
| Quadrant | DetID | PixID | Counts | Sigma | Mean | Median | Sigma |
| A | 6 | 16 | 14562 | 89.05 | 773 | 758 | 155.0 |
| A | 13 | 254 | 11708 | 70.64 | 773 | 758 | 155.0 |
| A | 3 | 137 | 7566 | 43.92 | 773 | 758 | 155.0 |
| B | 0 | 190 | 21296 | 139.24 | 772 | 752 | 147.5 |
| B | 15 | 32 | 18427 | 119.79 | 772 | 752 | 147.5 |
| B | 12 | 111 | 18122 | 117.73 | 772 | 752 | 147.5 |
| C | 3 | 233 | 1795463 | 10203.49 | 744 | 746 | 175.9 |
| C | 14 | 238 | 123393 | 697.28 | 744 | 746 | 175.9 |
| C | 2 | 114 | 15418 | 83.41 | 744 | 746 | 175.9 |
| D | 8 | 195 | 7786978 | 49727.23 | 653 | 633 | 156.6 |
| D | 1 | 52 | 1194818 | 7626.62 | 653 | 633 | 156.6 |
| D | 7 | 80 | 305440 | 1946.64 | 653 | 633 | 156.6 |
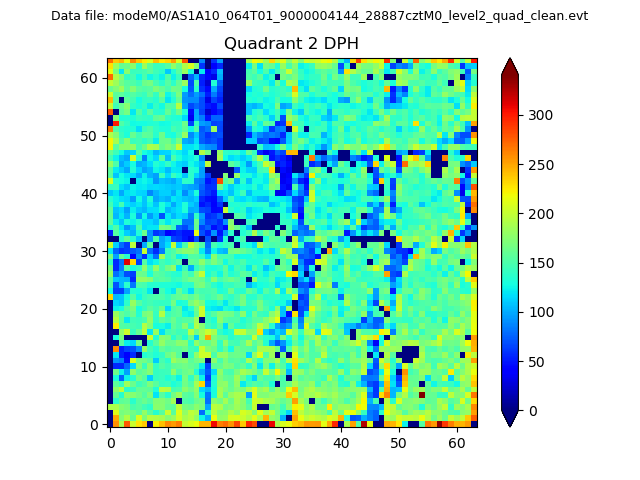
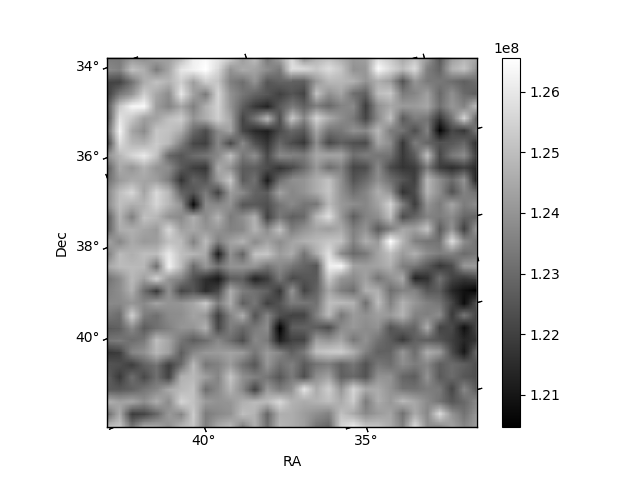
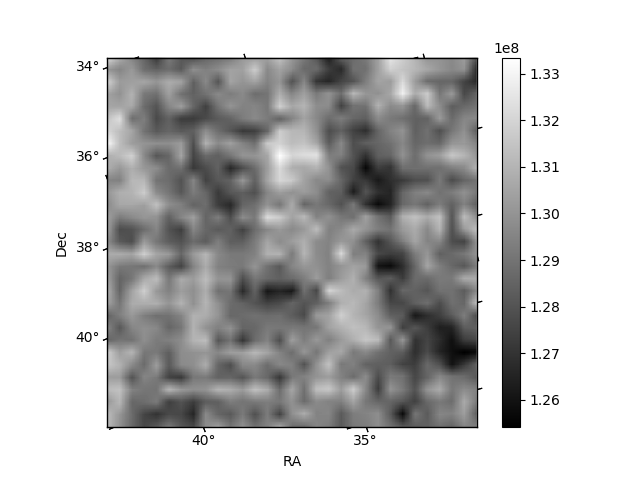
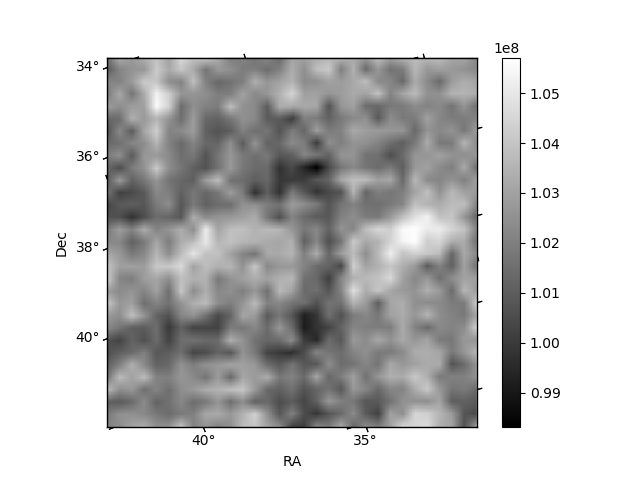
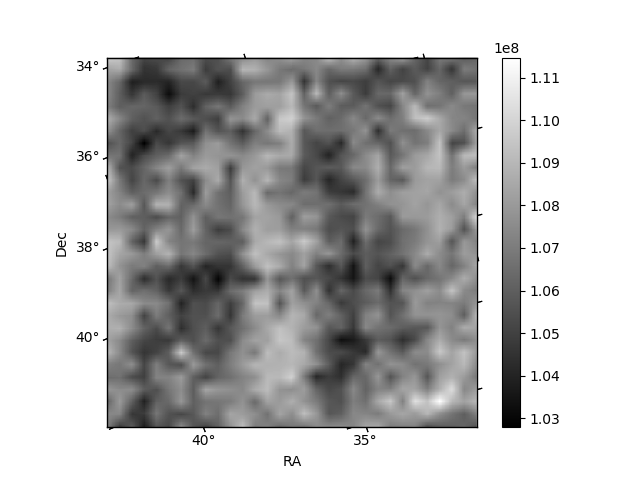
Histogram calculated using DETX and DETY for each event in the final _common_clean file
| Quadrant A | 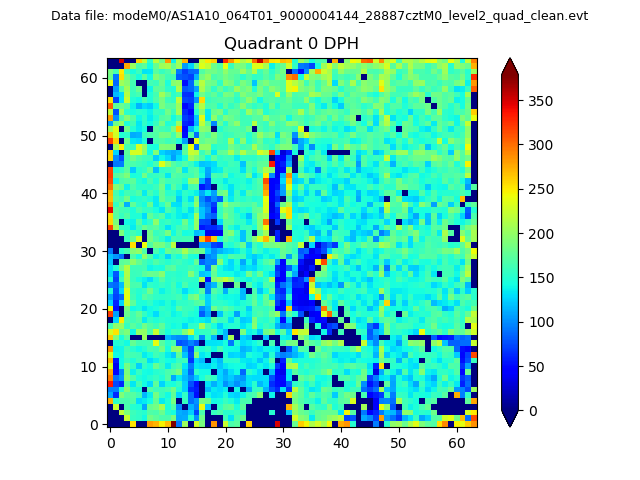 |
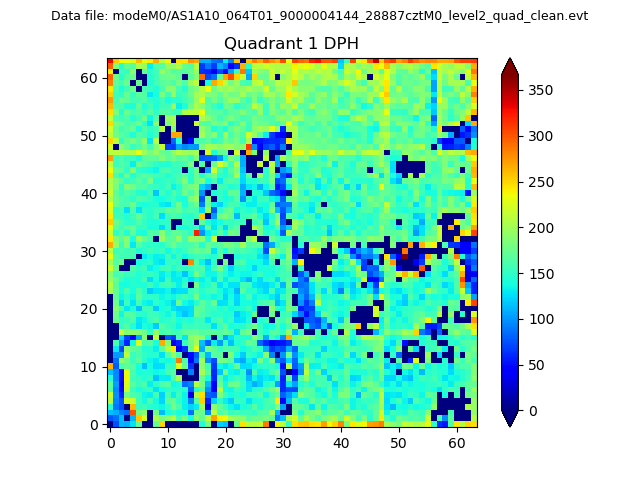 |
Quadrant B |
|---|---|---|---|
| Quadrant D | 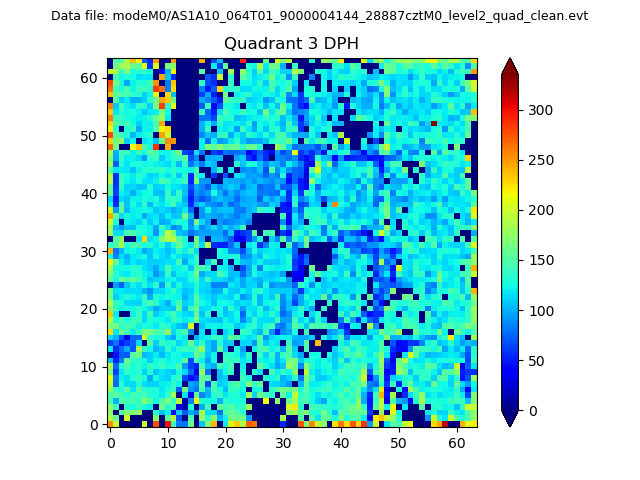 |
 |
Quadrant C |
| Plot type | Count rate plots | Images |
|---|---|---|
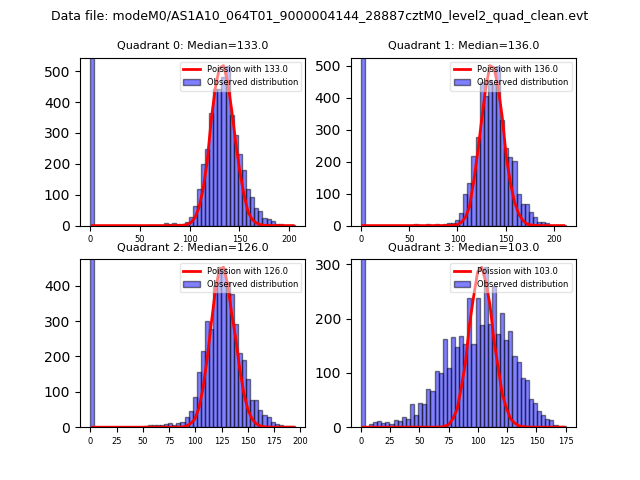
| Comparison with Poisson distribution Blue bars denote a histogram of data divided into 1 sec bins. Red curve is a Poisson curve with rate = median count rate of data. |
 |
 |
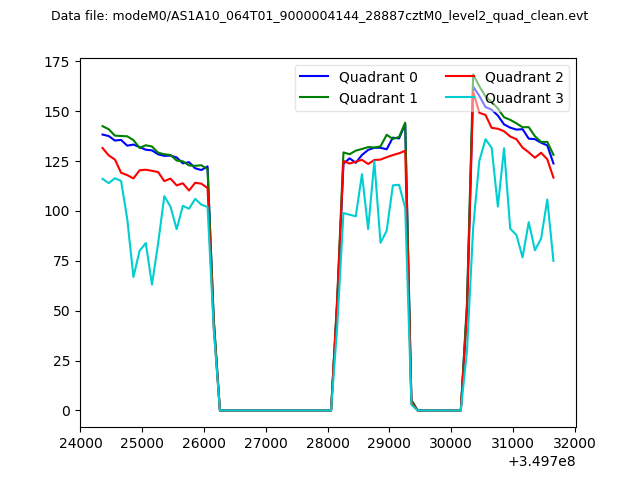
| Quadrant-wise count rates Data is divided into 100 sec bins |
 |
|
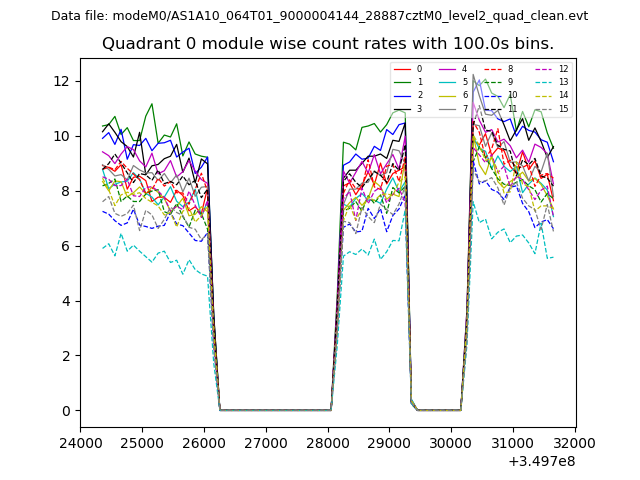
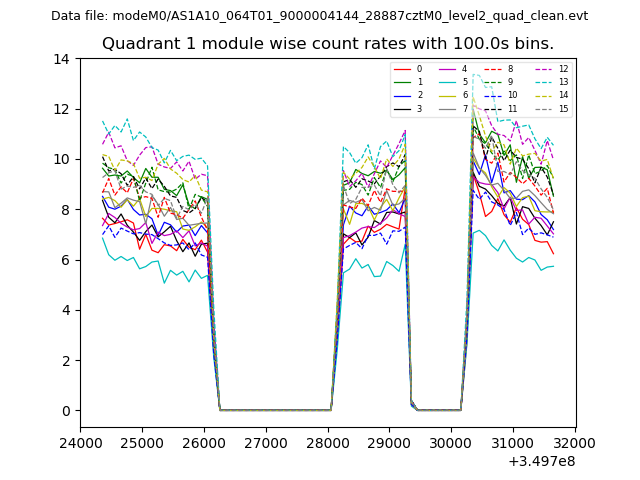
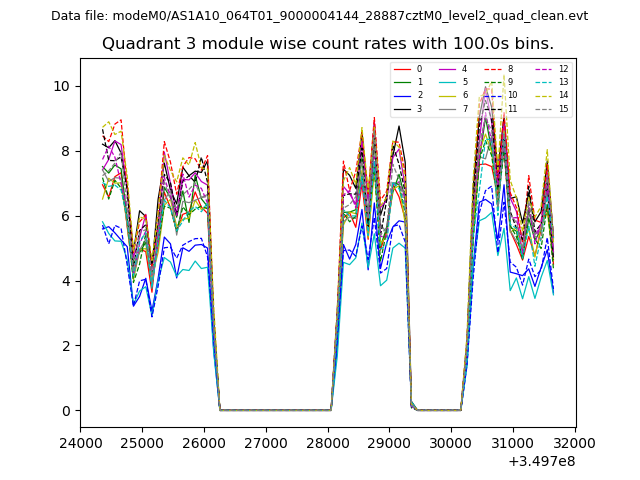
| Module-wise count rates for Quadrant A Data is divided into 100 sec bins |
 |
 |
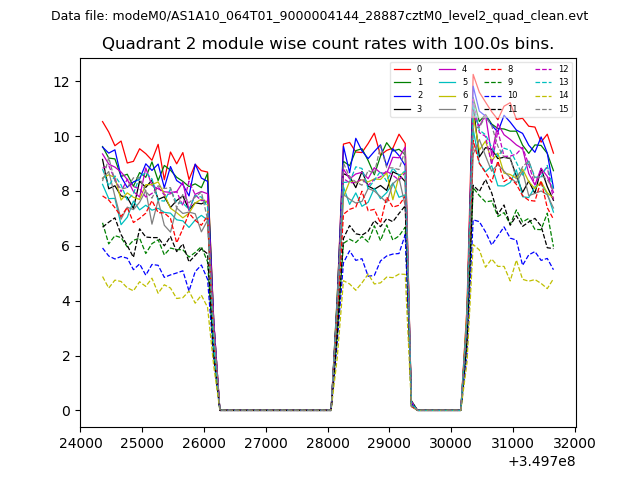
| Module-wise count rates for Quadrant B Data is divided into 100 sec bins |
 |
 |
| Module-wise count rates for Quadrant C Data is divided into 100 sec bins |
 |
 |
| Module-wise count rates for Quadrant D Data is divided into 100 sec bins |
 |
 |
| Parameter | Plot |
|---|---|
| CZT HV Monitor | 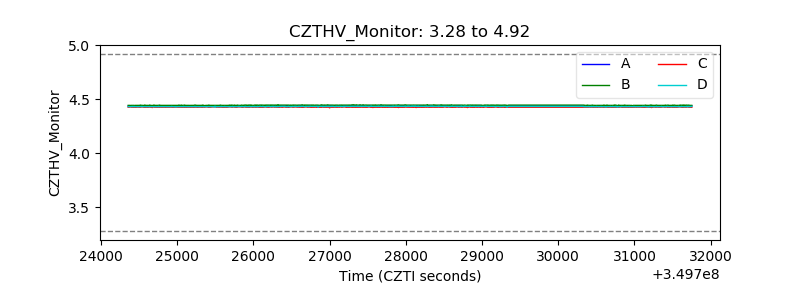 |
| D_VDD | 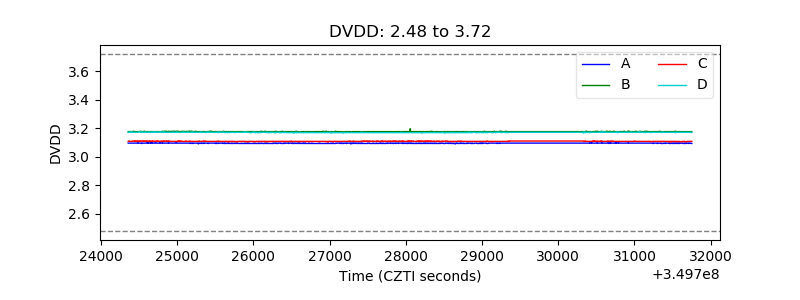 |
| Temperature 1 | 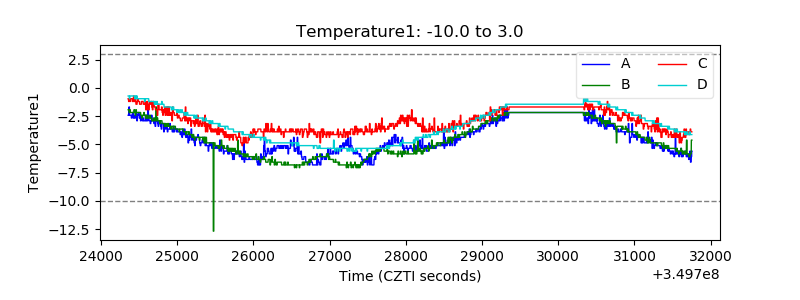 |
| Veto HV Monitor | 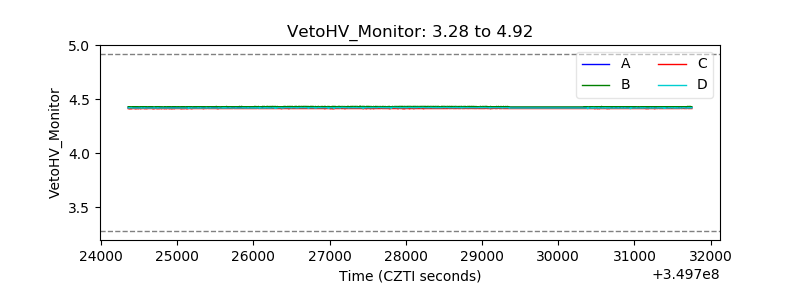 |
| Veto LLD | 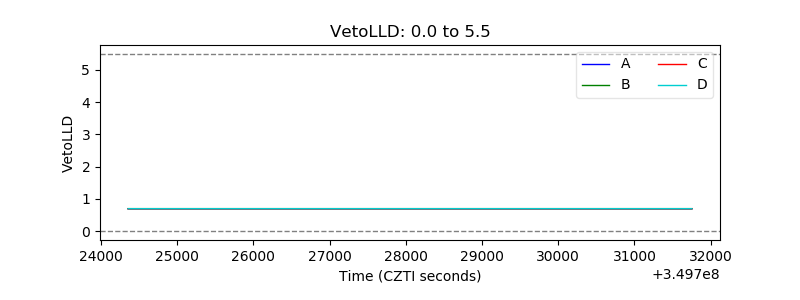 |
| Alpha Counter |  |
| _CPM_Rate | 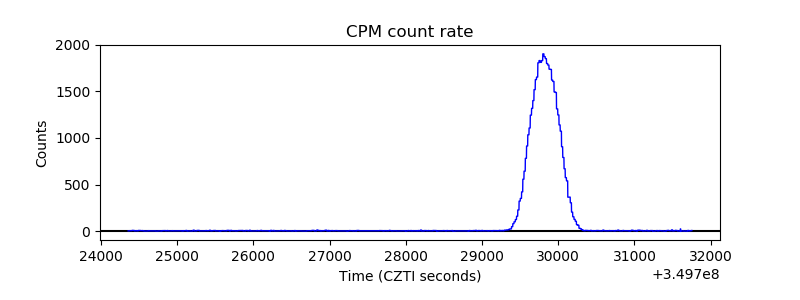 |
| CZT Counter | 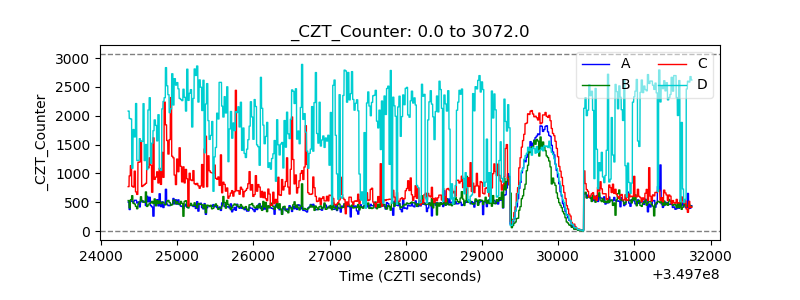 |
| +2.5 Volts monitor | 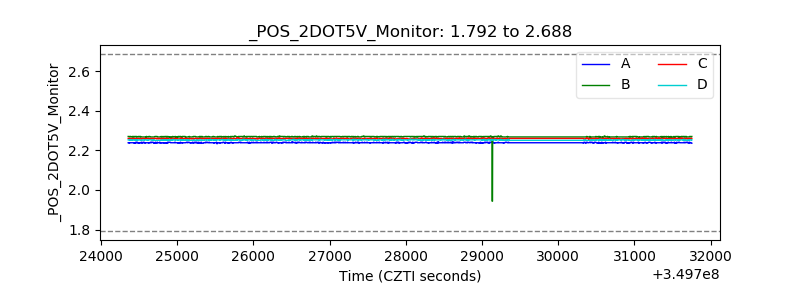 |
| +5 Volts monitor |  |
| _ROLL_ROT | 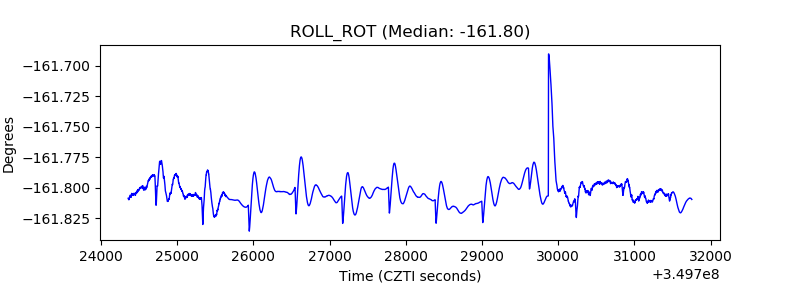 |
| _Roll_DEC | 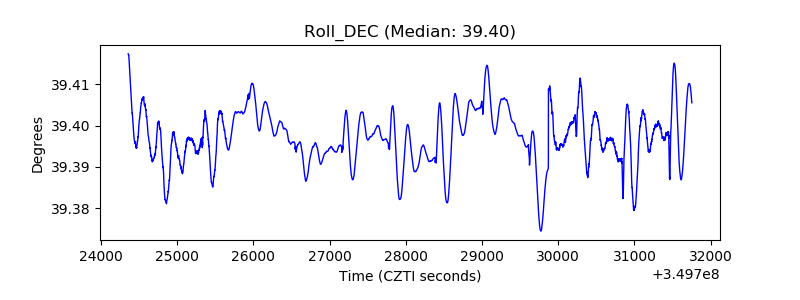 |
| _Roll_RA | 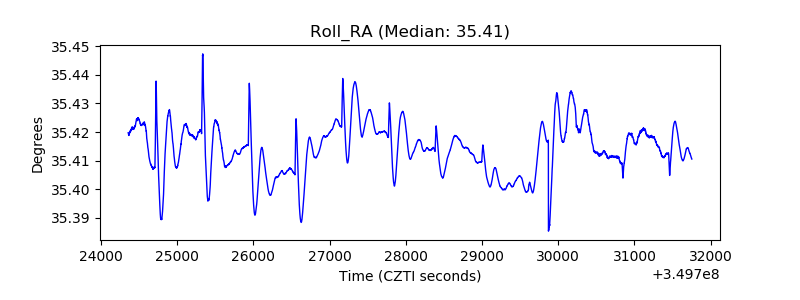 |
| Veto Counter | 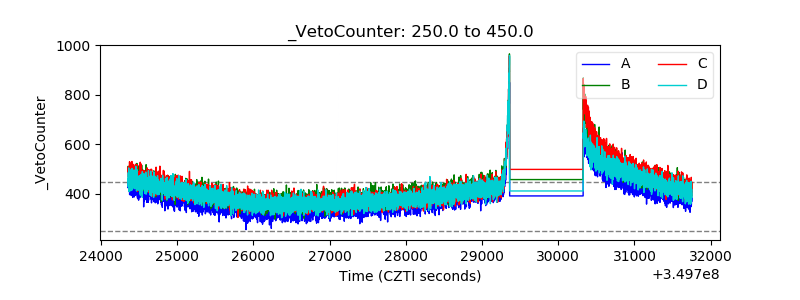 |