| Param | Original file | Final file |
|---|---|---|
| Filename | modeM0/AS1A10_064T01_9000004144_28889cztM0_level2.evt | modeM0/AS1A10_064T01_9000004144_28889cztM0_level2_quad_clean.evt |
| Size (bytes) | 734,512,320 | 92,885,760 |
| Size | 700.5 MB | 88.6 MB |
| Events in quadrant A | 3,160,212 | 628,402 |
| Events in quadrant B | 3,164,491 | 645,093 |
| Events in quadrant C | 4,033,884 | 601,654 |
| Events in quadrant D | 11,447,218 | 484,597 |
| Mode M0 | |||
|---|---|---|---|
| Quadrant | BADHDUFLAG | Total packets | Discarded packets |
| A | 0 | 13536 | 2 |
| B | 0 | 13495 | 2 |
| C | 0 | 16464 | 2 |
| D | 0 | 38427 | 2 |
| Mode SS | |||
|---|---|---|---|
| Quadrant | BADHDUFLAG | Total packets | Discarded packets |
| A | 0 | 132 | 0 |
| B | 0 | 132 | 0 |
| C | 0 | 132 | 0 |
| D | 0 | 132 | 0 |
| Mode M9 | |||
|---|---|---|---|
| Quadrant | BADHDUFLAG | Total packets | Discarded packets |
| A | 0 | 16 | 0 |
| B | 0 | 17 | 0 |
| C | 0 | 17 | 0 |
| D | 0 | 17 | 0 |
| Quadrant | Total seconds | Saturated seconds | Saturation percentage |
|---|---|---|---|
| A | 6483 | 10 | 0.154250% |
| B | 6483 | 20 | 0.308499% |
| C | 6483 | 126 | 1.943545% |
| D | 6483 | 3568 | 55.036249% |
Noise dominated data is calculated using 1-second bins in cleaned event files. If a bin has >2000 counts, and if more than 50% of those come from <1% of pixels, then it is considered to be noise-dominated and hence unusable.
| Quadrant | # 1 sec bins | Bins with >0 counts | Bins with >2000 counts | High rate bins dominated by noise | Noise dominated (total time) | Noise dominated (detector-on time) | Marked lightcurve |
|---|---|---|---|---|---|---|---|
| A | 7623 | 6484 | 0 | 0 | 0.00% | 0.00% | 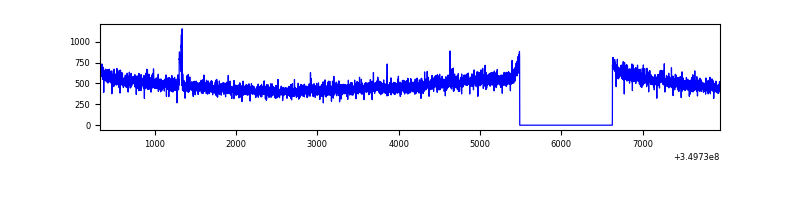 |
| B | 7623 | 6484 | 0 | 0 | 0.00% | 0.00% | 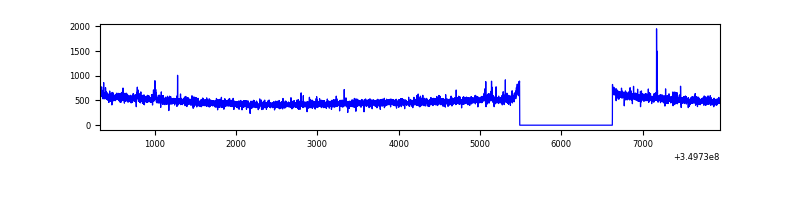 |
| C | 7623 | 6483 | 1 | 1 | 0.01% | 0.02% | 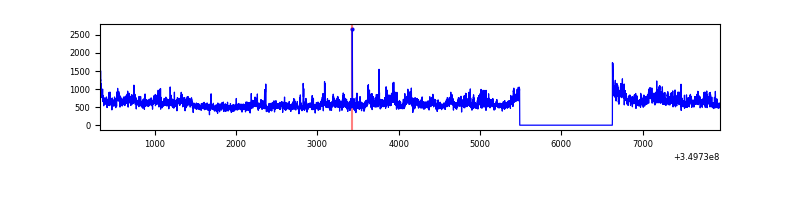 |
| D | 7623 | 6483 | 3583 | 3583 | 47.00% | 55.27% | 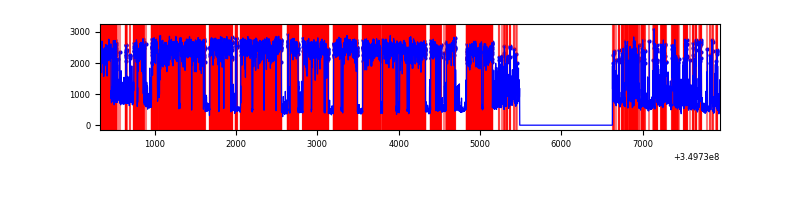 |
Top three noisy pixels from each quadrant. If the there are fewer than three noisy pixels in the level2.evt file, extra rows are filled as -1
| Pixel properties | Quadrant properties | ||||||
|---|---|---|---|---|---|---|---|
| Quadrant | DetID | PixID | Counts | Sigma | Mean | Median | Sigma |
| A | 13 | 6 | 48618 | 297.2 | 801 | 784 | 160.9 |
| A | 6 | 16 | 17208 | 102.04 | 801 | 784 | 160.9 |
| A | 13 | 254 | 11899 | 69.06 | 801 | 784 | 160.9 |
| B | 12 | 111 | 18429 | 116.09 | 800 | 779 | 152.0 |
| B | 11 | 111 | 16543 | 103.69 | 800 | 779 | 152.0 |
| B | 14 | 111 | 15131 | 94.4 | 800 | 779 | 152.0 |
| C | 3 | 233 | 824174 | 4558.64 | 775 | 781 | 180.6 |
| C | 14 | 238 | 138823 | 764.26 | 775 | 781 | 180.6 |
| C | 14 | 254 | 20660 | 110.06 | 775 | 781 | 180.6 |
| D | 8 | 195 | 8297544 | 52099.99 | 670 | 651 | 159.2 |
| D | 1 | 52 | 576181 | 3614.02 | 670 | 651 | 159.2 |
| D | 2 | 234 | 23199 | 141.59 | 670 | 651 | 159.2 |
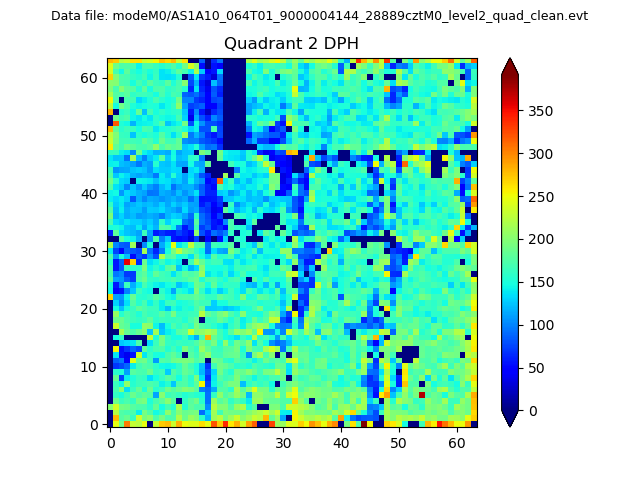
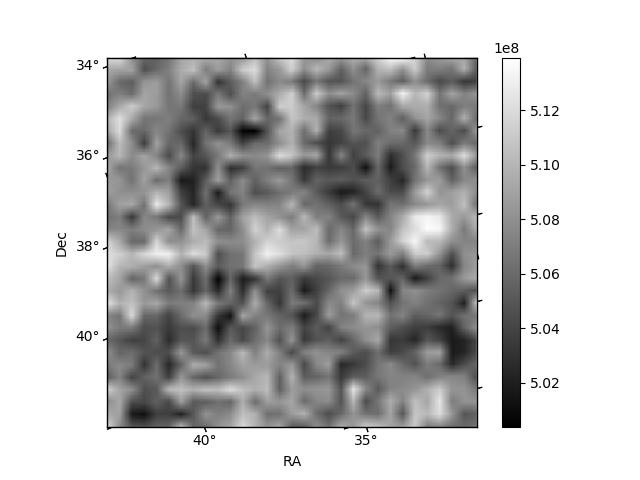
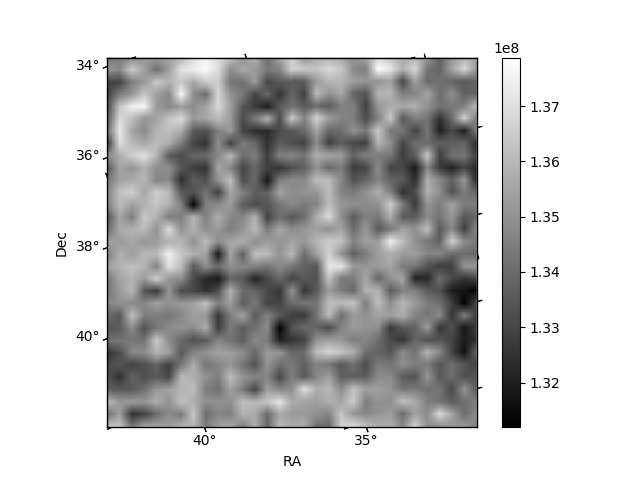
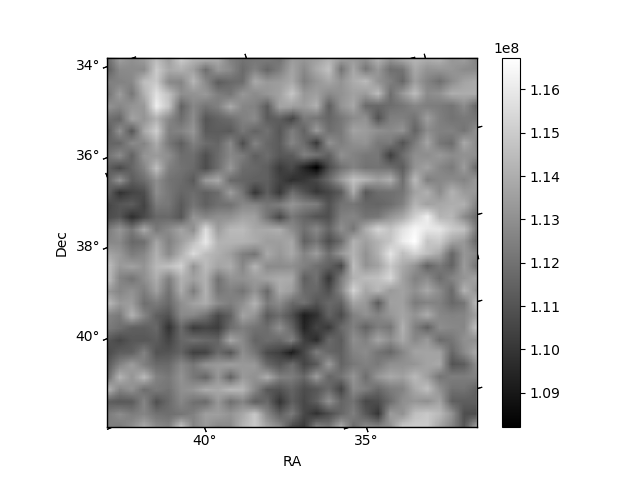
Histogram calculated using DETX and DETY for each event in the final _common_clean file
| Quadrant A | 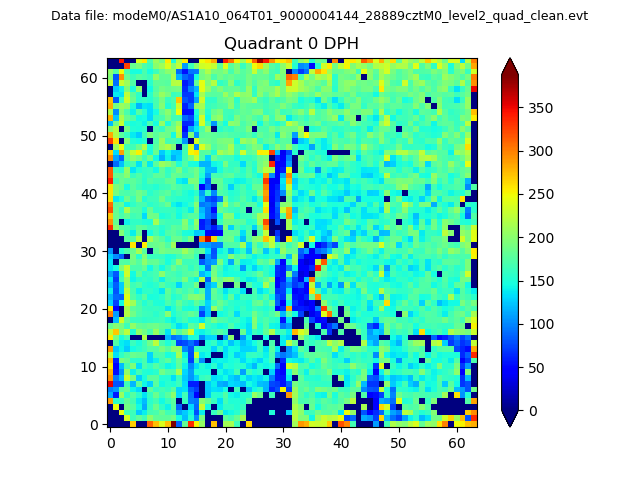 |
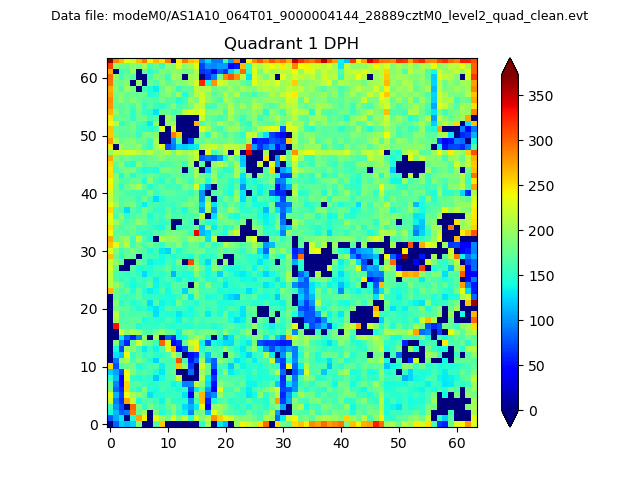 |
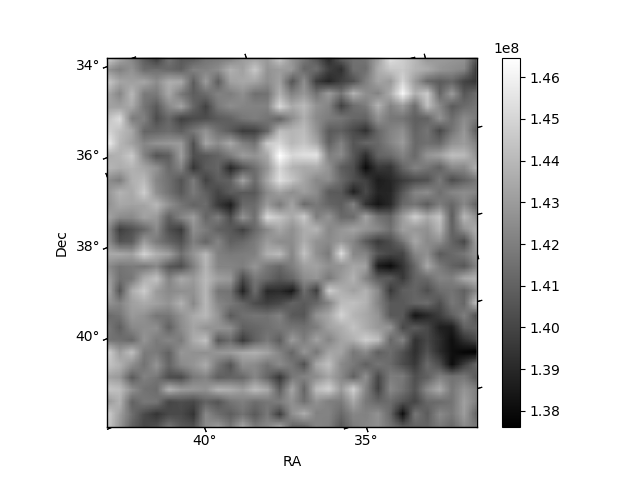
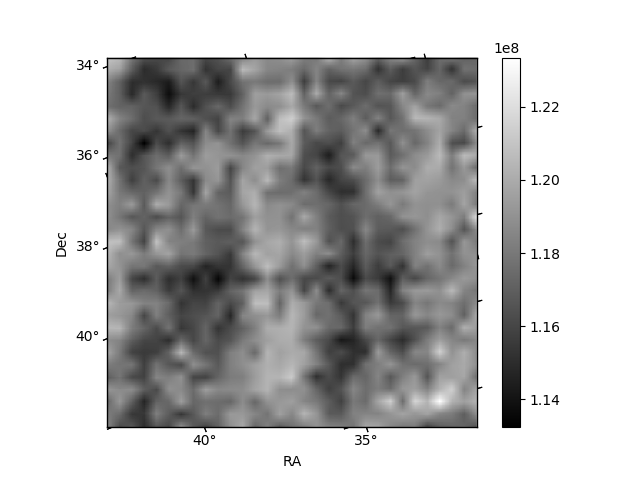
Quadrant B |
|---|---|---|---|
| Quadrant D | 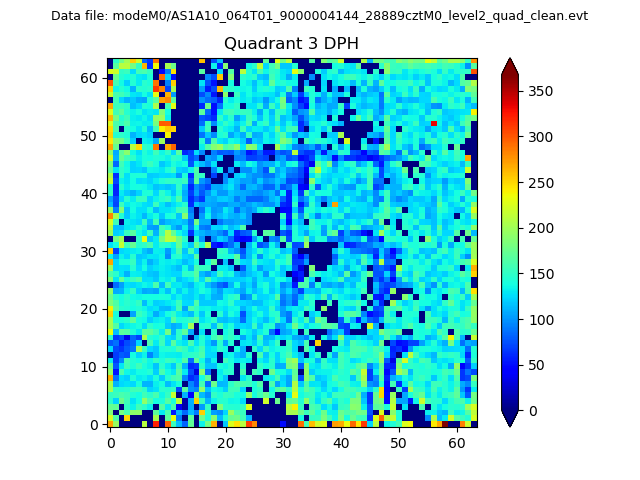 |
 |
Quadrant C |
| Plot type | Count rate plots | Images |
|---|---|---|
| Comparison with Poisson distribution Blue bars denote a histogram of data divided into 1 sec bins. Red curve is a Poisson curve with rate = median count rate of data. |
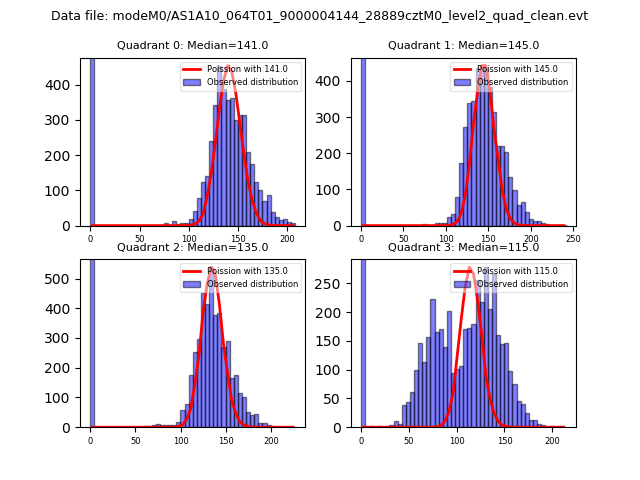 |
 |
| Quadrant-wise count rates Data is divided into 100 sec bins |
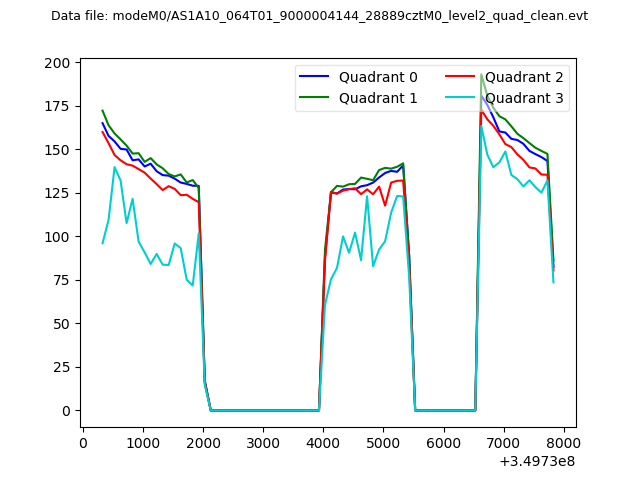 |
|
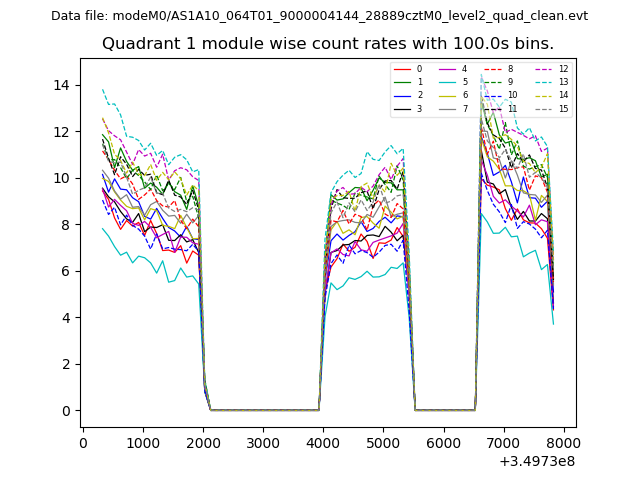
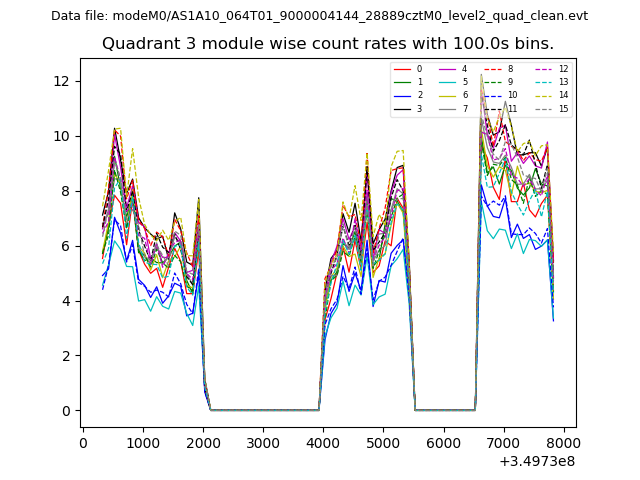
| Module-wise count rates for Quadrant A Data is divided into 100 sec bins |
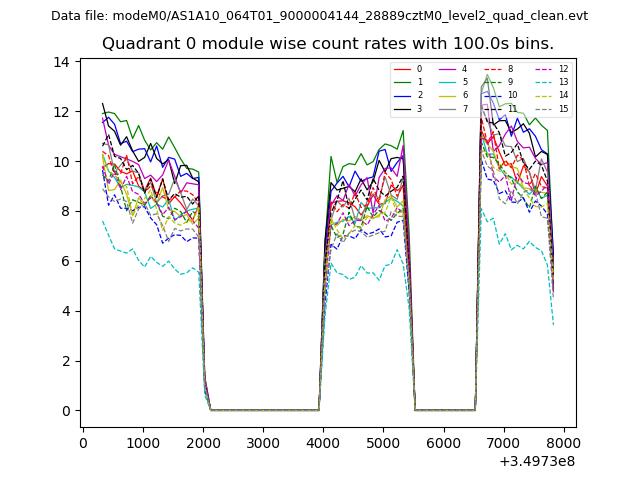 |
 |
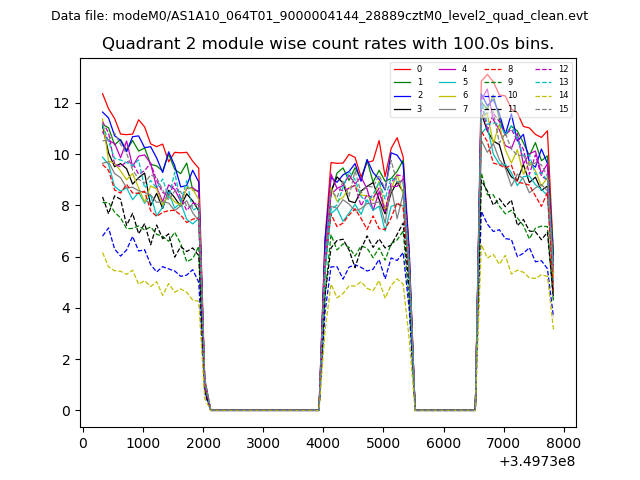
| Module-wise count rates for Quadrant B Data is divided into 100 sec bins |
 |
 |
| Module-wise count rates for Quadrant C Data is divided into 100 sec bins |
 |
 |
| Module-wise count rates for Quadrant D Data is divided into 100 sec bins |
 |
 |
| Parameter | Plot |
|---|---|
| CZT HV Monitor | 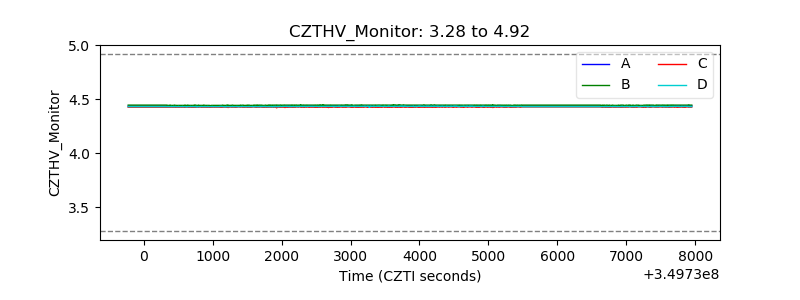 |
| D_VDD | 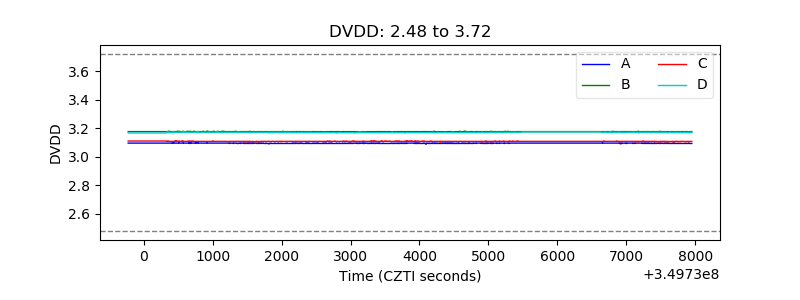 |
| Temperature 1 | 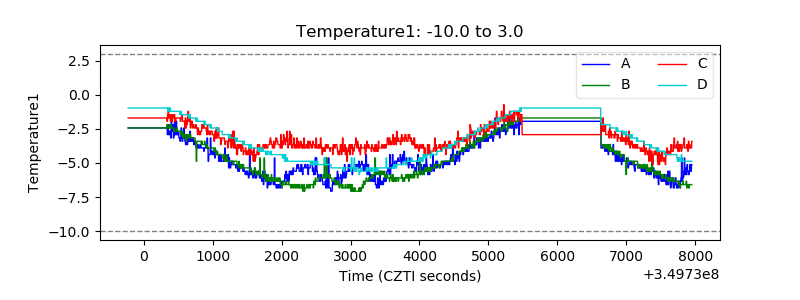 |
| Veto HV Monitor |  |
| Veto LLD | 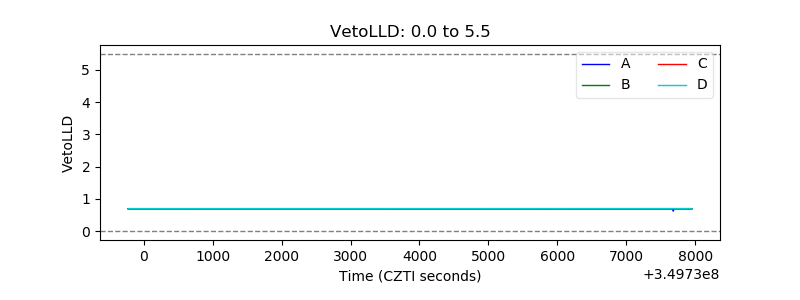 |
| Alpha Counter |  |
| _CPM_Rate | 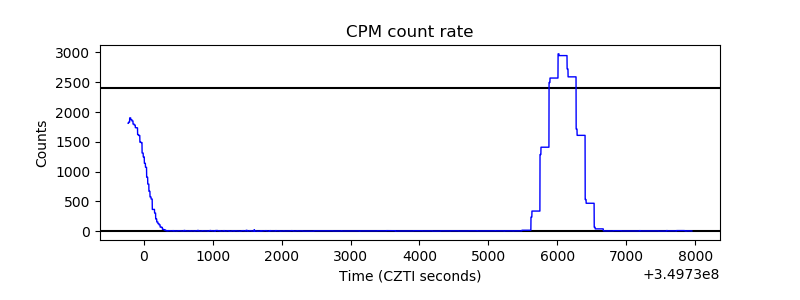 |
| CZT Counter | 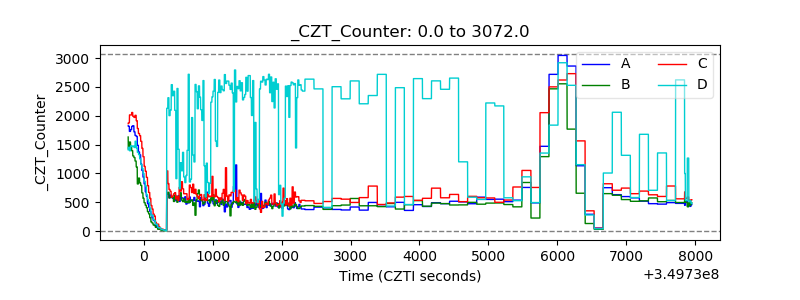 |
| +2.5 Volts monitor |  |
| +5 Volts monitor |  |
| _ROLL_ROT | 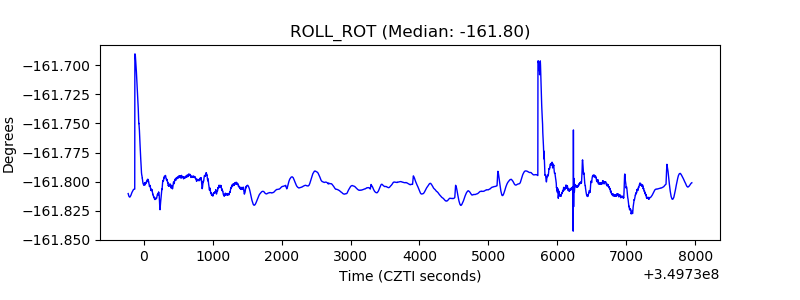 |
| _Roll_DEC | 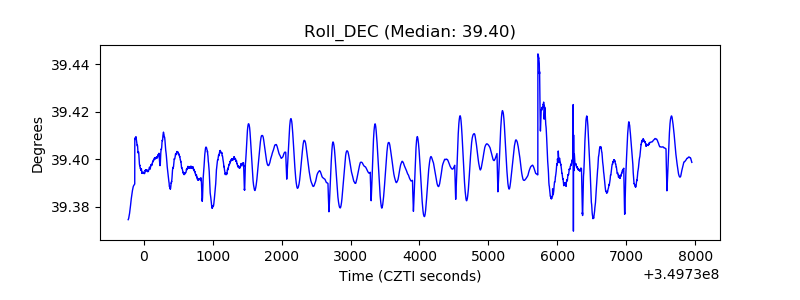 |
| _Roll_RA | 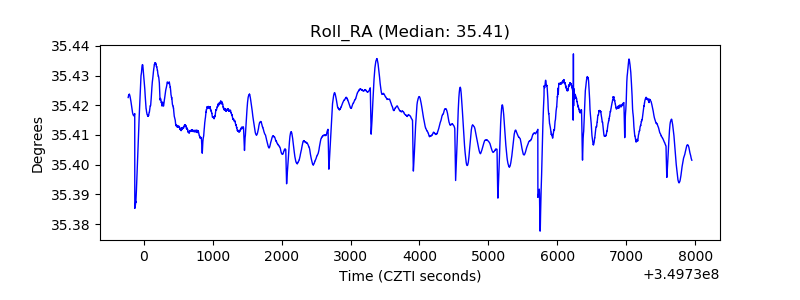 |
| Veto Counter | 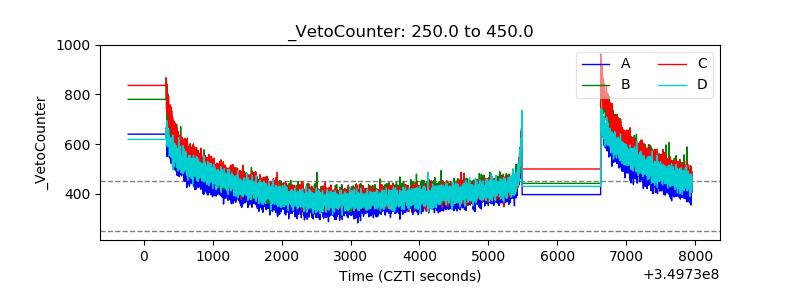 |